
Industrial Vending Machine Market Growth, Trends, Industry Analysis, 2024-2032
REPORT DETAILS
REPORT DETAILS
ABOUT THIS REPORT
Market Statistics
Market Outlook
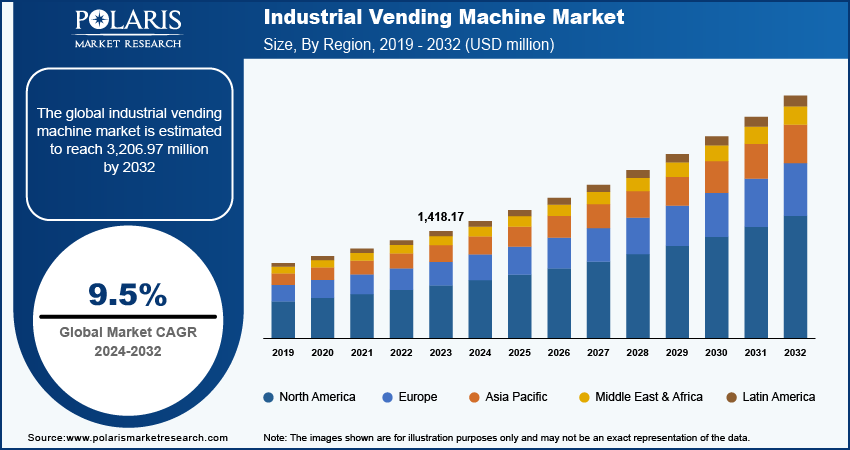
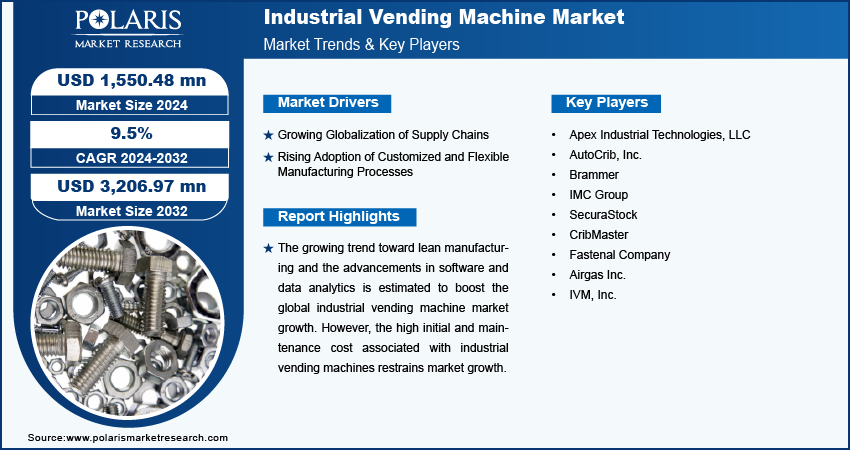
The industrial vending machine market size was valued at USD 1,418.17 million in 2023. The market is anticipated to grow from USD 1,550.48 million in 2024 to USD 3,206.97 million by 2032, exhibiting a CAGR of 9.5% during 2024–2032.
Market Overview
The growing trend toward lean manufacturing is driving the industrial vending machine market. Lean manufacturing focuses on minimizing waste and maximizing efficiency. Industrial vending machines support these goals by providing just-in-time access to tools, parts, and supplies, which helps prevent production delays and reduces downtime. This aligns perfectly with lean principles, making them a valuable addition to lean manufacturing environments.
The rising adoption of customized and flexible manufacturing processes is expected to boost the industrial vending machine market. Customized and flexible manufacturing processes require a wide range of tools, parts, and materials to accommodate different production runs and product variations. Industrial vending machines handle this variety by stocking multiple types of items in one location, ensuring that manufacturers have quick access to the diverse resources they need.
To Understand More About this Research: Download Sample Report
Market Drivers
Advancements in Software and Data Analytics
Modern software and data analytics enable more precise tracking and management of inventory. Industrial vending machines equipped with this advanced software provide real-time data on stock levels, usage rates, and replenishment needs. This data helps manufacturers optimize inventory levels, reduce stockouts, and prevent overstock situations. Therefore, advancements in software and data analytics boost the global industrial vending machine market.
Growing Globalization of Supply Chains
Global supply chains involve multiple suppliers and a diverse range of materials and components. Industrial vending machines help manage complexity in supply chain processes by centralizing the inventory of tools, parts, and supplies in one location. They streamline inventory management across different locations and stages of the supply chain, ensuring that all necessary items are available when needed. Thus, rising globalization of supply chains drives the industrial vending machine market growth.
Market Restraining Factors
Initial Cost and High Maintenance
The high initial and maintenance cost associated with industrial vending machines hinders the industrial vending machine market growth. Companies perform a cost-benefit analysis before investing in new technology. High initial costs make it difficult for companies, especially smaller ones or those with tight budgets, to justify the investment. This encourages these companies not to purchase an industrial vending machine, which, in turn, hampers market growth.
Segment Analysis
Market Breakdown – By Product Analysis
PPE Segment to Register Highest Growth Rate During Forecast Period
The PPE segment accounted for a major share of the market in 2023 due to the rising focus on workplace safety and regulatory compliance across various industries. PPE vending machines efficiently manage and distribute essential safety gear such as gloves, helmets, and protective eyewear. Moreover, these machines offer convenience and reduce the time workers spend searching for safety equipment, enhancing overall operational efficiency.
The industrial supplies segment is projected to grow at a substantial pace during the forecast period, owing to the rising demand for streamlined inventory management solutions across diverse industrial environments. Vending machines that cater to industrial supplies manage a broad range of items, including maintenance materials, cleaning supplies, and small tools. The integration of advanced data analytics and inventory tracking features in these machines provides detailed usage insights and facilitates efficient restocking processes, further supporting their growth.
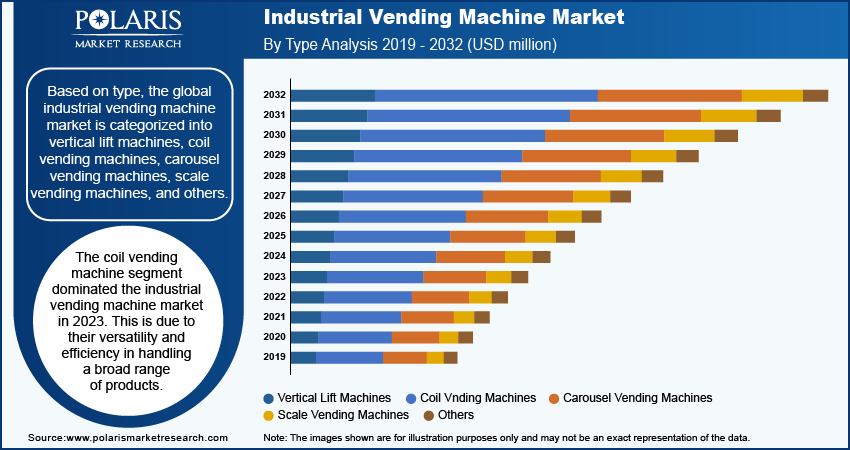
Market Breakdown – By Type Analysis
Coil Vending Machine Segment Held Largest Revenue Share in 2023
The coil vending machine segment dominated the industrial vending machine market in 2023. This is due to their versatility and efficiency in handling a broad range of products. These machines use coiled springs to store and dispense items, making them particularly well-suited for environments where rapid and reliable access to parts and tools is essential. Their ability to manage small to medium-sized components with varying dimensions and weights contributes to their widespread adoption across various industries such as manufacturing, automotive, and aerospace. The growth of coil vending machines is driven by their relatively lower initial investments compared to other types and their effectiveness in reducing inventory waste and optimizing stock levels.
The carousel vending machines segment is expected to grow at a robust pace in the coming years owing to their ability to handle a large variety of parts and tools in a compact footprint, which aligns with the increasing need for efficient space utilization in modern industrial settings. Additionally, advancements in software and automation technology enhance the functionality of carousel vending machines, enabling more precise inventory control and faster item retrieval.
Market Breakdown – By Industry Verticals Analysis
Manufacturing Segment Accounted for Significant Revenue Share in 2023
The manufacturing segment accounted for the largest revenue share in the industrial vending machine market in 2023 due to the extensive need for efficient and reliable management of tools, parts, and supplies. Manufacturing facilities benefit significantly from vending machines that streamline the distribution of essential components, thereby reducing downtime and enhancing productivity. The high volume of daily operations and the diverse array of tools and materials required make manufacturing environments particularly suited for these solutions. Additionally, the ability to track usage and manage inventory in real time helps manufacturers optimize stock levels, reduce waste, and ensure that critical components are always available, contributing to the sector's large market share.
The aerospace segment is estimated to register a significant CAGR in the coming years owing to the increasing demand for precise and efficient inventory management systems. Aerospace companies require stringent control over parts and tools to ensure compliance with safety standards and operational efficiency. Vending machines designed for aerospace applications offer advanced features such as high-security access, precise inventory tracking, and tailored storage solutions to handle specialized components. The need for sophisticated inventory management solutions will drive the adoption of these machines as the aerospace industry continues to expand and innovate, positioning aerospace as a major sector in the market.
Market Breakdown – Regional Insights
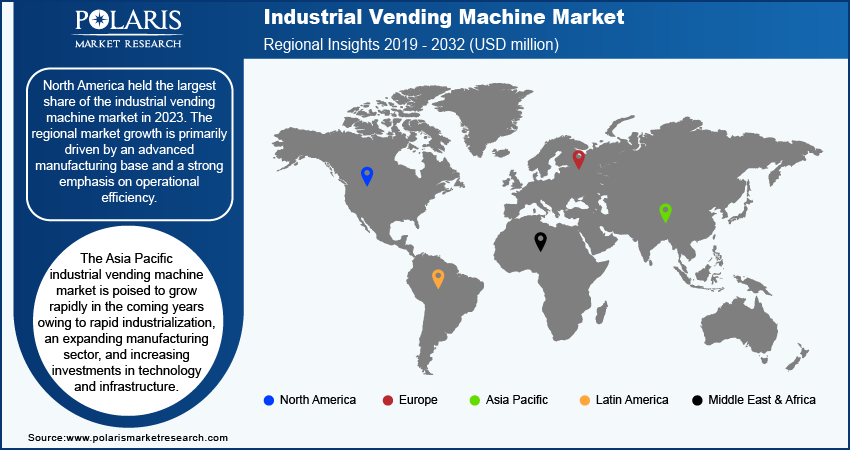
North America Accounted for Largest Share of Global Market in 2023
North America held the largest share of the industrial vending machine market in 2023. The region’s growth is primarily attributed to an advanced manufacturing base and a strong emphasis on operational efficiency. The US, in particular, emerged as a leader within North America due to its substantial industrial infrastructure and significant investments in automation technologies. Companies across various sectors in the US have increasingly adopted vending machines to streamline inventory management, reduce downtime, and enhance productivity. The region's robust industrial landscape, combined with stringent safety regulations and a focus on innovation, has propelled the widespread adoption of these systems. Moreover, smart vending equipment in food & beverages and other consumer retail spaces in the region are expected to boost the market. For instance, as per vending machine payments provider Cantaloupe reports, consumers purchased food and beverages worth more than USD 500 million from vending machines in the US and Canada in 2022.
The Asia Pacific industrial vending machine market is poised to grow rapidly in the coming years owing to rapid industrialization, an expanding manufacturing sector, and increasing investments in technology and infrastructure. The region's large manufacturing base and diverse industrial applications drive the demand for vending machines that handle various components and tools. The government's support for technological advancements and industrial automation further supports the market growth in the region.
Key Market Players and Competitive Insights
Major market players are investing heavily in research and development to expand their offerings, which will help the industrial vending machine market grow even more. Market participants are also undertaking a variety of strategic activities to expand their global footprint, with important market developments such as innovative launches, international collaborations, higher investments, and mergers and acquisitions between organizations. Major players in the industrial vending machine market are IMC Group; Apex Industrial Technologies, LLC; CribMaster; Airgas Inc.; and IVM, Inc.
Major Players
- Apex Industrial Technologies, LLC
- AutoCrib, Inc.
- Brammer
- IMC Group
- SecuraStock
- CribMaster
- Fastenal Company
- Airgas Inc.
- IVM, Inc.
- V-LINE GROUP
Recent Developments in Industry
March 2025: H-Vend Service Ltd introduced a next-generation range of digital vending machines backed by EU funding. The new systems are designed for remote monitoring and management and enable touchless operation, enhancing efficiency and user convenience.
April 2024: Lavazza announced plans to acquire a 100% stake in IVS, a major vending machine operator, for approximately US$ 197 million. The acquisition is intended to expand Lavazza’s footprint in the vending sector and support its broader omnichannel growth strategy.
January 2024: the Tacoma, WA-based MRO supplies distributor, acquired IMC Supply, a wholesale MRO supplier specializing in cutting tools for the industrial and construction industries.
May 2023: TASNEE, an industrial and petrochemical company, and V-LINE GROUP, a supply chain solutions provider, officially inaugurated the first pilot service project for industrial vending machines in Saudi Arabia at TASNEE’s facility in Yanbu. These vending machines provide industrial consumables & MRO parts to the end users directly where they are needed.
Report Coverage
The industrial vending machine market report emphasizes key regions across the globe to provide a better understanding of the product to the users. Also, the report provides market insights into recent developments and trends and analyzes the technologies that are gaining traction across the globe. Furthermore, the report covers an in-depth qualitative analysis pertaining to various paradigm shifts associated with the transformation of these solutions. The report provides a detailed analysis of the market while focusing on various key aspects such as competitive analysis, offering, product, type, business model, industry vertical, and futuristic opportunities.
Report Segmentation
The industrial vending machine market is primarily segmented on the basis of offering, product, type, business model, industry verticals, and region.
By Offering Outlook (Revenue – USD Million, 2019–2032)
- Hardware
- Software
By Product Outlook (Revenue – USD Million, 2019–2032)
- PPE
- Fastening
- Hand Tools
- Power Tools
- Industrial Supplies
- Others
By Type Outlook (Revenue – USD Million, 2019–2032)
- Vertical Lift Machines
- Coil Vending Machines
- Carousel Vending Machines
- Scale Vending Machines
- Others
By Business Model Outlook (Revenue – USD Million, 2019–2032)
- Supplier-Managed Solutions
- Supplier Agnostic Solutions
By Industry Vertical Outlook (Revenue – USD Million, 2019–2032)
- Aerospace
- Construction
- Healthcare
- Automotive
- Manufacturing
- Oil & Gas
- Other
By Regional Outlook (Revenue – USD Million, 2019–2032)
- North America
- US
- Canada
- Europe
- Germany
- France
- UK
- Italy
- Spain
- Netherlands
- Russia
- Rest of Europe
- Asia Pacific
- China
- Japan
- India
- Malaysia
- South Korea
- Indonesia
- Australia
- Vietnam
- Rest of Asia Pacific
- Middle East & Africa
- Saudi Arabia
- UAE
- Israel
- South Africa
- Rest of Middle East & Africa
- Latin America
- Mexico
- Brazil
- Argentina
- Rest of Latin America
Report Scope
| Report Attributes | Details |
| Market Size Value in 2024 | USD 1,550.48 million |
| Revenue Forecast in 2032 | USD 3,206.97 million |
| CAGR | 9.5% from 2024 to 2032 |
| Base Year | 2023 |
| Historical Data | 2019–2022 |
| Forecast Period | 2024–2032 |
| Quantitative Units | Revenue in USD million and CAGR from 2024 to 2032 |
| Segments Covered |
|
| Regional Scope |
|
| Competitive Landscape | Industrial Vending Machine Industry Trend Analysis (2023) Company Profiles/Industry participants profiling includes company overview, financial information, product/service benchmarking, and recent developments |
| Report Format | PDF + Excel |
| Customization | Report customization as per your requirements with respect to countries, regions, and segmentation. |
FAQ's
The global industrial vending machine market size was valued at USD 1,418.17 million in 2023 and is projected to grow to USD 3,206.97 million by 2032.
The global market is projected to register a CAGR of 9.5% during the forecast period.
North America accounted for the largest share of the global market in 2023.
Apex Industrial Technologies, LLC; AutoCrib, Inc.; Brammer; IMC Group; SecuraStock; CribMaster; Fastenal Company; Airgas Inc.; and IVM, Inc. are among the key market players.
The aerospace segment is projected for significant growth in the global market during the forecast period.
The PPE segment dominated the industrial vending machine market in 2023.
Download Sample Report of Industrial Vending Machine Market
Please fill out the form to request a customized copy of the research report.
