
Biodiversity Credit Market Share, Size, and Global Outlook 2034
REPORT DETAILS
Biodiversity Credit Market Summary
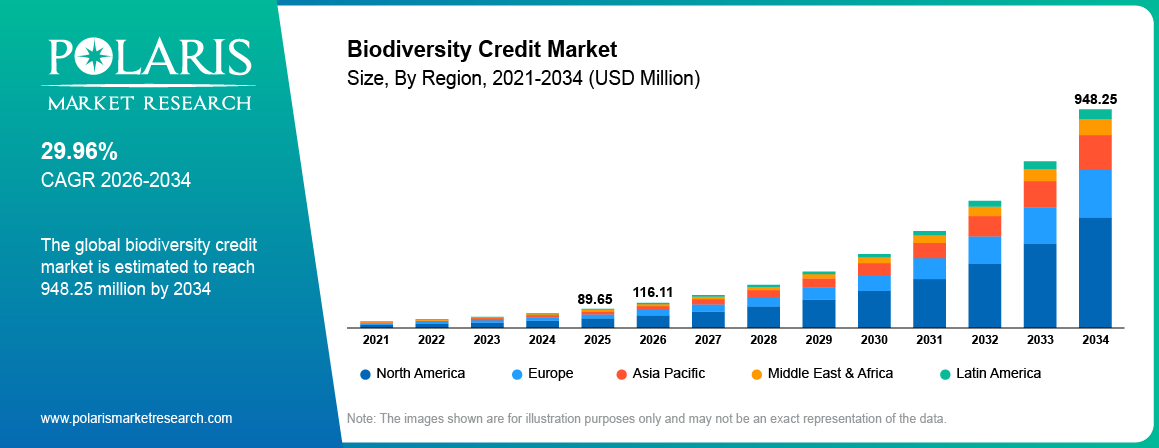
The global biodiversity credit market is estimated around USD 89.65 million in 2025,with consistent growth anticipated during 2026–2034. Growth is driven by rising sustainability commitments, biodiversity restoration investments, and global conservation regulations under the COP15 United Nations Biodiversity Conference framework. The market is projected to grow at a CAGR of 29.96% during the forecast period.
Market Statistics
Key Takeaways
-
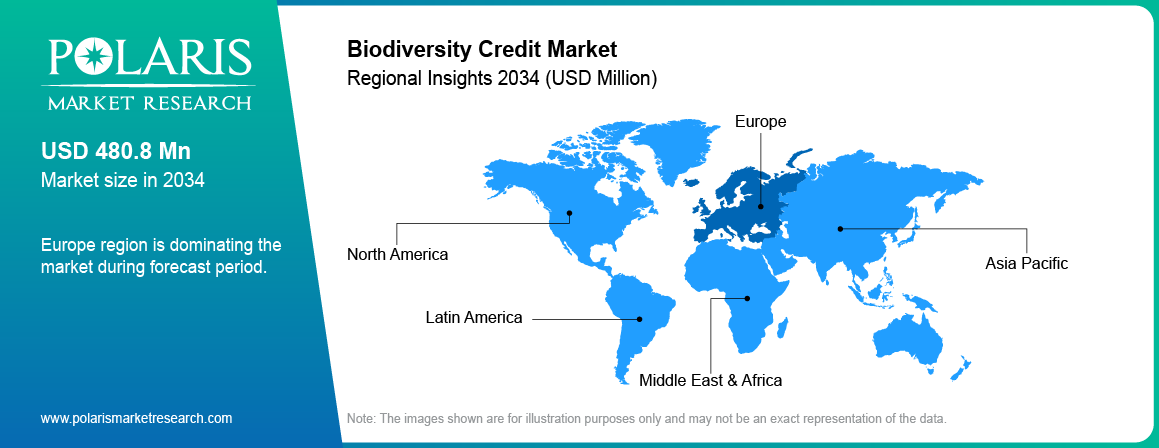
Europe dominated the biodiversity credits market in 2025, accounting for approximately 38.42% of the total market share due to strict biodiversity regulations and strong funding support for ecosystem protection initiatives.
-
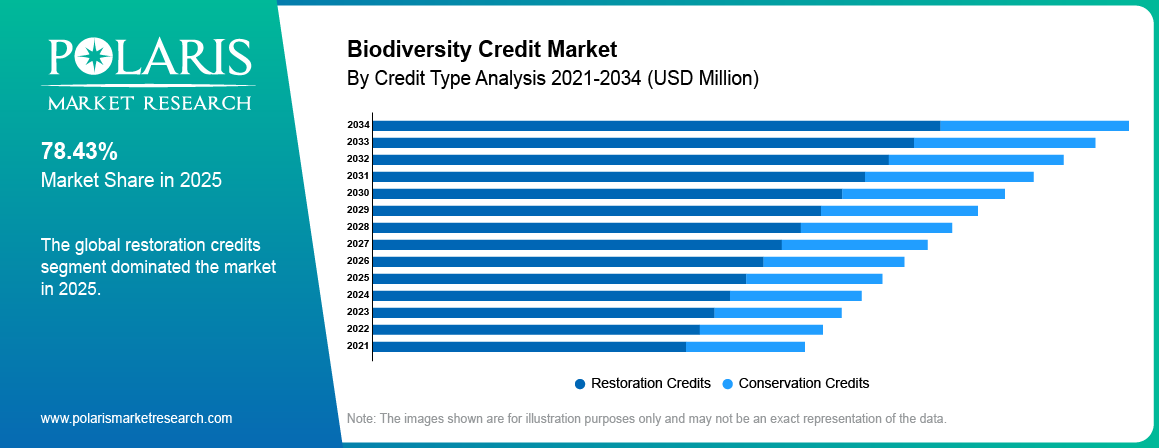
Restoration credits dominated the market in 2025, holding nearly 41.76% market share owing to rising investments in ecosystem rehabilitation and habitat restoration projects globally.
-
Infrastructure & real estate dominated the market by application in 2025 with around 36.18% share due to increasing biodiversity offset requirements associated with commercial and infrastructure development projects.
-
Marine ecosystems are anticipated to register the highest CAGR of approximately 15.84% during the forecast period owing to growing investments in coastal restoration and coral reef conservation projects.
-
Some of the key players operating in the market include Biodiversity Credit Alliance, Climate Impact X, Ekos K?m?hi Ltd, DGB Group, Mossy Earth, and others.
Industry Dynamics
- Increasing requirements for ESG compliance are boosting uptake of biodiversity credits
- Companies’ net-positive environmental pledges are fueling market demand
- Absence of price standardization impedes market transparency
- Environmental trading platforms enabled by blockchain technology present growth prospects
What is Biodiversity Credit?
Biodiversity credits refer to the measurement of positive outputs resulting from efforts aimed at ecosystem conservation, restoration, habitat protection, and species protection. Biodiversity credits give investors opportunities to contribute towards biodiversity enhancement projects while also meeting their environmental impact requirements. The system is similar to carbon credit systems but focuses more on ecosystem restoration and species preservation.
The biodiversity credit value chain consists of the project developer, the conservation groups, the landowner, verification firms, environmental registry companies, traders, investors, and corporate clients. While project developers come up with ecosystem restoration projects, verification firms confirm ecological improvement.
Source: Polaris Market Research Analysis
Growing biodiversity loss across global ecosystems is increasing demand for financial conservation tools. According to the World Economic Forum, over half of global GDP or USD 44 trillion of economic value generation remains moderately or highly dependent on nature.The widening funding gaps in conservation efforts and the growing commitment to sustainability are boosting market growth.
Drivers & Opportunities
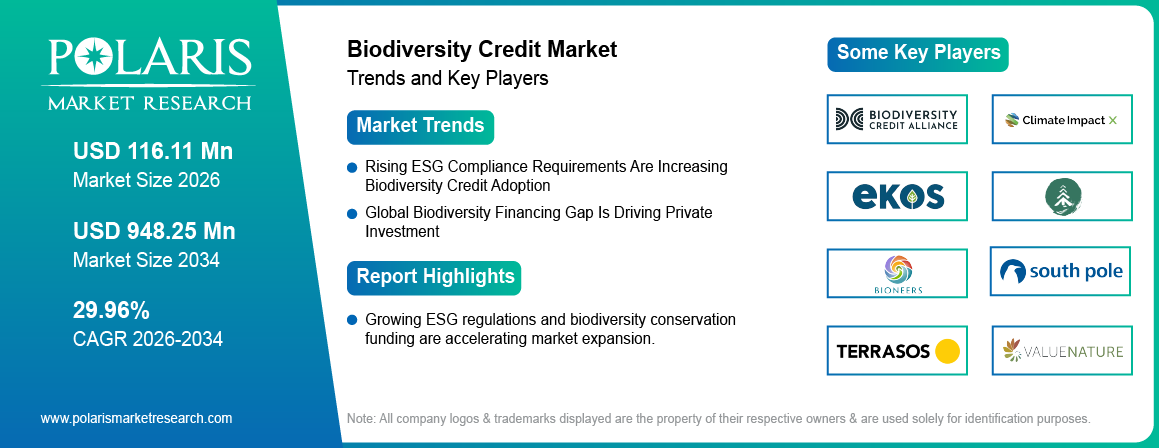
Rising ESG Compliance Requirements Are Increasing Biodiversity Credit Adoption: There is a growing trend among large organizations to increase their biodiversity pledges as environmental reporting gains more relevance within global supply chains. As indicated in the Protected Planet Report 2024, there is an indication that protected areas account for 17.6% of land and inland water and 8.4% of marine areas.This shows that there is a need to accelerate efforts in order to reach the goals for 2030. It is evident that investors are assessing their exposure to biodiversity in ESG frameworks.
Global Biodiversity Financing Gap Is Driving Private Investment: Governments have substantial shortfalls in the financing of their conservation efforts. According to the United Nations Environment Programme Finance Initiative, the worldwide annual biodiversity finance gap stands at USD 700 billion.Private sector involvement is rising due to the ability to monetize through biodiversity credits. Financial firms and institutional investors are getting involved in nature-related investment vehicles.
Restraints & Challenges
Lack of Standardization Is Limiting Market Growth: There is no unified system for valuation of biodiversity credits as there are no universal pricing, measuring, and verification systems. Differences between project methodology make it difficult to establish a single value for biodiversity credits.
Opportunity
Blockchain-Based Biodiversity Trading Platforms Are Creating New Growth Opportunities: Technological companies are creating blockchain-based platforms that is expected to enhance the traceability and transparency of credits. In May 2026, Muri bei Bern introduced the Switzerland’s first biodiversity voucher for a municipality known as BIDI, which rewards local biodiversity conservation efforts via a digital platform that has been set at a 1:1 exchange ratio with the Swiss franc. These platforms are expected to support large-scale institutional participation during the forecast period.
Financial Modeling & Pricing Intelligence
| Ecosystem Type | Average Price per Hectare (USD) | Estimated ROI Potential (10-Year) |
| Forest Restoration | USD 25,000 – USD 120,000 | 12% – 18% |
| Wetlands | USD 50,000 – USD 200,000 | 15% – 22% |
| Grasslands | USD 10,000 – USD 50,000 | 8% – 14% |
| Marine Ecosystems | USD 80,000 – USD 250,000 | 18% – 25% |
Source: Polaris Market Research Analysis
Marine and wetland restoration initiatives tend to fetch higher prices owing to scarcity and greater complexity of the restoration process, whereas grassland initiatives are comparatively cheaper.
Project-Level Financial Model
Assumptions
- Land Area: 1,000 hectares
- Restoration Cost: USD 15 Million
- Annual Credit Yield: 1,200 credits
- Average Price per Credit: USD 8,000
Financial Outputs
- Annual Revenue: USD 9.6 Million
- Payback Period: Approximately 3–4 years
- Internal Rate of Return (IRR): 18%–24%
There is growing investor appetite for large-scale restoration projects due to their comparatively shorter payback periods and long-term monetization prospects.
Supply-Demand Economics
Growing demand for biodiversity credits is forecasted at about 25% CAGR on the back of increasing commitments to ESGs and biodiversity laws. On the other hand, supply is forecasted to increase at almost 15% CAGR, which implies a long-term supply shortfall that allows premium pricing within select valuable ecosystems.
Comparison with Carbon Credits
| Metric | Biodiversity Credits | Carbon Credits |
| Pricing | High variability | More standardized |
| ROI Potential | Higher | Moderate |
| Risk Level | Higher | Lower |
| Market Maturity | Early-stage | Mature |
Source: Polaris Market Research Analysis
While biodiversity credits have more lucrative pricing opportunities, they also have greater risks associated with verification, as compared to carbon credits, owing to their nascent stage of development.
Source: Polaris Market Research Analysis
Segmental Insights
The report offers an exhaustive analysis of the biodiversity credits market by credit type, application, and ecosystem is helping identify the most profitable and promising areas.
By Credit Type
-
Restoration Credits
The restoration credits category led the market in 2025 due to increasing spending on afforestation, wetlands restoration, and ecosystems renewal programs. Governments and non-profit organizations are investing in big restoration programs. Rising land degradation across developing economies is further increasing demand for restoration-based biodiversity projects.
-
Conservation Credits
The conservation credits segment is projected to grow at the fastest CAGR during the forecast period due to rising corporate investments in preserving natural habitats and preventing biodiversity loss. Large multinational corporations are beginning to buy more conservation credits as part of their efforts to reinforce their sustainability pledges voluntarily and enhance their ESG reporting capabilities.
By Application
-
Infrastructure & Real Estate
The infrastructure & real estate segment was the market leader in 2025 due to the increase in biodiversity offset needs for commercial building projects. There is an increasing trend of buying credits for meeting environmental compliance standards.
-
Mining & Energy
Mining & energy is the highest CAGR category expected to see growth throughout the forecast period owing to growing environmental regulations associated with mining and energy projects. There has been an increase in the investments made by companies towards the development of biodiversity offsets to minimize their environmental impact.
By Ecosystem
-
Forest Ecosystems
Forest ecosystems held the largest share of the carbon credits market in 2025 owing to extensive investments in afforestation activities and the growing popularity of conservation programs involving forests. The carbon sequestration properties and ecosystem services offered by forests make them attractive for project developers.
-
Wetlands
The wetlands sector is expected to witness a considerable CAGR throughout the forecast period owing to increasing investment in habitat and flood protection projects. There has been rising government funding for wetlands conservation projects.
Source: Polaris Market Research Analysis
Regional Analysis
Europe Biodiversity Credit Market Overview
Europe led the market during the forecast period due to strict biodiversity regulations, sustainable policies, and large conservation funding programs. Nations like Germany, France, the UK, and the Netherlands have been backing biodiversity offsets initiatives. The EU Biodiversity Strategy continues to facilitate market growth. For example, the European Commission is targeting to safeguard 30% of the EU’s lands and seas by 2030 as per its Biodiversity Strategy.
North America Biodiversity Credit Market Insights
North America region has a substantial market share due to increasing corporate investment in ESG initiatives and voluntary biodiversity offsets. The US and Canada are seeing higher involvement from private sector players and environmental projects developers. As of May 2026, Amazon made an investment of 700 MW in carbon-free energy projects in Nevada, US, which include 100 MW of geothermal and 600 MW of solar projects to power its data centers.
Asia Pacific Biodiversity Credit Market Insights
Asia Pacific is projected to grow at the fastest CAGR during the forecast period due to rising conservation investments across China, India, Australia, and Southeast Asia. More ecosystem restoration programs have been started by various governments to cope with deforestation and loss of biodiversity. Food and Agriculture Organization of the United Nations announced a USD 42 million program for protecting primary forests in Southeast Asia and the Pacific region during June 2025.
Latin America and Middle East & Africa
Latin America and Middle East & Africa region is experiencing steady growth owing to increasing investments in conservation as well as funding for the environment on the international front. For instance, in March 2025, Saudi Arabia started a USD 266.6 million environmental finance program. Moreover, Brazil, Colombia, Peru, South Africa, UAE, and Kenya are among those countries who are undertaking initiatives related to rainforest, wildlife, and land conservation.
Source: Polaris Market Research Analysis
Competitive Landscape & Key Players
The market is moderately fragmented due to the involvement of conservation project developers, verifiers, environmental registries, and sustainability exchanges. Factors affecting competition in the market include the reputation of the project, quality of verification, price transparency, and extent of ecosystem coverage. Businesses are emphasizing business collaborations, technological implementation, and geographical diversification. Some companies are also developing digital monitoring systems for improved accuracy of biodiversity measurement.
Among the major companies operating in this industry are Biodiversity Credit Alliance, Climate Impact X, Ekos Kāmahi Ltd, DGB Group, Mossy Earth, Bioneers, South Pole, Terrasos, The Biodiversity Consultancy, Value Nature, Verra, Wildlife Works, and others.
Premium Insights
Nature-Positive Economy
The global shift toward nature-positive economic models is expected to support long-term growth in the biodiversity credit market. Governments, businesses, and financial organizations are adopting sustainability policies aligned with restoring the ecosystems, thus enhancing the need for biodiversity-based financial products.
Institutional Capital Entry
There is increasing interest among private equity houses, sovereign wealth funds, and impact investors in biodiversity projects as possible environmental assets. The growing number of investments into conservation financing and natural capital projects is expected to lead to better funding opportunities for large biodiversity projects.
Tokenization of Biodiversity Credits
The blockchain technology is becoming more popular as it is believed that it increases transparency and liquidity in biodiversity credits transactions. Tokenization is projected to allow fractional investment, improve tracking, and involve more institutional and retail investors.
Key Players
- Biodiversity Credit Alliance
- Climate Impact X
- Ekos Kāmahi Ltd
- DGB Group
- Mossy Earth
- Bioneers
- South Pole
- Terrasos
- The Biodiversity Consultancy
- Value Nature
- Verra
- Wildlife Works
Industry Developments
- May 2026: New Zealand’s government-backed biodiversity credit scheme is expected to attract funding for ecosystem restoration through stronger standards, transparency, and conservation oversight. [source: www.forestandbird.org.nz]
Biodiversity Credit Market Segmentation
By Credit Type Outlook (Revenue, USD Million, 2021-2034)
- Restoration Credits
- Conservation Credits
By Application Outlook (Revenue, USD Million, 2021-2034)
- Infrastructure & Real Estate
- Mining & Energy
- Agriculture
By Ecosystem Outlook (Revenue, USD Million, 2021-2034)
- Forest Ecosystems
- Wetlands
- Marine
By Regional Outlook (Revenue, USD Million, 2021-2034)
- North America
- US
- Canada
- Europe
- Germany
- France
- UK
- Italy
- Spain
- Netherlands
- Russia
- Rest of Europe
- Asia Pacific
- China
- Japan
- India
- Malaysia
- South Korea
- Indonesia
- Australia
- Vietnam
- Rest of Asia Pacific
- Middle East & Africa
- Saudi Arabia
- UAE
- Israel
- South Africa
- Rest of Middle East & Africa
- Latin America
- Mexico
- Brazil
- Argentina
- Rest of Latin America
Biodiversity Credit Market Report Scope
| Report Attributes | Details |
| Market Size in 2025 | USD 89.65 Million |
| Market Size in 2026 | USD 116.11 Million |
| Revenue Forecast by 2034 | USD 948.25 Million |
| CAGR | 29.96% from 2026 to 2034 |
| Base Year | 2025 |
| Historical Data | 2021–2024 |
| Forecast Period | 2026–2034 |
| Quantitative Units | Revenue in USD Million and CAGR from 2026 to 2034 |
| Report Coverage | Revenue Forecast, Competitive Landscape, Growth Factors, and Industry Trends |
| Segments Covered |
|
| Regional Scope |
|
| Competitive Landscape |
|
| Report Format |
|
| Customization | Report customization as per your requirements with respect to countries, regions, and segmentation. |
Source: Polaris Market Research Analysis
Biodiversity Credit Market FAQ's
The global market size was valued at USD 89.65 Billion in 2025 and is projected to grow to USD 948.25 Billion by 2034.
Europe dominated the market in 2025 due to stronger biodiversity regulations.
Major applications include infrastructure, mining, corporate ESG programs, and government conservation programs.
A few of the key players in the market are Biodiversity Credit Alliance, Climate Impact X, Ekos K?mahi Ltd, DGB Group, Mossy Earth, Bioneers, South Pole, Terrasos, The Biodiversity Consultancy, Value Nature, Verra, Wildlife Works, and others.
Growth is driven by rising ESG regulations, biodiversity funding gaps, and corporate sustainability commitments.
The major use cases are seen in infrastructure, mining, agriculture, energy, and corporate ESG programs due to the increasing environmental regulations.
The market is expected to witness strong growth due to rising institutional investments and nature-positive economic policies.
Download Sample Report of Biodiversity Credit Market
Please fill out the form to request a customized copy of the research report.
