
Hydrogen Fluoride Gas Detection Market Share, Size, Trends, Industry Analysis Report, 2022 - 2030
REPORT DETAILS
REPORT DETAILS
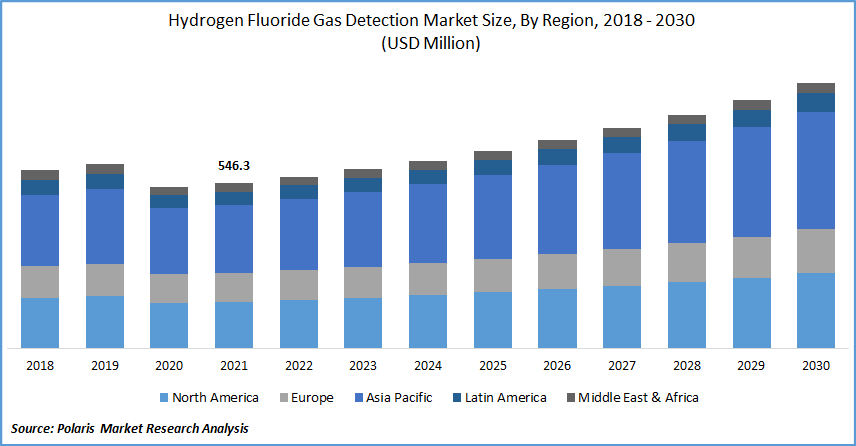
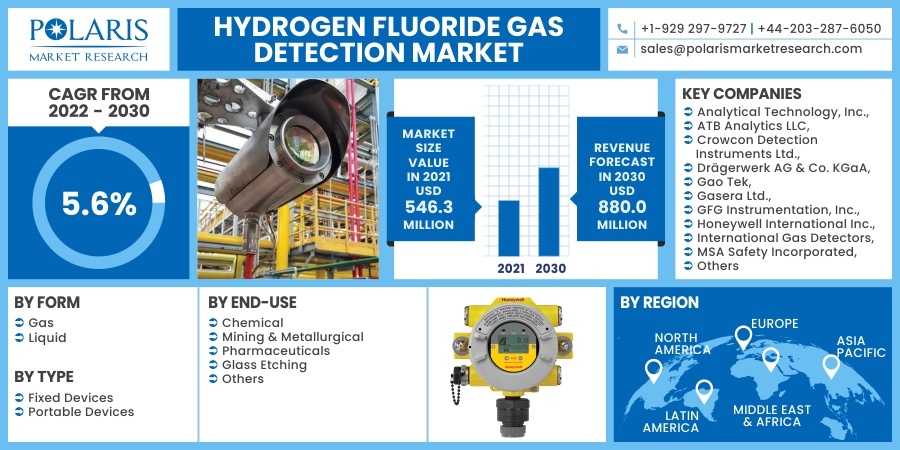
The global hydrogen fluoride gas detection market was valued at USD 546.3 million in 2021 and is expected to grow at a CAGR of 5.6% during the forecast period. Factors such as strict regulations for human and environmental safety and the rising adoption of IoT by end-use industries are driving the hydrogen fluoride gas detection market growth during the forecast period.
 Know more about this report: Download Sample Report
Government regulations heavily influence the expansion of the hydrogen fluoride gas detection industry. Even though hydrogen fluoride is extremely corrosive, it is hazardous to human health and the environment. To preserve human lives and the environment, various governing bodies, such as the Occupational Safety and Health Administration (OSHA) and the Environmental Protection Agency (EPA), have established guidelines that regulate the manufacture and usage of hydrogen fluoride and its sensor systems.
The EPA is an independent executive agency of the United States federal government charged with environmental protection. The AGEL-1 for hydrofluoric acid is 1.0 ppm as an 8-hour TWA, the AGEL-2 for hydrofluoric acid is 12.0 ppm as an 8-hour TWA, and the AGEL-3 for hydrofluoric acid is 22.0 ppm as an 8-hour TWA, according to their guidelines. In addition, several end-use industries, including chemical, refinery, and pharmaceuticals, are required to submit data to the EPA regarding their safety practices and so on.
Industry Dynamics
Growth Drivers
Key players have used a variety of business expansions, including agreements, acquisitions, partnerships, expansions, and product launches. Agreements have been the most dominant strategy used by key players to expand their customer base. For instance, in September 2021, MSA Safety Incorporated established a global center of excellence for exploration technology by opening a new 20,000 square-foot production facility in Cranberry Township, New Jersey.
Further, in July 2021, Bacharach, Inc. was acquired by MSA Safety Corporation. MSA's access to its markets around the globe was speed-up the acquisition process. Also, in June 2021, Drägerwerk AG & Co. KGaA collaborated with AWC, Inc., a global technology distribution company of control and instrumentation equipment. AWC, Inc. reflects and encourages Dräger's fixed flame and hydrogen fluoride gas detection system portfolio revenues in Louisiana, Tennessee, and Alabama. In May 2021, Drägerwerk AG & Co. KGaA introduced the new Polytron 6100 EC WL, a Bluetooth gas discovery solution for adaptable and cost-effective industrial plant monitoring.
Know more about this report: Download Sample Report
Report Segmentation
The market is primarily segmented based on form, type, end-use, and region.
| By Form | By Type | By End-Use | By Region |
|
|
|
|
Know more about this report: Download Sample Report
Insight by End-Use
The chemical market segment is expected to be the most significant revenue contributor in the global hydrogen fluoride gas detection market. It is used to produce chemical groups, particularly refrigerants used in refrigerators and air conditioners. It could also be used as a motivator in producing alkanes from smaller alkenes.
More accurate hydrogen fluoride gas monitoring and detection devices are needed to avoid any potentially hazardous accidents on the field in this segment. Thus, there is a rise in demand for highly accurate, dependable hydrogen fluoride gas detection systems in the chemical industry. So, the chemical industry's hydrogen fluoride gas detection industry is expected to grow at the fastest CAGR during the forecast period.
Geographic Overview
Asia Pacific had the largest revenue share in the global market. Technological advancement and a strong emphasis on energy harvesting in China, India, and South Korea are major contributors to this growth. China and Japan are industrial powerhouses with a wide range of electronic equipment, instruments, materials, automotive, and other industries that rely heavily on silicon chips.
Furthermore, the industrial transition toward digitization is anticipated to convert manual processes in the manufacturing industries into digital processes. This is expected to boost demand for advanced and miniaturized electronic products and materials.
Moreover, North America is anticipated to witness a high CAGR in the global hydrogen fluoride gas detection market. The North American oil and gas and chemical industries have seen significant growth in the market in recent years. This increase can be attributed to the growing need for the security and safety of workers who work in environments in which they are directly exposed to toxic gases.
Competitive Insight
Some of the major players operating in the global market include Analytical Technology, Inc., ATB Analytics LLC, Crowcon Detection Instruments Ltd., Drägerwerk AG & Co. KGaA, Gao Tek, Gasera Ltd., GFG Instrumentation, Inc., Honeywell International Inc., International Gas Detectors, MSA Safety Incorporated, New Cosmos Electric Co., Ltd., R.C. Systems, RKI Instruments, Sensidyne, LP, and Teledyne Technologies Incorporated.
Hydrogen Fluoride Gas Detection Market Report Scope
| Report Attributes | Details |
| Market size value in 2021 | USD 546.3 Million |
| Revenue forecast in 2030 | USD 880.0 Million |
| CAGR | 5.6% from 2022 - 2030 |
| Base year | 2021 |
| Historical data | 2018 - 2020 |
| Forecast period | 2022 - 2030 |
| Quantitative units | Revenue in USD Million and CAGR from 2022 to 2030 |
| Segments covered | By Type, By Form, By End-Use, By Region |
| Regional scope | North America, Europe, Asia Pacific, Latin America, Middle East & Africa |
| Key companies | Analytical Technology, Inc., ATB Analytics LLC, Crowcon Detection Instruments Ltd., Drägerwerk AG & Co. KGaA, Gao Tek, Gasera Ltd., GFG Instrumentation, Inc., Honeywell International Inc., International Gas Detectors, MSA Safety Incorporated, New Cosmos Electric Co., Ltd., R.C. Systems, RKI Instruments, Sensidyne, LP, and Teledyne Technologies Incorporated |
Research Methodology
A robust system of research, verification, and forecasting designed to ensure reliable and actionable market insights.
Polaris Market Research & Consulting, Inc. uses a clear and structured approach to deliver insights that clients can rely on. The process combines detailed primary and secondary research, including direct communication with industry experts. The detailed information helps build a complete picture of market trends and developments. Secondary data is gathered from credible sources such as industry reports, company filings, government source links, and trusted organization databases. It is then cross-checked through discussions with key stakeholders across the value chain. Market size and forecasts are developed using both bottom-up and top-down methods to ensure accuracy and consistency in the final results.
1. Project Setup
Step 1 & 2:
- We start every project by clearly understanding the client’s objective or goal, then defining the market scope, and aligning regions, segments, and timelines.
- Once the foundation is set, we collect data from all-around of sources, including company reports, government databases, and paid industry platforms.
- Our research is based on secondary data, which helps us build a strong understanding of the market across regions and industries. Then we validate this information through primary research by speaking directly with industry experts, companies, and stakeholders.
- By combining secondary and primary research, we ensure that our market insights are accurate, practical, and closely aligned with real market conditions.
2. Data Collection
We gather information from both public and verified sources:
3. Data Structuring
Step 3:
- All collected data is organized into a consistent format to ensure accurate analysis. Since inputs come from multiple sources, they are standardized and aligned before use.
- The data is segmented by product, application, and region, and mapped across a defined historical period (2020–2024). All values are converted into common units (USD Mn/Bn), and volume and pricing are aligned where required to estimate revenue.
- Any overlaps or inconsistencies are reviewed and adjusted to maintain accuracy (<5% variance threshold).
- The result is a structured dataset that allows for clear comparison across regions and supports reliable analysis and forecasting.
Structured Market Dataset, USD Mn/Bn
| Region | Segment | VolumeUnits | Avg PriceUSD | RevenueUSD Mn | Share % |
|---|---|---|---|---|---|
| North America | Product A | 250 | 2.5 | 500 | 15% |
| Product A | XX | XX | XX | XX | |
| Product A | XX | XX | XX | XX | |
| Consistent methodology applied across regions | |||||
4. Market Estimation
Step 4: TOP-DOWN APPROACH
- We start with the overall market size at a global or macro level.
- The market is then narrowed down based on scope and industry relevance.
- We apply penetration rates and split the data by region and segment.
- This helps us estimate the market size for specific segments.
- The numbers are validated through cross-checks to ensure accuracy.
Step 5: BOTTOM-UP APPROACH
- We begin by analyzing data from leading companies in the market.
- Revenue data is collected and mapped across different segments.
- The data is then aggregated to estimate the total market size.
- To fill in any gaps, adjustments are made based on industry standards.
- Validation checks make sure that the results are correct.
5. Forecasting
Step 6:
At Polaris Market Research & Consulting, Inc., we employ a methodical forecasting strategy. This approach blends the analysis of historical data with real-time market validation. To forecast future trends with precision, we examine past patterns, pricing fluctuations, and the interplay of supply and demand. To ensure our conclusions reflect the present market landscape, we actively seek input from industry experts and key stakeholders.
To refine our predictions, we carefully consider critical elements such as market drivers and restraints, fluctuations in raw material costs, emerging technologies, and the production capabilities of various regions. Furthermore, we assess regulatory frameworks and potential policy shifts to gauge their potential impact on market expansion.
All this information is synthesized to generate precise forecasts for each segment and region. These forecasts illuminate the current state of the market and highlight forthcoming opportunities.
6. Validation & Triangulation
Step 7:
In the final stage, we validate all our estimates using a triangulation method, where data is cross-checked from multiple reliable sources, like company data, primary interviews, and secondary research. This helps us make sure that our numbers are correct and fit with the rest of the market.
This process involves verifying data consistency across various segments and geographic areas. It also requires comparing historical trends with the assumptions support the forecast. Any discrepancies involve adjustments to ensure everything remains aligned and dependable.
Once the data is finalized, we prepare the final outputs, including market size estimates, segment-wise breakdowns, and growth metrics. These are delivered in structured formats such as tables, charts, and data files for easy analysis and use.
We collaborate closely with clients, ensuring the final products align with their requirements. This includes offering tailored adjustments, supplementary data analyses, and continuous assistance. Furthermore, we monitor market trends post-delivery, providing updates and refinements to maintain the insights' relevance as time passes.
Triangulation Framework
Estimates are cross-verified across three sources:
Company-level data
• Primary inputs from industry participants
• Secondary benchmarks and published data
Variance maintained within +5-10%
Adjustments applied to align estimates
Segment values validated against overall market structure
Data Consistency & Integrity
Segment totals validated to 100%
Regional estimates aligned with global market size
Historical trends compared against forecast outputs
Assumptions reviewed for cross-segment and regional alignment
Final Outputs
Deliverables
Client Alignment & Support
- Deliverables are aligned with defined client requirements and scope
- Custom data cuts and segment splits are incorporated as required
- Post-delivery queries are addressed through analyst interactions
- Additional clarifications and data support are provided upon request
Client Continuity & Updates
- Market developments are tracked post-delivery to capture changes in key trends
- Updated data and revisions are provided based on new market inputs
- Additional refinements and data cuts are shared as required
- Continued analyst engagement supports evolving client requirements
Download Sample Report of Hydrogen Fluoride Gas Detection Market
Please fill out the form to request a customized copy of the research report.
