Anisole Market Share, Size, Trends, Industry Analysis Report, 2022 - 2030

Anisole Market Share, Size, Trends, Industry Analysis Report, 2022 - 2030

REPORT DETAILS

Report Code: PM1207
No. of Pages: 118
Format: PDF
Published Date:
Base Year: 2021
Author: Praj Bhilare
Historical Data: 2018-2020

REPORT DETAILS

Report Code: PM1207
Published Date:
No. of Pages: 118
Historical Data: 2018-2020
Format: PDF
Author: Praj Bhilare
Base Year: 2021
Anisole Market Share, Size, Trends, Industry Analysis Report, By Purity (Up To 99.5%, Above 99.5%); By Application (Pharmaceuticals, Cosmetics, Food & Beverages, Perfumes, Pesticides and Insecticides, Others), By Region; Segment Forecast, 2022 - 2030

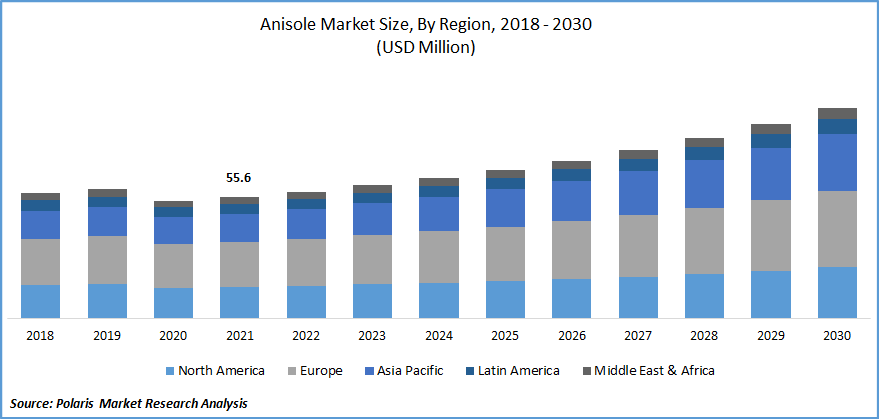
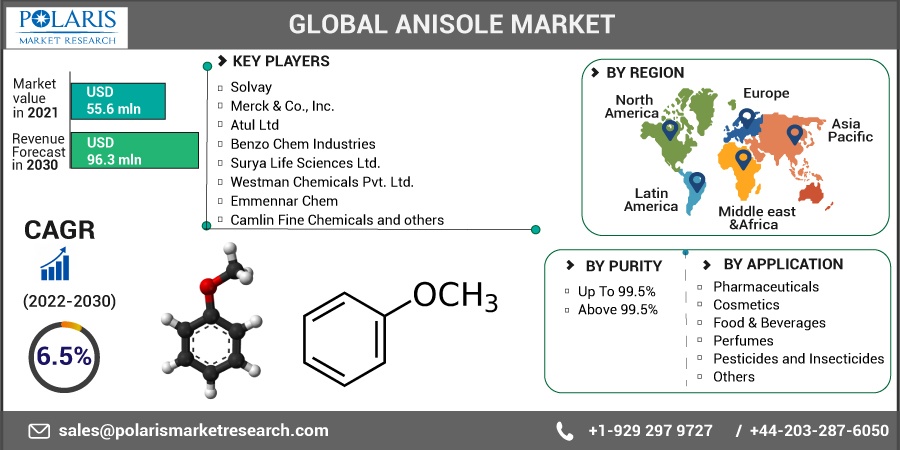
The global anisole market was valued at USD 55.6 million in 2021 and is expected to grow at a CAGR of 6.5% during the forecast period. The use of anisole in a variety of end-use industries has increased demand for the chemical. A major driver of the global anisole market is the use of anisole in the production of perfumes and cosmetics.

Anisole Market Size
Know more about this report: Download Sample Report

The global fragrance market is projected to be valued at around USD 52.4 billion by 2025. Moreover, the high proclivity of the general public for personal grooming, health, and self-care goods has increased the demand for anisole. An isoline is also an effective insect pheromone. All these factors are expected to have a positive impact on the revenue growth of the target anisole market.

The breakout of COVID-19 has had a significant impact on the chemical industry's manufacturing operations and global supply chain. Even after the lockdown is removed, most likely in stages, the manufacturers of anisole will continue to face long-term challenges due to workforce shortages and stifled logistics.

But during the pandemic, sales of pharmaceutical products surged. Hence the demand for anisole increased in this sector as it uses as an intermediate in the manufacturing of several medicines. Also, the sales of cosmetic products through e-commerce platforms have increased at a rapid pace after the spread of COVID 19.

Anisole Market
Know more about this report: Download Sample Report

Industry Dynamics

Growth Drivers
The chemical sector is an important part of the economy. Hence governments of developing countries have started taking various initiatives to strengthen this sector. Governments are changing old tax policies and launching new schemes to strengthen the chemical sector. Since 2019, the Indian government has allowed 100% FDI in the chemical industry. This factor is anticipated to augment the revenue growth of the global anisole market during the forecast period.

Increasing disposable income and rapid population growth have resulted in increased demand for cosmetics, pharmaceuticals, beverages, etc., all over the world. An increase in disposable income is allowing people to be more focused on personal care. According to United Nations, the global population is estimated to reach 9.7 Bn by 2020.

In 2016, Americans had approx. 13.6 trillion dollars in disposable income, which increased up to approximately 14.9 trillion dollars in 2019. This is the major factor that is driving the growth of the target market. According to the EIPA (Euromonitor International Personal Appearance Survey), the variety of socially acceptable beauty and personal care (BPC) products for men has widened in the last ten years.

One-third of men spend well over 30 minutes per day grooming, presenting a wide range of potential for BPC makers to offer solutions that cater to the specific demands of men who are concerned about their appearance. Over the projection period, such factors are anticipated to boost the anisole market for cosmetics and personal care products. And this factor, in turn, will boost demand for anisole.

Anisole is used as an intermediary in the production of many derivatives, such as 4-allyl anisole, which is a key element in pesticides used to protect conifers in parks, forests, and leisure areas from insects like bark beetles. As per Eurostat data, the EU-28 had a total land area grown as organic in 2015 of 11.1 million hectares, up from 5 million hectares in 2002. During the last decade, the EU's organic land area grew at an annual rate of roughly 500,000 hectares each year. This trend is anticipated to have a positive impact on the growth of the target market.

Report Segmentation

The market is primarily segmented based on purity, application and region.

By Purity

By Application

By Region

  • Up To 99.5%
  • Above 99.5%
  • Pharmaceuticals
  • Cosmetics
  • Food & Beverages
  • Perfumes
  • Pesticides and Insecticides
  • Others
  • North America (U.S., Canada)
  • Europe (France, Germany, UK, Italy, Netherlands, Spain, Russia)
  • Asia Pacific (Japan, China, India, Malaysia, Indonesia. South Korea)
  • Latin America (Brazil, Mexico, Argentina)
  • Middle East & Africa (Saudi Arabia, UAE, Israel, South Africa)

Know more about this report: Download Sample Report

Up to 99.5% purity segment is expected to witness fastest market growth

Low purity (Up to 99.5%) anisole has a vast number of applications. It can be used in various consumer products. As the average disposable income rises, the demand for several consumer products is rising. Also, low purity anisole has high demand from end-use industries such as cosmetics, food & beverages, pharmaceuticals, etc.

Europe's 500 million customers utilize cosmetic and personal care goods on a daily basis to safeguard their health, improve their well-being, and increase their self-esteem. Cosmetics, which include antiperspirants, scents, make-up, and shampoos, as well as soaps and toothpaste, are needed in all phases of life and provide significant practical and emotional benefits.

The above 99.5% segment is anticipated to grow at a high CAGR during the forecast period. Highly pure anisole is not used in many consumer products. It is used in research laboratories for research purposes. Research and development activities are at a peak in the pharmaceutical sector. Anisole is used as an important intermediate during the development phase of new medicines. These factors are anticipated to drive the CAGR growth of this particular segment.

Pharmaceutical accounted for the largest market share in 2021

In recent years, the global pharmaceutical market has seen a tremendous increase. The overall worldwide pharmaceutical market was estimated to be worth around 1.27 trillion dollars by 2020. This represents a considerable gain from 2001 when the market was only worth USD 390 billion. Also, after the outbreak of COVID, governments of several countries are strengthening the healthcare sector as pharmaceutical companies are an important part of the healthcare system, and governments are providing various subsidies and funding to the companies.

The cosmetic segment is anticipated to grow at a high CAGR in the years to come. Consumers from developing countries are becoming more aware of the usage of various cosmetic products. Hence, the demand for cosmetic products is rising at a rapid rate in these regions.

The annual growth rate of the world was 8% in the year 2021, which was the highest ever since the year 2004. The demand surge and higher growth are ensuring the high use of anisole in various cosmetic products, and these factors are anticipated to have a positive impact on the growth of the target segment.

Asia-Pacific is estimated to capture the highest revenue share

Rapid population growth and a rise in the adoption of western beauty and skincare habits are driving the demand for several cosmetic products in this region. China, with a population of 1.3 billion people and over half a billion urban residents, would have the most potential cosmetic buyers in the globe, followed by India.

Due to the growth of the cosmetic and pharmaceutical industries, the demand for anisole is rising at a rapid rate from the companies present in this region. All these factors are anticipated to have a favorable impact on the growth of the target market.

Over the forecast period, the North American market is expected to grow at a high CAGR. Most of the consumers present in this region spend a large number on cosmetics and pharmaceutical products. In terms of value, the United States was the world's biggest consumer of beauty products in 2018.

In that year, the value of beauty products consumed in the United States was estimated to be around 89.71 billion dollars. Moreover, due to the presence of big end-user companies from cosmetics, pharmaceutical, food and beverage, chemical, etc., this region is expected to grow at a rapid pace.

Competitive Insight

Major players operating in the global market include Atul Ltd, Benzo Chem, Camlin Fine, Clean Science, Emmennar Chem, Evonik Industries, Kessler Chemical, Merck, Shaanxi Top Chemical, Solvay, Surya Life Sciences, Triveni Chemicals, Westman Chemicals, Yasho Industries, and others.

Recent Developments

In July 2021, Clean Science and Technology raised more than Rs 430 crores from 40 different investors. Performance chemicals (MEHQ, BHA, and AP), pharmaceutical intermediates, Anisole and other chemicals are manufactured by the Clean Science. Customers use the company's goods as critical starting level components, inhibitors, or additives in products marketed in regulated markets.

Anisole Market Report Scope

Report Attributes

Details

Market size value in 2021

USD 55.6 million

Revenue forecast in 2030

USD 96.3 million

CAGR

6.5% from 2022 - 2030

Base year

2021

Historical data

2018 - 2020

Forecast period

2022 - 2030

Quantitative units

Revenue in USD million/billion and CAGR from 2022 to 2030

Segments covered

By Purity, By Application, By Region

Regional scope

North America, Europe, Asia Pacific, Latin America; Middle East & Africa

Key companies

Solvay, Merck & Co., Inc., Atul Ltd, Benzo Chem Industries, Surya Life Sciences Ltd., Westman Chemicals Pvt. Ltd., Emmennar Chem, Camlin Fine Chemicals, Evonik Industries AG., Kessler Chemical, Inc., Shaanxi Top Chemical Co., Ltd., Yasho Industries Pvt., and Ltd. Clean Science & Technology, Triveni Chemicals

Page last updated on: Jun-2026

Research Methodology

A robust system of research, verification, and forecasting designed to ensure reliable and actionable market insights.

Polaris Market Research & Consulting, Inc. uses a clear and structured approach to deliver insights that clients can rely on. The process combines detailed primary and secondary research, including direct communication with industry experts. The detailed information helps build a complete picture of market trends and developments. Secondary data is gathered from credible sources such as industry reports, company filings, government source links, and trusted organization databases. It is then cross-checked through discussions with key stakeholders across the value chain. Market size and forecasts are developed using both bottom-up and top-down methods to ensure accuracy and consistency in the final results.

Data
Collection Project
Setup Market
Estimation Data
Structuring Quality
Check Output Forecasting Data
Validation Our Methodological
Approach Source: Polaris Market Research

1. Project Setup

Step 1 & 2:

  • We start every project by clearly understanding the client’s objective or goal, then defining the market scope, and aligning regions, segments, and timelines.
  • Once the foundation is set, we collect data from all-around of sources, including company reports, government databases, and paid industry platforms.
  • Our research is based on secondary data, which helps us build a strong understanding of the market across regions and industries. Then we validate this information through primary research by speaking directly with industry experts, companies, and stakeholders.
  • By combining secondary and primary research, we ensure that our market insights are accurate, practical, and closely aligned with real market conditions.

2. Data Collection

We gather information from both public and verified sources:

Secondary Research 50-100+ sources reviewed Company filings (10-K, annual reports) Government databases (trade, production, import/export) Paid databases (Bloomberg, Factiva, Statista) Coverage:
60-80% of total data inputs Primary Research 25-40 interviews conducted Manufacturers Distributors / channel partners Industry experts / consultants Coverage:
30-40% validation weight Source: Polaris Market Research

3. Data Structuring

Step 3:

  • All collected data is organized into a consistent format to ensure accurate analysis. Since inputs come from multiple sources, they are standardized and aligned before use.
  • The data is segmented by product, application, and region, and mapped across a defined historical period (2020–2024). All values are converted into common units (USD Mn/Bn), and volume and pricing are aligned where required to estimate revenue.
  • Any overlaps or inconsistencies are reviewed and adjusted to maintain accuracy (<5% variance threshold).
  • The result is a structured dataset that allows for clear comparison across regions and supports reliable analysis and forecasting.

Structured Market Dataset, USD Mn/Bn

Region Segment VolumeUnits Avg PriceUSD RevenueUSD Mn Share %
North America Product A 250 2.5 500 15%
Product AXXXXXXXX
Product AXXXXXXXX

4. Market Estimation

Step 4: TOP-DOWN APPROACH

  • We start with the overall market size at a global or macro level.
  • The market is then narrowed down based on scope and industry relevance.
  • We apply penetration rates and split the data by region and segment.
  • This helps us estimate the market size for specific segments.
  • The numbers are validated through cross-checks to ensure accuracy.
Top-down Approach Macro market base Value / Volume Parent market USD-based Volume-based Units X price Market scope alignment Penetration rate 5-50% Segment & regional split Geographic breakdown Estimated market size Market size reconciliation ±5-10% variance check Final market size USD Mn / Bn Market forecasting Source: Polaris Market Research

Step 5: BOTTOM-UP APPROACH

  • We begin by analyzing data from leading companies in the market.
  • Revenue data is collected and mapped across different segments.
  • The data is then aggregated to estimate the total market size.
  • To fill in any gaps, adjustments are made based on industry standards.
  • Validation checks make sure that the results are correct.
Bottom-up Approach Company-level data 20-25 comapnies Parent market Financials Segmental analysis Segment-level aggregation 60-80% coverage Gap adjustment Benchmarks Estimated market size Market size reconciliation ±5-10% variance check Final market size USD Mn / Bn Market forecasting Source: Polaris Market Research

5. Forecasting

Step 6:

At Polaris Market Research & Consulting, Inc., we employ a methodical forecasting strategy. This approach blends the analysis of historical data with real-time market validation. To forecast future trends with precision, we examine past patterns, pricing fluctuations, and the interplay of supply and demand. To ensure our conclusions reflect the present market landscape, we actively seek input from industry experts and key stakeholders.

To refine our predictions, we carefully consider critical elements such as market drivers and restraints, fluctuations in raw material costs, emerging technologies, and the production capabilities of various regions. Furthermore, we assess regulatory frameworks and potential policy shifts to gauge their potential impact on market expansion.

All this information is synthesized to generate precise forecasts for each segment and region. These forecasts illuminate the current state of the market and highlight forthcoming opportunities.

Data - Based Assessment Growth rates are derived from multi-year performance  Pricing movement is evaluated to align value projections  Volume and value relationships are assessed across segments Historical market data is analyzed to establish baseline trends  Market - Validated Assessment Supply-side insights are incorporated to account for production and capacity trends Forecast assumptions are aligned with current market conditions Industry inputs are used to validate growth assumptions Inputs from demand-side participants are considered to reflect consumption patterns  Source: Polaris Market Research

6. Validation & Triangulation

Step 7:

In the final stage, we validate all our estimates using a triangulation method, where data is cross-checked from multiple reliable sources, like company data, primary interviews, and secondary research. This helps us make sure that our numbers are correct and fit with the rest of the market.

This process involves verifying data consistency across various segments and geographic areas. It also requires comparing historical trends with the assumptions support the forecast. Any discrepancies involve adjustments to ensure everything remains aligned and dependable.

Once the data is finalized, we prepare the final outputs, including market size estimates, segment-wise breakdowns, and growth metrics. These are delivered in structured formats such as tables, charts, and data files for easy analysis and use.

We collaborate closely with clients, ensuring the final products align with their requirements. This includes offering tailored adjustments, supplementary data analyses, and continuous assistance. Furthermore, we monitor market trends post-delivery, providing updates and refinements to maintain the insights' relevance as time passes.

Validation

Triangulation Framework

Estimates are cross-verified across three sources:

Company-level data

• Primary inputs from industry participants

• Secondary benchmarks and published data

Variance maintained within +5-10%

Adjustments applied to align estimates

Segment values validated against overall market structure

Quality Check

Data Consistency & Integrity

Segment totals validated to 100%

Regional estimates aligned with global market size

Historical trends compared against forecast outputs

Assumptions reviewed for cross-segment and regional alignment

Output & Delivery

Final Outputs

Market size estimates (USD Mn/Bn)
Segment-wise distribution (%)
Growth metrics (CAGR %)

Deliverables

Structured tables and charts
Segment-level datasets
Excel-based data files for further analysis

Client Alignment & Support

  • Deliverables are aligned with defined client requirements and scope
  • Custom data cuts and segment splits are incorporated as required
  • Post-delivery queries are addressed through analyst interactions
  • Additional clarifications and data support are provided upon request

Client Continuity & Updates

  • Market developments are tracked post-delivery to capture changes in key trends
  • Updated data and revisions are provided based on new market inputs
  • Additional refinements and data cuts are shared as required
  • Continued analyst engagement supports evolving client requirements

Secure Your Competitive Edge With Our Expert-Driven Market Insights

Gain exclusive insights and strengthen your competitive position with our tailored research solutions. Connect with our research analysts and industry experts to elevate your decision-making.

Talk To Our Analyst
Download Sample