
Beet Pulp Pellet Market Share, Size, Trends, Industry Analysis Report, 2022 - 2030
REPORT DETAILS
REPORT DETAILS
ABOUT THIS REPORT
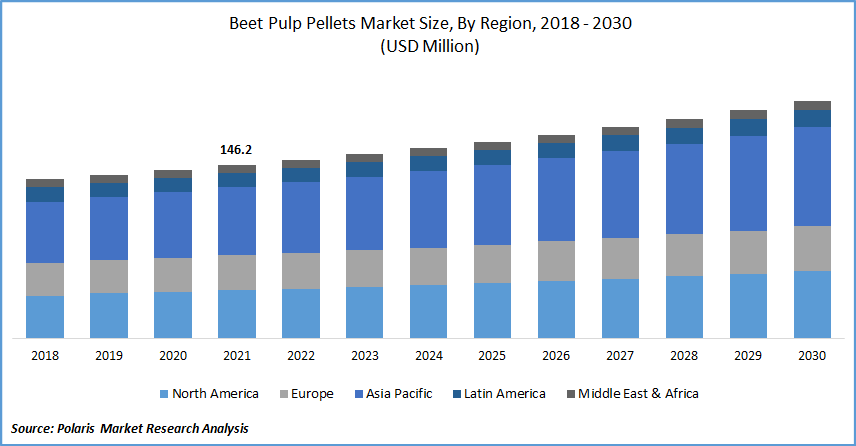
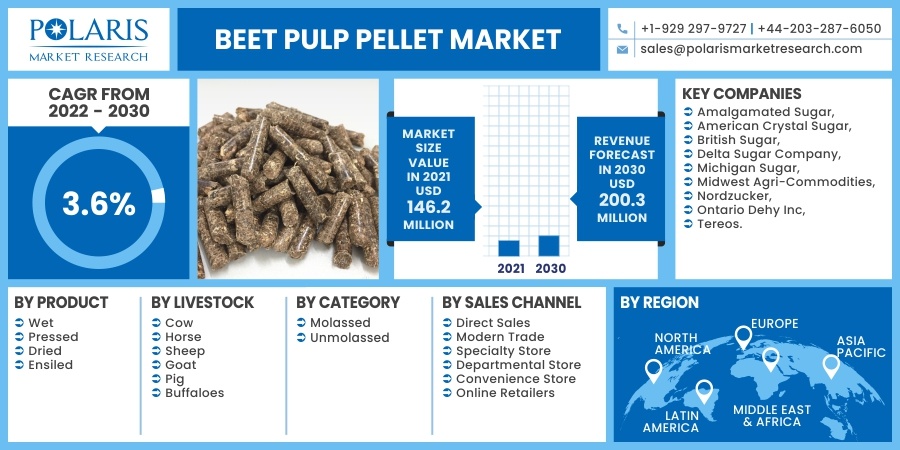
The global beet pulp pellet market was valued at USD 146.2 million in 2021 and is expected to grow at a CAGR of 3.6% during the forecast period. The global demand for the market is fueled by the rising demand for plant-based goods and the rising popularity of specific diet demands.
 Know more about this report: Download Sample Report
Beet product demand increases, and industry players are likely to take advantage of the growing organized retail sector to reach a bigger audience. Companies are focusing on large-scale manufacturing and beet pulp to meet the growing demand for nutritional animal feed. Along with this, the demand for improved nutrition in animal feed will become a major development driver. It is a popular energetic feedstuff used for horses in many countries to meet their advanced nutritional needs, which accounts for a large portion of demand in the industry.
Pectin is another commodity derived from a product with a lot of economic interest. For the past few years, the usage of pectin as a popular food stabilizer has greatly broadened the application route. The roughage value of this pellet is appealing because it provides calcium, phosphate, and protein. Sugar is produced in large quantities as a commodity in numerous nations throughout the world, which helps to drive up demand for the industry. The growing commercial importance of this pellet as a fiber source for animal feeding strengthens the industry's prospects.
Know more about this report: Download Sample Report
Industry Dynamics
Growth Drivers
The market is most extensively employed in animal husbandry, where these pellets are commonly used to feed horses and other livestock. These pellets are high in protein and vitamins, making them an excellent source of nutrition. They are used in a variety of ways, including directly and as part of other dishes. Horse and livestock owners opt to feed these pellets to their animals on a regular basis to ensure that they receive appropriate nutrition. It contains calcium in very high quantities, which is good for the animals' bones. Because of their nutritional benefits, the demand for such pellets among animal owners continuously increases.
Equine nutrition refers to how animals are fed. The proper and balanced feeding of horses is an important part of effective horse care. This results in gaining popularity among horse owners. The surging demand for the beet pulp pellet market for animal feed worldwide is fueling the industry’s growth.
For instance, as per World Integrated trade Solutions, the Russian Federation has exported 1,279,020,000 Kg of beet-pulp, bagasse, and other residues have risen to 1,347,110,000 Kg, in 2019. This significant growth in production and export quantity of these pellets has augmented the industry growth.
Report Segmentation
The market is primarily segmented based on product, livestock, category, sales channel, and region.
| By Product | By Livestock | By Category | By Sales Channel | By Region |
|
|
|
|
|
Know more about this report: Download Sample Report
Insight by Product
The dried beet sector is expected to dominate the global beet pulp pellet market. The chemical analysis and nutrient composition of dried pulp reveal that it contains sucrose, calcium, magnesium, phosphorus, natural protein, and a variety of other nutrients, all of which contribute to the health advantages. Furthermore, dry sugar beet pulp can be held in flat storage for longer, allowing clients to feed their stores without hassle. Customers have increased their demand for dried beet pulp for livestock feeding due to this.
Insight by Livestock
Cows will continue to consume the majority of beet pulp, resulting in a significant increase in market revenue. These can be fed to pregnant or lactating cows as a supplement, backgrounding element, or roughage replacement in finishing diets. Furthermore, beet pulp includes a high amount of digestible fiber, and it does not cause acidosis in cows that consume it. Beet pulp has a modest crude protein content of about 8%-10% but a high TDN content of 72%-75%.
Geographic Overview
North America has the largest global beet pulp pellet market share due to the high consumption and production in the region. However, if the pandemic continues unabated, beet pulp pellet sales may suffer in the coming years as a result of economic uncertainty and a lack of product availability. The establishment of new policies for manufacturers and workers and improvements in healthcare facilities will contribute to effective operations.
This could lead to rapid growth in the beet pulp market in the U.S. Veganism is gaining acceptance in the United States, which will continue to boost the market's overall growth. Due to the increased acceptance of such pellets for various applications in this area, such as animal feed, equestrian feed, and others.
Asia Pacific is projected to be the fastest-growing region in the market. The Asia Pacific region dominates the pulp pellets market. Due to the high consumption of dynamic swine feed and dairy feed industries in emerging economies such as India and China, the global market is expected to rise at a high rate. The cattle feed industry is expanding rapidly as milk producers begin to replace traditional cattle feed with more nutritionally balanced compound feed, realizing the actual benefits of nutritional feed in terms of increased yield.
The livestock business is the most important aspect of agricultural development in Asia, and it has grown at an unparalleled rate in recent decades. Because of population growth and rising living standards, the livestock business has been obliged to adapt and expand in order to meet society's expectations by giving healthy animal feed to livestock animals. Further, these pellets have become the most significant components in these countries due to their nutritional value, which includes being high in protein, fiber, and vitamins.
Competitive Insight
Some of the major players operating in the global market include Amalgamated Sugar, American Crystal Sugar, British Sugar, Delta Sugar Company, Michigan Sugar, Midwest Agri-Commodities, Nordzucker, Ontario Dehy Inc, and Tereos.
Beet Pulp Pellet Market Report Scope
| Report Attributes | Details |
| Market size value in 2021 | USD 146.2 million |
| Revenue forecast in 2030 | USD 200.3 million |
| CAGR | 3.6% from 2022 - 2030 |
| Base year | 2021 |
| Historical data | 2018 - 2020 |
| Forecast period | 2022 - 2030 |
| Quantitative units | Revenue in USD million and CAGR from 2022 to 2030 |
| Segments covered | By Product, By Livestock, By Category, By Sales Channel, By Region |
| Regional scope | North America, Europe, Asia Pacific, Latin America, Middle East & Africa |
| Key companies | Amalgamated Sugar, American Crystal Sugar, British Sugar, Delta Sugar Company, Michigan Sugar, Midwest Agri-Commodities, Nordzucker, Ontario Dehy Inc, and Tereos. |
Research Methodology
A robust system of research, verification, and forecasting designed to ensure reliable and actionable market insights.
Polaris Market Research & Consulting, Inc. uses a clear and structured approach to deliver insights that clients can rely on. The process combines detailed primary and secondary research, including direct communication with industry experts. The detailed information helps build a complete picture of market trends and developments. Secondary data is gathered from credible sources such as industry reports, company filings, government source links, and trusted organization databases. It is then cross-checked through discussions with key stakeholders across the value chain. Market size and forecasts are developed using both bottom-up and top-down methods to ensure accuracy and consistency in the final results.
1. Project Setup
Step 1 & 2:
- We start every project by clearly understanding the client’s objective or goal, then defining the market scope, and aligning regions, segments, and timelines.
- Once the foundation is set, we collect data from all-around of sources, including company reports, government databases, and paid industry platforms.
- Our research is based on secondary data, which helps us build a strong understanding of the market across regions and industries. Then we validate this information through primary research by speaking directly with industry experts, companies, and stakeholders.
- By combining secondary and primary research, we ensure that our market insights are accurate, practical, and closely aligned with real market conditions.
2. Data Collection
We gather information from both public and verified sources:
3. Data Structuring
Step 3:
- All collected data is organized into a consistent format to ensure accurate analysis. Since inputs come from multiple sources, they are standardized and aligned before use.
- The data is segmented by product, application, and region, and mapped across a defined historical period (2020–2024). All values are converted into common units (USD Mn/Bn), and volume and pricing are aligned where required to estimate revenue.
- Any overlaps or inconsistencies are reviewed and adjusted to maintain accuracy (<5% variance threshold).
- The result is a structured dataset that allows for clear comparison across regions and supports reliable analysis and forecasting.
Structured Market Dataset, USD Mn/Bn
| Region | Segment | VolumeUnits | Avg PriceUSD | RevenueUSD Mn | Share % |
|---|---|---|---|---|---|
| North America | Product A | 250 | 2.5 | 500 | 15% |
| Product A | XX | XX | XX | XX | |
| Product A | XX | XX | XX | XX | |
| Consistent methodology applied across regions | |||||
4. Market Estimation
Step 4: TOP-DOWN APPROACH
- We start with the overall market size at a global or macro level.
- The market is then narrowed down based on scope and industry relevance.
- We apply penetration rates and split the data by region and segment.
- This helps us estimate the market size for specific segments.
- The numbers are validated through cross-checks to ensure accuracy.
Step 5: BOTTOM-UP APPROACH
- We begin by analyzing data from leading companies in the market.
- Revenue data is collected and mapped across different segments.
- The data is then aggregated to estimate the total market size.
- To fill in any gaps, adjustments are made based on industry standards.
- Validation checks make sure that the results are correct.
5. Forecasting
Step 6:
At Polaris Market Research & Consulting, Inc., we employ a methodical forecasting strategy. This approach blends the analysis of historical data with real-time market validation. To forecast future trends with precision, we examine past patterns, pricing fluctuations, and the interplay of supply and demand. To ensure our conclusions reflect the present market landscape, we actively seek input from industry experts and key stakeholders.
To refine our predictions, we carefully consider critical elements such as market drivers and restraints, fluctuations in raw material costs, emerging technologies, and the production capabilities of various regions. Furthermore, we assess regulatory frameworks and potential policy shifts to gauge their potential impact on market expansion.
All this information is synthesized to generate precise forecasts for each segment and region. These forecasts illuminate the current state of the market and highlight forthcoming opportunities.
6. Validation & Triangulation
Step 7:
In the final stage, we validate all our estimates using a triangulation method, where data is cross-checked from multiple reliable sources, like company data, primary interviews, and secondary research. This helps us make sure that our numbers are correct and fit with the rest of the market.
This process involves verifying data consistency across various segments and geographic areas. It also requires comparing historical trends with the assumptions support the forecast. Any discrepancies involve adjustments to ensure everything remains aligned and dependable.
Once the data is finalized, we prepare the final outputs, including market size estimates, segment-wise breakdowns, and growth metrics. These are delivered in structured formats such as tables, charts, and data files for easy analysis and use.
We collaborate closely with clients, ensuring the final products align with their requirements. This includes offering tailored adjustments, supplementary data analyses, and continuous assistance. Furthermore, we monitor market trends post-delivery, providing updates and refinements to maintain the insights' relevance as time passes.
Triangulation Framework
Estimates are cross-verified across three sources:
Company-level data
• Primary inputs from industry participants
• Secondary benchmarks and published data
Variance maintained within +5-10%
Adjustments applied to align estimates
Segment values validated against overall market structure
Data Consistency & Integrity
Segment totals validated to 100%
Regional estimates aligned with global market size
Historical trends compared against forecast outputs
Assumptions reviewed for cross-segment and regional alignment
Final Outputs
Deliverables
Client Alignment & Support
- Deliverables are aligned with defined client requirements and scope
- Custom data cuts and segment splits are incorporated as required
- Post-delivery queries are addressed through analyst interactions
- Additional clarifications and data support are provided upon request
Client Continuity & Updates
- Market developments are tracked post-delivery to capture changes in key trends
- Updated data and revisions are provided based on new market inputs
- Additional refinements and data cuts are shared as required
- Continued analyst engagement supports evolving client requirements
Download Sample Report of Beet Pulp Pellet Market
Please fill out the form to request a customized copy of the research report.
