
Cosmetic Preservatives Market Share, Size, Trends, Industry Analysis Report, 2022 - 2030
REPORT DETAILS
REPORT DETAILS
ABOUT THIS REPORT
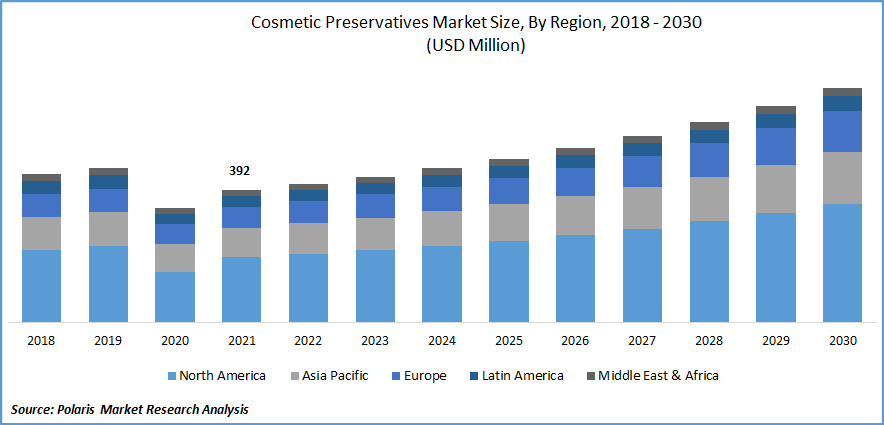
The global cosmetic preservatives market was valued at USD 392 million in 2021 and is expected to grow at a CAGR of 6.77% during the forecast period.
The changing consumer lifestyle, rising consciousness towards personal hygiene, and wide acceptance of these products across the globe are driving the market growth. In addition, the rising number of concerns associated with synthetic chemicals by their excess use due to their carcinogenic nature has resulted in high adoption of natural & organic product alternatives, which is further anticipated to fuel the demand and growth for the global market at a significant growth rate over the coming years.
Know more about this report: Download Sample Report
Moreover, the continuously rising demand for various skin care products, including body lotions, sunscreens, and natural body moisturizers, due to the increasing consumer demand and preference to achieve youthful and glowing skin is fueling the global demand for these products in the coming years.
Additionally, an extensive rise in research & development activities coupled with the increasing numbers of product launches to cater to the rising consumer need for advanced and innovative products. For instance, in March 2022, Sharon Labs agreed to acquire RES Pharma Industrial, a prominent chemical manufacturer in Italy. With the help of this acquisition, Sharon Labs will expand its service capabilities and commercial development and enhance production in the company’s personal care division.
The outbreak of the COVID-19 pandemic has completely disrupted the supply chain of cosmetic preservatives in the global cosmetic industry. Over 100 countries around the globe shut their country boundaries for all types of internal and external trade. Major countries such as the US, Italy, Japan, Germany, and France, the leading producers and suppliers of cosmetic preservatives, were almost at a standstill.
Due to the high restrictions on transportation and trade, large companies have been affected significantly since they were unable to deliver products to their clients and dropped down the global demand and purchasing of cosmetics products.
 Know more about this report: Download Sample Report
Industry Dynamics
Growth Drivers
A rise in consumer purchasing power coupled with a high standard of living of consumers worldwide and a rising preference for high-quality premium cosmetic products are the key factors anticipated to drive the growth of the global market over the forecast period. In addition, the high rate of industrialization and technological advancements, especially in developing nations such as India, China, and Brazil, have paved the way for accessing global brands with ease and at fingertips, fueling the growth of the market over the coming years. According to our findings, the personal disposable income in the United States has increased from USD 18600.71 billion in July 2022 to USD 18668.33 billion in August 2022.
Furthermore, changing consumer lifestyles, growing awareness regarding individual cleanliness, and increased research & development activities on the manufacturing process of preservatives are also estimated to propel the growth of the global market during the forecast period. High usage of Isothiazolinone in shampoos & conditioners and other rinse-off products is likely to contribute significantly to the demand for consumer preservatives.
Report Segmentation
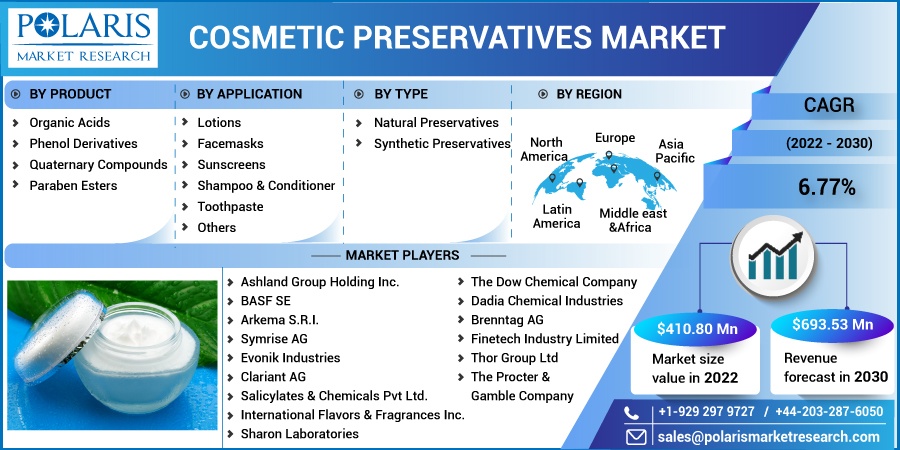
The market is primarily segmented based on product, application, type, and region.
| By Product | By Application | By Type | By Region |
|
|
|
|
Know more about this report: Download Sample Report
Phenol derivatives segment is expected to witness fastest growth
The phenol derivatives segment is witnessing fastest growth rate over the forecast period. The growth of the segment is highly attributed to the rising use of phenol derivatives and mainly phenoxyethanol, in the production process of several types of cosmetics, including skin lightening creams, lotions, various hair coloring solutions, and sunscreens. All these factors are likely to create a paved way for the growth of the segment at a strong growth rate over the coming years.
Furthermore, growing technological advancements and increased product innovations coupled with high adoption in emerging economies such as China, India, Brazil, and Indonesia were also propelling the growth of the segment market and are expected to do so in the near future.
Shampoo & Conditioner accounted for the largest market share in 2021
The shampoo & conditioner segment held the largest market share in 2021 in value and volume. Global manufacturers of these products are highly utilizing preservatives to increase the shelf life and quality of their products, which is likely to be the major driving factor for the growth of the segment in the coming years. In addition, change in consumer preferences towards natural skin care products like natural antioxidants, plant extracts, organic acids, and essential oils, which requires a higher number of cosmetic preservatives in the manufacturing process, are likely to propel the growth and demand of the segment market over the coming years.
In addition, rising consumer disposable income and their spending capacity on their personal care and hygienic life are further propelling the growth and demand for lotions, facemasks, and toothpaste in the near future.
Natural preservatives segment is expected to hold the significant revenue share
The continuously growing need and demand for natural ingredients owing to rising concerns related to synthetic chemicals on the human body and environment are anticipated to boost the growth of the market segment during the forecast period. The rising popularity of several types of natural preservatives, including cinnamon, clove, tea tree, rosemary, lavender, and other types of spices and ointments, is supposed to have a significant rise in the global market growth.
Additionally, expanding global consumer focus on the utilization of clean and natural organic label products is also fueling the popularity of natural preservatives and is expected to drive the segment growth.
The Europe region held the largest market share in 2021
Many global manufacturers and increasing developing activities are driving the region’s growth. The major players operating in the region are BASF SE, Symrise AG, Evonik Industries, and Thor Group Ltd. coupled with the high consumer awareness regarding several benefits of cosmetic preservatives and the importance of maintaining a healthier and hygienic life, are a few other factors driving the growth of the market at a significant pace during the forecast period.
Furthermore, North America is witnessing the fastest CAGR during the forecast period owing to the early adoption of advanced technology, high consumer disposable income, and availability of enhanced and fast transportation facilities. In addition, the rising prevalence of various types of hygienic products and growing incorporation in sunscreen lotions, anti-aging creams, shampoos & conditioners, and facemasks is creating lucrative growth opportunities for a global market. It is anticipated to be the key factor fostering market growth.
Competitive Insight
Some of the major key market players in the global market are Ashland Group Holding, BASF, Arkema, Symrise, Evonik Industries, Clariant, International Flavors & Fragrances, Sharon Laboratories, Dow Chemical, Dadia Chemical Industries, Salicylates & Chemicals, Brenntag, Finetech Industry, Thor Group, and Procter & Gamble.
Recent Developments
In January 2022, Symrise AG acquired Schaffelaarbos, a leading market player in the European egg protein market. It’s a major step for Symrise AG to move forward in its global rapid expansion in the pet nutrition industry. The new acquisition will help the company to increase its capabilities in the United States with the state-of-the-art facilities of Schaffelaarbos in Barneveld, NL.
Cosmetic Preservatives Market Report Scope
| Report Attributes | Details |
| Market size value in 2022 | USD 410.80 million |
| Revenue forecast in 2030 | USD 693.53 million |
| CAGR | 6.77% from 2022 – 2030 |
| Base year | 2021 |
| Historical data | 2018 – 2020 |
| Forecast period | 2022 – 2030 |
| Quantitative units | Revenue in USD million and CAGR from 2022 to 2030 |
| Segments Covered | By Form, By Product, By Application, By Region |
| Regional scope | North America, Europe, Asia Pacific, Latin America; Middle East & Africa |
| Key Companies | Ashland Group Holding Inc., BASF SE, Arkema S.R.I., Symrise AG, Evonik Industries, Clariant AG, Salicylates & Chemicals Pvt Ltd., International Flavors & Fragrances Inc., Sharon Laboratories, The Dow Chemical Company, Dadia Chemical Industries, Brenntag AG, Finetech Industry Limited, Thor Group Ltd., and The Procter & Gamble Company. |
Research Methodology
A robust system of research, verification, and forecasting designed to ensure reliable and actionable market insights.
Polaris Market Research & Consulting, Inc. uses a clear and structured approach to deliver insights that clients can rely on. The process combines detailed primary and secondary research, including direct communication with industry experts. The detailed information helps build a complete picture of market trends and developments. Secondary data is gathered from credible sources such as industry reports, company filings, government source links, and trusted organization databases. It is then cross-checked through discussions with key stakeholders across the value chain. Market size and forecasts are developed using both bottom-up and top-down methods to ensure accuracy and consistency in the final results.
1. Project Setup
Step 1 & 2:
- We start every project by clearly understanding the client’s objective or goal, then defining the market scope, and aligning regions, segments, and timelines.
- Once the foundation is set, we collect data from all-around of sources, including company reports, government databases, and paid industry platforms.
- Our research is based on secondary data, which helps us build a strong understanding of the market across regions and industries. Then we validate this information through primary research by speaking directly with industry experts, companies, and stakeholders.
- By combining secondary and primary research, we ensure that our market insights are accurate, practical, and closely aligned with real market conditions.
2. Data Collection
We gather information from both public and verified sources:
3. Data Structuring
Step 3:
- All collected data is organized into a consistent format to ensure accurate analysis. Since inputs come from multiple sources, they are standardized and aligned before use.
- The data is segmented by product, application, and region, and mapped across a defined historical period (2020–2024). All values are converted into common units (USD Mn/Bn), and volume and pricing are aligned where required to estimate revenue.
- Any overlaps or inconsistencies are reviewed and adjusted to maintain accuracy (<5% variance threshold).
- The result is a structured dataset that allows for clear comparison across regions and supports reliable analysis and forecasting.
Structured Market Dataset, USD Mn/Bn
| Region | Segment | VolumeUnits | Avg PriceUSD | RevenueUSD Mn | Share % |
|---|---|---|---|---|---|
| North America | Product A | 250 | 2.5 | 500 | 15% |
| Product A | XX | XX | XX | XX | |
| Product A | XX | XX | XX | XX | |
| Consistent methodology applied across regions | |||||
4. Market Estimation
Step 4: TOP-DOWN APPROACH
- We start with the overall market size at a global or macro level.
- The market is then narrowed down based on scope and industry relevance.
- We apply penetration rates and split the data by region and segment.
- This helps us estimate the market size for specific segments.
- The numbers are validated through cross-checks to ensure accuracy.
Step 5: BOTTOM-UP APPROACH
- We begin by analyzing data from leading companies in the market.
- Revenue data is collected and mapped across different segments.
- The data is then aggregated to estimate the total market size.
- To fill in any gaps, adjustments are made based on industry standards.
- Validation checks make sure that the results are correct.
5. Forecasting
Step 6:
At Polaris Market Research & Consulting, Inc., we employ a methodical forecasting strategy. This approach blends the analysis of historical data with real-time market validation. To forecast future trends with precision, we examine past patterns, pricing fluctuations, and the interplay of supply and demand. To ensure our conclusions reflect the present market landscape, we actively seek input from industry experts and key stakeholders.
To refine our predictions, we carefully consider critical elements such as market drivers and restraints, fluctuations in raw material costs, emerging technologies, and the production capabilities of various regions. Furthermore, we assess regulatory frameworks and potential policy shifts to gauge their potential impact on market expansion.
All this information is synthesized to generate precise forecasts for each segment and region. These forecasts illuminate the current state of the market and highlight forthcoming opportunities.
6. Validation & Triangulation
Step 7:
In the final stage, we validate all our estimates using a triangulation method, where data is cross-checked from multiple reliable sources, like company data, primary interviews, and secondary research. This helps us make sure that our numbers are correct and fit with the rest of the market.
This process involves verifying data consistency across various segments and geographic areas. It also requires comparing historical trends with the assumptions support the forecast. Any discrepancies involve adjustments to ensure everything remains aligned and dependable.
Once the data is finalized, we prepare the final outputs, including market size estimates, segment-wise breakdowns, and growth metrics. These are delivered in structured formats such as tables, charts, and data files for easy analysis and use.
We collaborate closely with clients, ensuring the final products align with their requirements. This includes offering tailored adjustments, supplementary data analyses, and continuous assistance. Furthermore, we monitor market trends post-delivery, providing updates and refinements to maintain the insights' relevance as time passes.
Triangulation Framework
Estimates are cross-verified across three sources:
Company-level data
• Primary inputs from industry participants
• Secondary benchmarks and published data
Variance maintained within +5-10%
Adjustments applied to align estimates
Segment values validated against overall market structure
Data Consistency & Integrity
Segment totals validated to 100%
Regional estimates aligned with global market size
Historical trends compared against forecast outputs
Assumptions reviewed for cross-segment and regional alignment
Final Outputs
Deliverables
Client Alignment & Support
- Deliverables are aligned with defined client requirements and scope
- Custom data cuts and segment splits are incorporated as required
- Post-delivery queries are addressed through analyst interactions
- Additional clarifications and data support are provided upon request
Client Continuity & Updates
- Market developments are tracked post-delivery to capture changes in key trends
- Updated data and revisions are provided based on new market inputs
- Additional refinements and data cuts are shared as required
- Continued analyst engagement supports evolving client requirements
Download Sample Report of Cosmetic Preservatives Market
Please fill out the form to request a customized copy of the research report.
