
Global Dry Van Container Market Size, Share & Growth Analysis Report, 2023-2032
REPORT DETAILS
The global dry van container market was valued at USD 5.38 billion in 2022 and is expected to grow at a CAGR of 5.5% during the forecast period.
The significant increase in international or global trade operations and emerging demand and supply patterns with greater proliferation of advanced technologies in shipping and logistics sectors, allowing real-time tracking and monitoring of containers to better control the overall supply chains, are among the leading factors propelling the global market growth. In addition, the exponential rise in the popularity of smart containers and introduction to new dry van containers with improved capabilities that are expanding their range of use from sea transport to road and other transport modes, will also bode well for the market growth at rapid pace.
Source: Polaris Market Research Analysis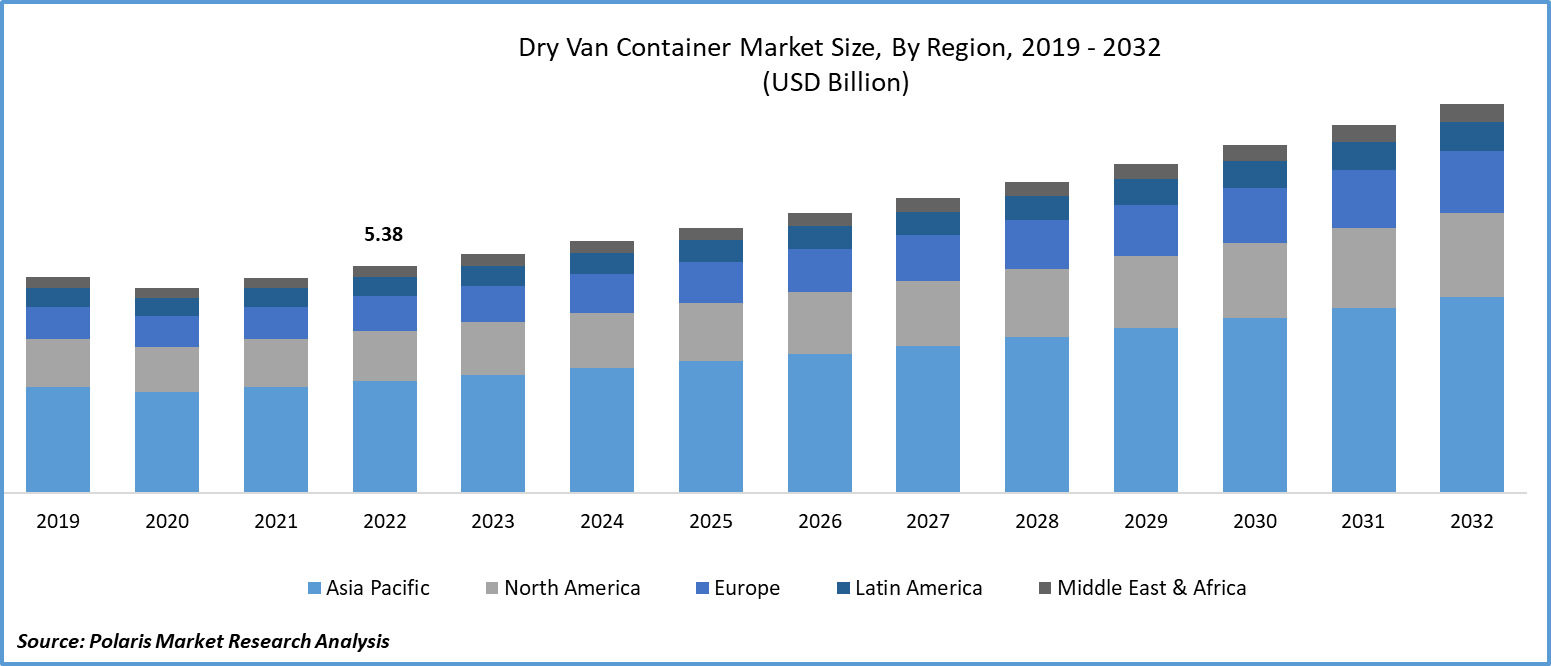
To Understand More About this Research: Download Sample Report
For instance, in April 2023, Aeler Technologies SA, a leading EPFL University startup based in Switzerland, announced about its signed commercial representation agreement with Navex, a leading shipping agent part of group EPE, for their smart Unit One glass fiber shipping container. The new container comes with a 17% higher payload capacity that makes it possible to load 28-ton flexitanks.
Moreover, the rapid integration of telematics and Internet of Things technology into dry van containers in the recent years has transformed the dry van containers. As, growing proliferation of sensors and GPS tracking systems allows for real-time monitoring of cargo conditions, location, temperature, humidity, and security, which helps improve supply chain visibility, reduce theft, and ensure cargo integrity is further pushing the global market.
The outbreak of the COVID-19 pandemic has significantly impacted the growth of the dry van container market. The rapid emergence of deadly coronavirus across the globe leading to huge disruption in global supply chains, as many countries have imposed several restrictions on trade activities and social distancing measures that led to significant decline in global trade and import and export of goods all over the world.
Industry Dynamics
Growth Drivers
Increase in Containers Lease and Rental Services Driving the Global Market Growth
The continuous increase in global demand-supply scenario of construction and manufacturing industries all over the world and increase in the number of rental and lease services for containers for shipment and logistics industries, are among the major factors propelling the dry van container market growth.
There has been a constant increase in the growth of e-commerce sector around the world with growing number of digital buyers and preferences for online shopping models over traditional retail or offline channels, which has led to drastic increase in demand for dry van containers to transport consumer goods across country borders and ports, are further likely to boost the demand and growth of the market.
For instance, according to a report by Forbes, around 20.8% of all retail purchases are projected to take place online in 2023, and this percentage is expected to reach approx. 24% of retail purchases worldwide. The e-commerce sales are likely to grow at 10.4% in 2023 and will reach USD 6.3 trillion in 2023.
As global trade continues to expand, there is a consistent demand for dry van containers to transport goods across borders. Economic growth in emerging markets and increased international trade contribute to the market's growth.
Source: Polaris Market Research Analysis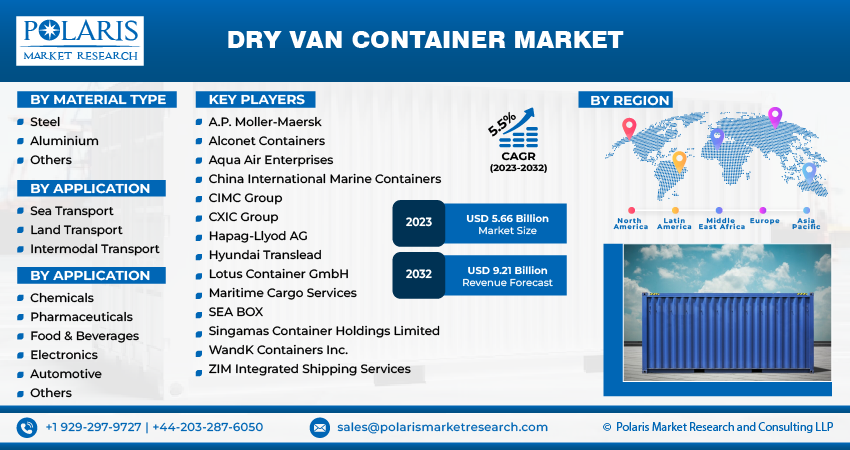
Report Segmentation
The market is primarily segmented based on material type, application, end-use, and region.
| By Material Type | By Application | By End-Use | By Region |
|
|
|
|
Source: Polaris Market Research Analysis
To Understand the Scope of this Report: Request Customization
By Material Type Analysis
Steel Segment Accounted for the Largest Market Share in 2022
The steel segment accounted for the largest market share. The growth of the segment market can be largely attributed to higher demand and preferences for steel type containers due to their numerous beneficial characteristics including high durability and low costs compared to other material available in the market.
The aluminum segment is expected to exhibit fastest growth rate over the next coming years, on account of growing number of companies opting for aluminum for the manufacturing of their containers due to their advantageous properties such as high elasticity, magnetic resistance, malleability, high strength, corrosion resistance, and low weight characteristics. Apart from this, aluminum containers are well known for their durability and resistance to wear and tear, which ensures that they remain in service for a longer period, offering good ROI for companies operating in the market.
By Application Analysis
Sea Transport Segment Held the Significant Market Share in 2022
The sea transport segment held the majority market share in terms of revenue in 2022, which is majorly driven by exponential growth of international trade and surge in the global economy leading to increased import and export activities of goods and services and rising adoption of containerization as a standardized and efficient way for transporting goods at sea ports. Additionally, growing investments in port infrastructure and the development of efficient container handling facilities have further improved the flow of goods and reduced container dwell times, and resulting in positive impact on segment market.
For instance, according to the UNCTAD’s latest Global Trade Update, the global trade for both goods and services have surged by 1.9% in the first three months of 2023, with adding USD 100 billion from the last quarter of 2022.
By End-Use Analysis
Electronics Segment is Anticipated to Witness Highest Growth
The electronics segment is anticipated to grow at highest growth rate over the course of study period, mainly accelerated to surge in the number of electronic manufacturers looking for ways to efficiently optimize their supply chains to reduce costs and improve efficiency and growth in the number of trade agreements promoting the global trade of several types of electronics products mainly semiconductor.
The food & beverage held the largest share, mainly due to large number of food safety regulations and requirements for temperature-controlled transportation to maintain the freshness and quality of food products, that have fueled the demand for dry van containers with integrated advanced features such as refrigeration and insulation.
Regional Insights
Asia Pacific Region Dominated the Global Market in 2022
The Asia Pacific region dominated the global market with considerable share. The regional market growth is highly attributable to presence of some of the leading exporter countries like China, India, & Japan, among others and presence of several favorable factors in the APAC region including cheap labor, low-cost of raw materials, and various supportive government initiatives, is further escalating the market growth in the region.
The North America region is anticipated to emerge as fastest growing region with a healthy CAGR over the forecast period, owing to increase in infrastructure development activities or projects such as port upgrades and highway expansion leading to higher demand for dry van containers and drastic increase in the e-commerce sector boosting the shipping and storage solutions especially in countries like US and Canada.
Key Market Players & Competitive Insights
The dry van container market is moderately competitive with the presence of several leading global market players, and the leading companies in the market are significantly focusing on emerging smart logistics trend and making their containers smart with integration new advanced technologies like telematics and IoT. Companies have also been investing largely into business development strategies including acquisitions, partnerships, and collaborations, in order to expand their market reach.
Some of the major players operating in the global market include:
- A.P. Moller-Maersk
- Alconet Containers
- Aqua Air Enterprises
- China International Marine Containers
- CIMC Group
- CXIC Group
- Hapag-Llyod AG
- Hyundai Translead
- Lotus Container GmbH
- Maritime Cargo Services
- SEA BOX
- Singamas Container Holdings Limited
- WandK Containers Inc.
- ZIM Integrated Shipping Services
Recent Developments
- In July 2023, Ship Angel, announced the launch of a new artificial-intelligence enabled container rate management platform, that will help reducing ocean carrier invoice issues and other industry point. The newly launched cloud-based offers a modern user interface and also streamlined the user experience.
- In September 2021, Doleco USA, unveiled its newly developed LayerLok XP, AF, & SC double-decking systems, that is mainly designed to be used in dry van & reefer applications at the American Trucking Associations. They are capable of the doubling pay-load capacity and increases the available options to the global shipping industry.
Dry Van Container Market Report Scope
| Report Attributes | Details |
| Market size value in 2023 | USD 5.66 billion |
| Revenue forecast in 2032 | USD 9.21 billion |
| CAGR | 5.5% from 2023 – 2032 |
| Base year | 2022 |
| Historical data | 2019 – 2021 |
| Forecast period | 2023 – 2032 |
| Quantitative units | Revenue in USD billion and CAGR from 2023 to 2032 |
| Segments covered | By Material Type, By Application, By End-Use, By Region |
| Regional scope | North America, Europe, Asia Pacific, Latin America, Middle East & Africa |
| Customization | Report customization as per your requirements with respect to countries, region, and segmentation. |
Source: Polaris Market Research Analysis
Download Sample Report of Dry Van Container Market
Please fill out the form to request a customized copy of the research report.


