
Oxygen-Free Copper Market Share and Forecast, 2024-2032
REPORT DETAILS
REPORT DETAILS
ABOUT THIS REPORT
Market Statistics
Market Overview
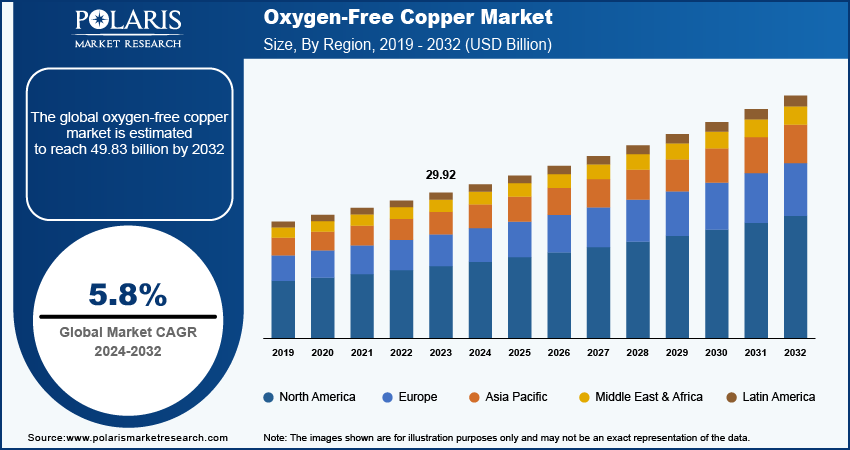
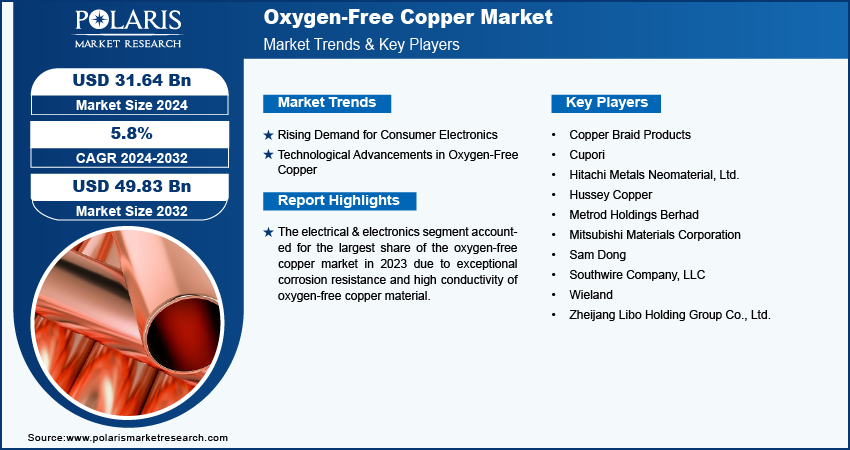
The oxygen-free copper market size was valued at USD 29.92 billion in 2023. The market is anticipated to grow from USD 31.64 billion in 2024 to USD 49.83 billion by 2032, exhibiting a CAGR of 5.8% during 2024–2032.
The expansion in manufacturing capacity of end-use industries is fueling the oxygen-free copper market growth. As electronics, automotive, renewable energy, and other sectors scale up production, the demand for high-conductivity materials such as oxygen-free copper intensifies. This copper variant, known for its superior electrical and thermal conductivity, is crucial for high-performance applications in these industries. With advancements in technology and increased investments in manufacturing infrastructure, companies are ramping up their production of oxygen-free copper to meet rising market needs. As a result, the oxygen-free copper market is growing across the world.
To Understand More About this Research: Download Sample Report
The expansion of the automotive industry is significantly driving the growth of the oxygen-free copper market. As automotive manufacturers increasingly adopt advanced technologies, the demand for high-performance materials such as oxygen-free copper rises. This copper variant is prized for its superior conductivity and resistance to corrosion, making it ideal for use in electric vehicles (EVs), hybrid vehicles, and sophisticated in-car electronics. The shift toward electrification and improved vehicle performance necessitates the use of high-quality materials for power transmission and electronic components, which is accelerating the adoption of oxygen-free copper.
Growth Drivers
Rising Demand for Consumer Electronics
The increasing demand for consumer electronics is significantly boosting the market for oxygen-free copper. Oxygen-free copper is known for its exceptional corrosion resistance and superior electrical conductivity. It is increasingly favored for enhancing the reliability and performance of electronic devices. This high-performance material is becoming a preferred choice among manufacturers seeking to meet the growing consumer demand for advanced, durable electronics. Consequently, many industry players are transitioning to oxygen-free copper to leverage its benefits. Thus, rising demand for consumer electronics fuels the oxygen-free copper market growth.
Technological Advancements in Oxygen-Free Copper
Technological advancements in oxygen-free copper to enhance the material's properties and applications propel the oxygen-free copper market growth. Innovations in production techniques and refining processes have led to improved purity and conductivity of oxygen-free copper, making it increasingly valuable in high-performance electronics and other demanding applications. These advancements enable better performance, reliability, and efficiency in products such as high-speed data cables, connectors, and electronic components. As technology continues to evolve, the increased capabilities of oxygen-free copper are meeting the rising demands of modern industries, thereby fueling its adoption.
Restraining Factors
High Initial Investments
Oxygen-free copper is ∼20% more expensive than traditional copper, primarily due to the rigorous quality control measures and specialized production processes necessary to maintain its purity. These enhanced production requirements ensure the superior conductivity and performance of the material, but they also contribute to its elevated price. This cost disparity poses a challenge for widespread adoption, as manufacturers and consumers weigh the benefits against the financial implications. Thus, the higher expenses remain a significant barrier to broader oxygen-free copper market expansion.
Report Segmentation
The oxygen-free copper market is primarily segmented on the basis of grade, product, application, and region.
By Grade Analysis
Cu-OF Segment Held Larger Market Share of Oxygen-Free Copper Market in 2023
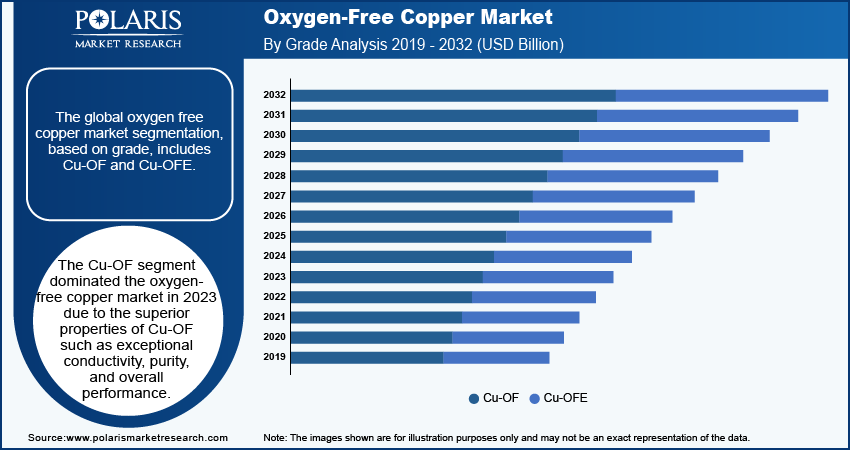
The Cu-OF segment dominated the oxygen-free copper market in 2023 due to the superior properties of Cu-OF such as exceptional conductivity, purity, and overall performance. Owing to its properties, Cu-OF is an ideal choice for a range of industries such as telecommunications, electronics, and power generation. Its excellent resistance to corrosion further enhances its appeal, ensuring durability and longevity in applications that demand high conductivity. The combination of these attributes positions Cu-OF as a preferred material among other grades.
By Product Analysis
Wires Segment Accounted for Largest Oxygen-Free Copper Market Share in 2023
The wires segment dominated the oxygen-free copper market in 2023 owing to its advantageous properties and rising demand. Oxygen-free copper’s superior conductivity and resistance to corrosion make it exceptionally well-suited for high-performance wiring applications. Its ability to ensure stable and efficient signal transmission is crucial for industries such as telecommunications, electronics, and power generation. The increasing demand for reliable and high-quality wiring solutions has propelled the wires segment.
By Application Analysis
Electrical & Electronics Segment Held Significant Market Revenue Share in 2023
The electrical & electronics segment accounted for the largest share of the oxygen-free copper market in 2023 due to exceptional corrosion resistance and high conductivity of oxygen-free copper material. These properties make oxygen-free copper particularly valuable in applications such as power transmission lines and high-end audio cables, where signal efficiency and integrity are essential. These benefits are leading to the increase in demand for oxygen-free copper in the electrical & electronics industry.
Regional Insights
Asia Pacific Held Largest Share of Global Oxygen-Free Copper Market in 2023
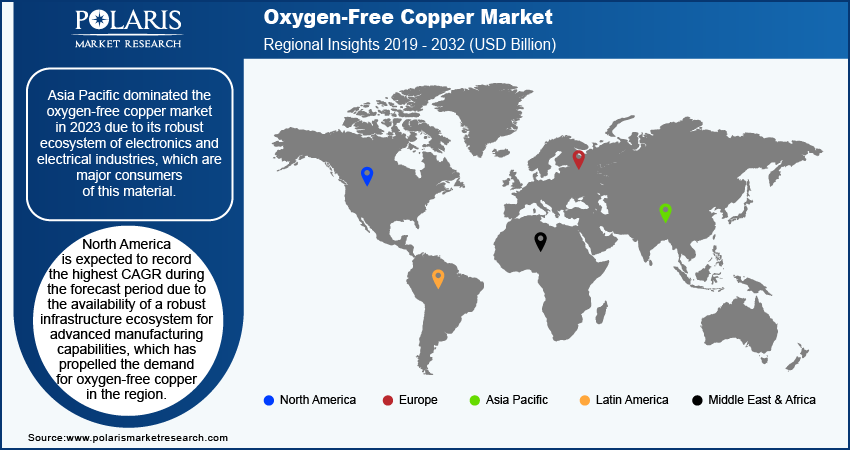
Asia Pacific dominated the oxygen-free copper market in 2023 due to its robust ecosystem of electronics and electrical industries, which are major consumers of this material. Oxygen-free copper is essential in applications such as power transmission, high-end audio equipment, and telecommunications, all of which are prominent in this region. Additionally, significant investments in infrastructure development by countries such as Japan and China have fueled market growth. These investments are enhancing the region’s capacity for advanced technology and electrical systems, boosting the demand for high-performance materials such as oxygen-free coppers across the region.
North America is expected to record the highest CAGR during the forecast period due to the availability of a robust infrastructure ecosystem for advanced manufacturing capabilities, which has propelled the demand for oxygen-free copper in the region. Additionally, increasing merger and acquisition strategies by major players in the region are anticipated to expand the oxygen-free copper market reach during the forecast period.
Key Market Players and Competitive Insights
Strategic Initiatives by Market Players to Drive Competition
The oxygen-free copper market is consolidated. The growing technological advancements in oxygen-free copper production positively impact the global market. Ongoing activities of market players such as expansions, partnerships, and mergers & acquisitions fuel competition in the market. For instance, in December 2023, PT. Smelting ("PTS"), a subsidiary of Mitsubishi Materials, expanded its processing capacity of the copper concentrate at its Gresik Smelter & Refinery in the Gresik District, Indonesia.
List of Key Companies
- Copper Braid Products
- Cupori
- Hitachi Metals Neomaterial, Ltd.
- Hussey Copper
- Metrod Holdings Berhad
- Mitsubishi Materials Corporation
- Sam Dong
- Southwire Company, LLC
- Wieland
- Zheijang Libo Holding Group Co., Ltd.
Recent Developments in Industry
-
In February 2024, Incus GmbH, based in Vienna, Austria, announced the production of 99.9% pure copper material after a year of research and development. This new material, created using advanced lithography-based metal manufacturing techniques, achieved 92% of the conductivity of conventionally produced copper.
-
In December 2023, C4V signed an MoU with Hindalco Industries to collaborate on anode copper development for the growing U.S. EV market.
-
In November 2023, Redwood Materials announced plans to backward integrate into copper cathode production, with operations expected to begin in 2025.
-
In November 2023, SK Nexilis began producing ultra-thin (4 microns) oxygen-free copper at its new Malaysia facility, with a 57 kiloton annual capacity built through a KRW 900 billion (~USD 690 million) investment.
-
In October 2023, SK Nexilis Co., a global copper foil maker, launched commercial production at its first overseas facility in Kota Kinabalu, Malaysia. The plant, featuring the world's largest copper foil production lines, was inaugurated for diverse rechargeable battery applications.
Oxygen-Free Copper Market Segmentation
By Grade Outlook (USD billion, 2019–2032)
- Cu-OF
- Cu-OFE
By Product Outlook (USD billion, 2019–2032)
- Wires
- Strips
- Busbars & Rods
- Other Products
By Application Outlook (USD billion, 2019–2032)
- Electrical & Electronics
- Automotive
- Other Applications
By Regional Outlook (USD billion, 2019–2032)
- North America
- US
- Canada
- Europe
- Germany
- France
- UK
- Italy
- Spain
- Netherlands
- Russia
- Rest of Europe
- Asia Pacific
- China
- Japan
- India
- Malaysia
- South Korea
- Indonesia
- Australia
- Rest of Asia Pacific
- Middle East & Africa
- Saudi Arabia
- UAE
- Israel
- South Africa
- Rest of Middle East & Africa
- Latin America
- Mexico
- Brazil
- Argentina
- Rest of Latin America
Report Coverage
The oxygen-free copper market report emphasizes key regions across the globe to provide a better understanding of the product to the users. Also, the report provides market insights into recent developments and trends and analyzes the technologies that are gaining traction around the globe. Furthermore, it covers in-depth qualitative analysis pertaining to various paradigm shifts associated with the transformation of these solutions.
The report provides a detailed analysis of the market while focusing on various key aspects such as competitive analysis, grade, product, application, and their futuristic growth opportunities.
Oxygen-Free Copper Market Report Scope
| Report Attributes | Details |
| Market Size Value in 2024 | USD 31.64 billion |
| Revenue Forecast by 2032 | USD 49.83 billion |
| CAGR | 5.8% from 2024 to 2032 |
| Base Year | 2023 |
| Historical Data | 2019–2022 |
| Forecast Period | 2024–2032 |
| Quantitative Units | Revenue in USD billion and CAGR from 2024 to 2032 |
| Segments Covered |
|
| Regional Scope |
|
| Competitive Landscape |
|
| Report Format |
|
| Customization | Report customization as per your requirements with respect to countries, regions, and segmentation. |
FAQ's
The oxygen-free copper market size was valued at USD 29.92 billion in 2023 and is projected to grow to USD 49.83 billion by 2032.
The global market is projected to register a CAGR of 5.8% during 2024–2032.
Asia Pacific accounted for the largest share of the global market in 2023.
A few key players in the market are Copper Braid Products; Cupori; Hitachi Metals Neomaterial, Ltd.; Hussey Copper; Metrod Holdings Berhad; Mitsubishi Materials Corporation; Sam Dong; Southwire Company, LLC; Wieland; and Zheijang Libo Holding Group Co., Ltd.
The Cu-OF segment is anticipated to experience substantial growth with a significant CAGR in the global market during the forecast period. This growth is attributed to the exceptional conductivity, purity, and overall performance of Cu-OF
The electrical & electronics segment accounted for the largest revenue share of the market in 2023 due to an increase in demand for durable and advanced consumer electronics.
Research Methodology
A robust system of research, verification, and forecasting designed to ensure reliable and actionable market insights.
Polaris Market Research & Consulting, Inc. uses a clear and structured approach to deliver insights that clients can rely on. The process combines detailed primary and secondary research, including direct communication with industry experts. The detailed information helps build a complete picture of market trends and developments. Secondary data is gathered from credible sources such as industry reports, company filings, government source links, and trusted organization databases. It is then cross-checked through discussions with key stakeholders across the value chain. Market size and forecasts are developed using both bottom-up and top-down methods to ensure accuracy and consistency in the final results.
1. Project Setup
Step 1 & 2:
- We start every project by clearly understanding the client’s objective or goal, then defining the market scope, and aligning regions, segments, and timelines.
- Once the foundation is set, we collect data from all-around of sources, including company reports, government databases, and paid industry platforms.
- Our research is based on secondary data, which helps us build a strong understanding of the market across regions and industries. Then we validate this information through primary research by speaking directly with industry experts, companies, and stakeholders.
- By combining secondary and primary research, we ensure that our market insights are accurate, practical, and closely aligned with real market conditions.
2. Data Collection
We gather information from both public and verified sources:
3. Data Structuring
Step 3:
- All collected data is organized into a consistent format to ensure accurate analysis. Since inputs come from multiple sources, they are standardized and aligned before use.
- The data is segmented by product, application, and region, and mapped across a defined historical period (2020–2024). All values are converted into common units (USD Mn/Bn), and volume and pricing are aligned where required to estimate revenue.
- Any overlaps or inconsistencies are reviewed and adjusted to maintain accuracy (<5% variance threshold).
- The result is a structured dataset that allows for clear comparison across regions and supports reliable analysis and forecasting.
Structured Market Dataset, USD Mn/Bn
| Region | Segment | VolumeUnits | Avg PriceUSD | RevenueUSD Mn | Share % |
|---|---|---|---|---|---|
| North America | Product A | 250 | 2.5 | 500 | 15% |
| Product A | XX | XX | XX | XX | |
| Product A | XX | XX | XX | XX | |
| Consistent methodology applied across regions | |||||
4. Market Estimation
Step 4: TOP-DOWN APPROACH
- We start with the overall market size at a global or macro level.
- The market is then narrowed down based on scope and industry relevance.
- We apply penetration rates and split the data by region and segment.
- This helps us estimate the market size for specific segments.
- The numbers are validated through cross-checks to ensure accuracy.
Step 5: BOTTOM-UP APPROACH
- We begin by analyzing data from leading companies in the market.
- Revenue data is collected and mapped across different segments.
- The data is then aggregated to estimate the total market size.
- To fill in any gaps, adjustments are made based on industry standards.
- Validation checks make sure that the results are correct.
5. Forecasting
Step 6:
At Polaris Market Research & Consulting, Inc., we employ a methodical forecasting strategy. This approach blends the analysis of historical data with real-time market validation. To forecast future trends with precision, we examine past patterns, pricing fluctuations, and the interplay of supply and demand. To ensure our conclusions reflect the present market landscape, we actively seek input from industry experts and key stakeholders.
To refine our predictions, we carefully consider critical elements such as market drivers and restraints, fluctuations in raw material costs, emerging technologies, and the production capabilities of various regions. Furthermore, we assess regulatory frameworks and potential policy shifts to gauge their potential impact on market expansion.
All this information is synthesized to generate precise forecasts for each segment and region. These forecasts illuminate the current state of the market and highlight forthcoming opportunities.
6. Validation & Triangulation
Step 7:
In the final stage, we validate all our estimates using a triangulation method, where data is cross-checked from multiple reliable sources, like company data, primary interviews, and secondary research. This helps us make sure that our numbers are correct and fit with the rest of the market.
This process involves verifying data consistency across various segments and geographic areas. It also requires comparing historical trends with the assumptions support the forecast. Any discrepancies involve adjustments to ensure everything remains aligned and dependable.
Once the data is finalized, we prepare the final outputs, including market size estimates, segment-wise breakdowns, and growth metrics. These are delivered in structured formats such as tables, charts, and data files for easy analysis and use.
We collaborate closely with clients, ensuring the final products align with their requirements. This includes offering tailored adjustments, supplementary data analyses, and continuous assistance. Furthermore, we monitor market trends post-delivery, providing updates and refinements to maintain the insights' relevance as time passes.
Triangulation Framework
Estimates are cross-verified across three sources:
Company-level data
• Primary inputs from industry participants
• Secondary benchmarks and published data
Variance maintained within +5-10%
Adjustments applied to align estimates
Segment values validated against overall market structure
Data Consistency & Integrity
Segment totals validated to 100%
Regional estimates aligned with global market size
Historical trends compared against forecast outputs
Assumptions reviewed for cross-segment and regional alignment
Final Outputs
Deliverables
Client Alignment & Support
- Deliverables are aligned with defined client requirements and scope
- Custom data cuts and segment splits are incorporated as required
- Post-delivery queries are addressed through analyst interactions
- Additional clarifications and data support are provided upon request
Client Continuity & Updates
- Market developments are tracked post-delivery to capture changes in key trends
- Updated data and revisions are provided based on new market inputs
- Additional refinements and data cuts are shared as required
- Continued analyst engagement supports evolving client requirements
Download Sample Report of Oxygen-Free Copper Market
Please fill out the form to request a customized copy of the research report.
