Real World Evidence Solutions Market Share, Size, Trends, Industry Analysis Report, 2022 - 2030

Real World Evidence Solutions Market Share, Size, Trends, Industry Analysis Report, 2022 - 2030

REPORT DETAILS

Report Code: PM2339
No. of Pages: 118
Format: PDF
Published Date:
Base Year: 2021
Author: Prajakta Bengale
Historical Data: 2018 - 2020

REPORT DETAILS

Report Code: PM2339
Published Date:
No. of Pages: 118
Historical Data: 2018 - 2020
Format: PDF
Author: Prajakta Bengale
Base Year: 2021
Real World Evidence Solutions Market Share, Size, Trends, Industry Analysis Report, By Component (DataSets, Consulting and Analytics); By Therapeutic Areas (Oncology, Cardiovascular, Neurology, Immunology, Others): By End-User; By Region; Segment Forecast, 2022 - 2030

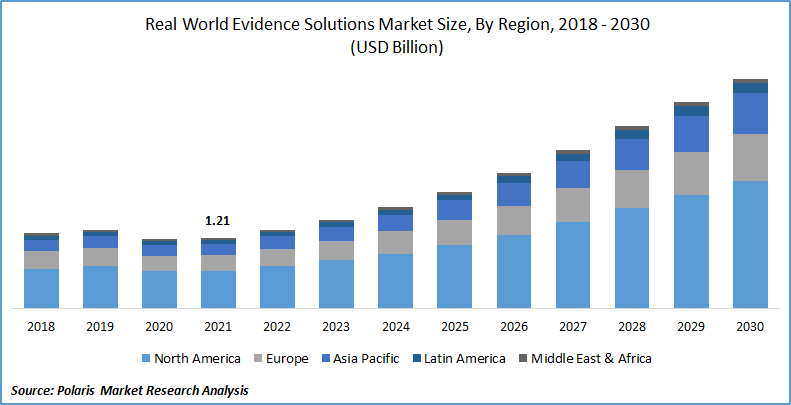
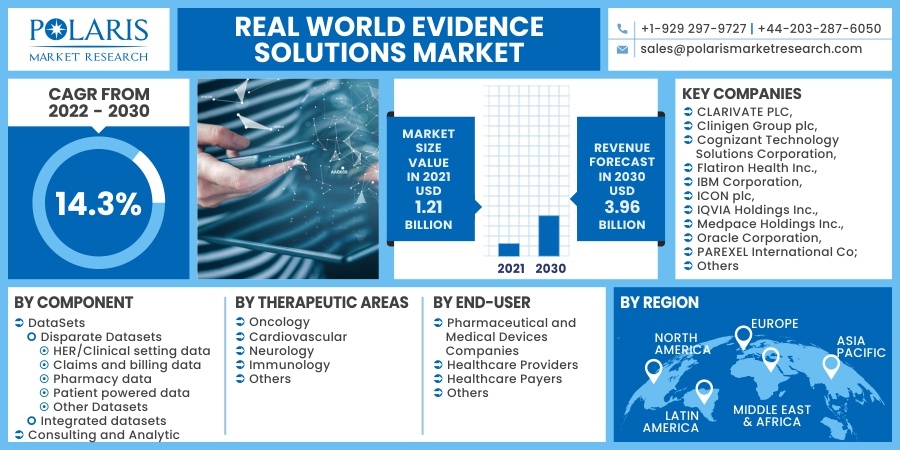
The global real world evidence solutions market was valued at USD 1.21 billion in 2021 and is expected to grow at a CAGR of 14.3% during the forecast period. Factors such as benefits of RWE along with its adoption in the healthcare and pharmaceutical sector. Real world evidence (RWE) is published evidence derived from real world facts on the use of a pharmaceutical drug and its potential benefits or risks. It is evidence derived from real world data (RWD).

Real World Evidence Solutions Market Size

Know more about this reportDownload Sample Report

Based on observational data, RWD generates insights, extrapolative outcomes, and predictions on diseases, medical equipment, unmet patient requirements, the cost of the goods to subpopulations, and patient information.

Real world data is also utilized to analyze patient outcomes and help patients get the best care possible. RWE is developed by analyzing electronic health records (EHR), healthcare claims and billing operation systems, registries, patient-provided data, mobile devices, and other resources. It can originate from both observational and experimental studies and databases. Real world evidence solutions is used when clinical evaluations have not accounted for the entire patient group of disease. Real world evidence provides solutions to these problems and a longer-term assessment of pharmacological effects.

Further, the rising market demand for EHR is also driving the growth of real world evidence solutions market. EHRs are the most frequent type of healthcare information that aids in executing outcome-based investigations. EHR data is becoming increasingly important in the FDA's collection and generation of useful knowledge. Governments throughout the globe are launching programs to increase EHR/EMR data use. For example, in September 2020, the Ministry of Health and Family Welfare (MoHFW) produced a draught policy called the Health Data Management Policy to digitalize India's whole healthcare ecosystem.

Also, the Australian Digital Health Agency was founded by the Australian government to evolve digital health competence through creativity, cooperation, and leadership in the health system. After significant engagement with the Australian community, the Agency produced the National Digital Health Strategy and thoroughly reviewed the evidence solutions. The Strategy offers seven strategic priority objectives that must be met by 2022.

Real World Evidence Solutions Market

Know more about this reportDownload Sample Report

Industry Dynamics

Growth Drivers
Various countries across the globe have a population that is majorly comprised of older adults. The aging populace needs constant care on a long-term basis and thus market demands more medical devices for healthcare. With the increasing prevalence of the senior population and their changing lifestyle, the aged ones majorly suffer from various chronic diseases such as diabetes; hence, the market demand for advanced medical healthcare devices and therapies increases. This has risen the growth of the real world evidence solutions market.

Further, with the increases in the incidence of rare diseases and the tendency toward personalized healthcare, universal health care and research organizations are likely to experience challenges such as high costs, lengthy timelines for providing treatments to patients, and the time-consuming, costly, and risky process of creating new pharmaceutical entities. During the projection period, the increased prevalence of chronic diseases such as cancer and diabetes, among others, would drive real world evidence solutions market expansion.

Report Segmentation

The market is primarily segmented based on components, end-user, therapeutic areas, and region.

By Component

By Therapeutic Areas

By End-User

By Region

  • DataSets
    • Disparate Datasets
      • HER/Clinical setting data
      • Claims and billing data
      • Pharmacy data
      • Patient powered data
      • Other Datasets
    • Integrated datasets
  • Consulting and Analytic
  • Oncology
  • Cardiovascular
  • Neurology
  • ·Immunology
  • Others
  • Pharmaceutical and Medical Devices Companies
  • Healthcare Providers
  • Healthcare Payers
  • Others
  • North America (U.S., Canada)
  • Europe (France, Germany, UK, Italy, Netherlands, Spain, Austria)
  • Asia Pacific (Japan, China, India, Malaysia, Indonesia. South Korea)
  • Latin America (Brazil, Mexico, Argentina)
  • Middle East & Africa (Saudi Arabia, UAE, Israel, South Africa)

Know more about this reportDownload Sample Report

Insight by Therapeutic Areas

Based on the therapeutic areas segment, the oncology segment is the most significant revenue contributor in the global market in 2021 and is expected to retain its dominance in the foreseen period. The considerable share of this segment can be attributable to a large number of oncology clinical trials done and the rising prevalence of cancer globally.

Geographic Overview

In terms of geography, North America had the largest share. The favorable regulatory environment, an increasing percentage of payers utilizing RWD, an expanding number of real world evidence solutions providers, RWE for drug approvals are driving the region’s growth.

Moreover, Asia Pacific is expected to witness a high CAGR in the global real world evidence solutions industry in 2021. The region is expanding due to rising government schemes to implement RWE studies and the presence of several Contract Research Organizations (CROs) and manufacturing firms in nations such as China and India.

Rising market demand for better medical care is also expected to drive market expansion. The increasing government initiatives for RWE study implementation, the rising impact of chronic illnesses, the rising need for better healthcare services, and the growing elderly population are propelling the development of the Asia Pacific RWE solutions.

Competitive Insight

Some of the major players operating in the global real world evidence solutions market include:

  • CLARIVATE PLC
  • Clinigen Group plc
  • Cognizant Technology Solutions Corporation
  • Flatiron Health Inc.
  • IBM Corporation
  • ICON plc
  • IQVIA Holdings Inc.
  • Medpace Holdings Inc.
  • Oracle Corporation
  • PAREXEL International Corporation
  • PerkinElmer Inc.
  • PPD Inc.
  • SAS Institute Inc.
  • Symphony Innovation LLC
  • SYNEOS HEALTH Inc.
  • UnitedHealth Group Incorporated.

Recent Developments

  • In November 2025, Datavant and AWS launched Datavant Connect powered by AWS Clean Rooms, a cloud-based platform designed to help life-science companies securely access and analyze real-world data across multiple sources without transferring raw data. The solution, already validated by four top-20 pharmaceutical companies and 15 leading RWD providers, enhances data discovery, accelerates evidence generation, and maintains strict privacy and security standards.
  • In October 2025, LyfeSci Research & Innovation, a newly established physician-led contract research organization (CRO), was launched with a focus on outcomes-driven research. The company offers comprehensive services spanning pre-clinical development to real-world data (RWD) and real-world evidence (RWE) studies. Its patient- and site-centric approach is designed to improve operational efficiency, elevate study quality, and deliver faster, more meaningful insights for sponsors and healthcare providers.

Real World Evidence Solutions Market Report Scope

Report Attributes

Details

Market size value in 2021

USD 1.21 billion

Revenue forecast in 2030

USD 3.96 billion

CAGR

14.3% from 2022 - 2030

Base year

2021

Historical data

2018 - 2020

Forecast period

2022 - 2030

Quantitative units

Revenue in USD million and CAGR from 2022 to 2030

Segments covered

By Component, By Therapeutic Area, By End-Use, By Region

Regional scope

North America, Europe, Asia Pacific, Latin America; Middle East & Africa

Key Companies

CLARIVATE PLC, Clinigen Group plc, Cognizant Technology Solutions Corporation, Flatiron Health Inc., IBM Corporation, ICON plc, IQVIA Holdings Inc., Medpace Holdings Inc., Oracle Corporation, PAREXEL International Corporation, PerkinElmer Inc., PPD Inc., SAS Institute Inc., Symphony Innovation LLC, SYNEOS HEALTH Inc., and UnitedHealth Group Incorporated.

Page last updated on: Jan-2023

Research Methodology

A robust system of research, verification, and forecasting designed to ensure reliable and actionable market insights.

Polaris Market Research & Consulting, Inc. uses a clear and structured approach to deliver insights that clients can rely on. The process combines detailed primary and secondary research, including direct communication with industry experts. The detailed information helps build a complete picture of market trends and developments. Secondary data is gathered from credible sources such as industry reports, company filings, government source links, and trusted organization databases. It is then cross-checked through discussions with key stakeholders across the value chain. Market size and forecasts are developed using both bottom-up and top-down methods to ensure accuracy and consistency in the final results.

Data
Collection Project
Setup Market
Estimation Data
Structuring Quality
Check Output Forecasting Data
Validation Our Methodological
Approach Source: Polaris Market Research

1. Project Setup

Step 1 & 2:

  • We start every project by clearly understanding the client’s objective or goal, then defining the market scope, and aligning regions, segments, and timelines.
  • Once the foundation is set, we collect data from all-around of sources, including company reports, government databases, and paid industry platforms.
  • Our research is based on secondary data, which helps us build a strong understanding of the market across regions and industries. Then we validate this information through primary research by speaking directly with industry experts, companies, and stakeholders.
  • By combining secondary and primary research, we ensure that our market insights are accurate, practical, and closely aligned with real market conditions.

2. Data Collection

We gather information from both public and verified sources:

Secondary Research 50-100+ sources reviewed Company filings (10-K, annual reports) Government databases (trade, production, import/export) Paid databases (Bloomberg, Factiva, Statista) Coverage:
60-80% of total data inputs Primary Research 25-40 interviews conducted Manufacturers Distributors / channel partners Industry experts / consultants Coverage:
30-40% validation weight Source: Polaris Market Research

3. Data Structuring

Step 3:

  • All collected data is organized into a consistent format to ensure accurate analysis. Since inputs come from multiple sources, they are standardized and aligned before use.
  • The data is segmented by product, application, and region, and mapped across a defined historical period (2020–2024). All values are converted into common units (USD Mn/Bn), and volume and pricing are aligned where required to estimate revenue.
  • Any overlaps or inconsistencies are reviewed and adjusted to maintain accuracy (<5% variance threshold).
  • The result is a structured dataset that allows for clear comparison across regions and supports reliable analysis and forecasting.

Structured Market Dataset, USD Mn/Bn

Region Segment VolumeUnits Avg PriceUSD RevenueUSD Mn Share %
North America Product A 250 2.5 500 15%
Product AXXXXXXXX
Product AXXXXXXXX

4. Market Estimation

Step 4: TOP-DOWN APPROACH

  • We start with the overall market size at a global or macro level.
  • The market is then narrowed down based on scope and industry relevance.
  • We apply penetration rates and split the data by region and segment.
  • This helps us estimate the market size for specific segments.
  • The numbers are validated through cross-checks to ensure accuracy.
Top-down Approach Macro market base Value / Volume Parent market USD-based Volume-based Units X price Market scope alignment Penetration rate 5-50% Segment & regional split Geographic breakdown Estimated market size Market size reconciliation ±5-10% variance check Final market size USD Mn / Bn Market forecasting Source: Polaris Market Research

Step 5: BOTTOM-UP APPROACH

  • We begin by analyzing data from leading companies in the market.
  • Revenue data is collected and mapped across different segments.
  • The data is then aggregated to estimate the total market size.
  • To fill in any gaps, adjustments are made based on industry standards.
  • Validation checks make sure that the results are correct.
Bottom-up Approach Company-level data 20-25 comapnies Parent market Financials Segmental analysis Segment-level aggregation 60-80% coverage Gap adjustment Benchmarks Estimated market size Market size reconciliation ±5-10% variance check Final market size USD Mn / Bn Market forecasting Source: Polaris Market Research

5. Forecasting

Step 6:

At Polaris Market Research & Consulting, Inc., we employ a methodical forecasting strategy. This approach blends the analysis of historical data with real-time market validation. To forecast future trends with precision, we examine past patterns, pricing fluctuations, and the interplay of supply and demand. To ensure our conclusions reflect the present market landscape, we actively seek input from industry experts and key stakeholders.

To refine our predictions, we carefully consider critical elements such as market drivers and restraints, fluctuations in raw material costs, emerging technologies, and the production capabilities of various regions. Furthermore, we assess regulatory frameworks and potential policy shifts to gauge their potential impact on market expansion.

All this information is synthesized to generate precise forecasts for each segment and region. These forecasts illuminate the current state of the market and highlight forthcoming opportunities.

Data - Based Assessment Growth rates are derived from multi-year performance  Pricing movement is evaluated to align value projections  Volume and value relationships are assessed across segments Historical market data is analyzed to establish baseline trends  Market - Validated Assessment Supply-side insights are incorporated to account for production and capacity trends Forecast assumptions are aligned with current market conditions Industry inputs are used to validate growth assumptions Inputs from demand-side participants are considered to reflect consumption patterns  Source: Polaris Market Research

6. Validation & Triangulation

Step 7:

In the final stage, we validate all our estimates using a triangulation method, where data is cross-checked from multiple reliable sources, like company data, primary interviews, and secondary research. This helps us make sure that our numbers are correct and fit with the rest of the market.

This process involves verifying data consistency across various segments and geographic areas. It also requires comparing historical trends with the assumptions support the forecast. Any discrepancies involve adjustments to ensure everything remains aligned and dependable.

Once the data is finalized, we prepare the final outputs, including market size estimates, segment-wise breakdowns, and growth metrics. These are delivered in structured formats such as tables, charts, and data files for easy analysis and use.

We collaborate closely with clients, ensuring the final products align with their requirements. This includes offering tailored adjustments, supplementary data analyses, and continuous assistance. Furthermore, we monitor market trends post-delivery, providing updates and refinements to maintain the insights' relevance as time passes.

Validation

Triangulation Framework

Estimates are cross-verified across three sources:

Company-level data

• Primary inputs from industry participants

• Secondary benchmarks and published data

Variance maintained within +5-10%

Adjustments applied to align estimates

Segment values validated against overall market structure

Quality Check

Data Consistency & Integrity

Segment totals validated to 100%

Regional estimates aligned with global market size

Historical trends compared against forecast outputs

Assumptions reviewed for cross-segment and regional alignment

Output & Delivery

Final Outputs

Market size estimates (USD Mn/Bn)
Segment-wise distribution (%)
Growth metrics (CAGR %)

Deliverables

Structured tables and charts
Segment-level datasets
Excel-based data files for further analysis

Client Alignment & Support

  • Deliverables are aligned with defined client requirements and scope
  • Custom data cuts and segment splits are incorporated as required
  • Post-delivery queries are addressed through analyst interactions
  • Additional clarifications and data support are provided upon request

Client Continuity & Updates

  • Market developments are tracked post-delivery to capture changes in key trends
  • Updated data and revisions are provided based on new market inputs
  • Additional refinements and data cuts are shared as required
  • Continued analyst engagement supports evolving client requirements

Secure Your Competitive Edge With Our Expert-Driven Market Insights

Gain exclusive insights and strengthen your competitive position with our tailored research solutions. Connect with our research analysts and industry experts to elevate your decision-making.

Talk To Our Analyst
Download Sample