
Smart Lighting Market Size, Share Global Analysis Report, 2024-2032
REPORT DETAILS
REPORT DETAILS
ABOUT THIS REPORT
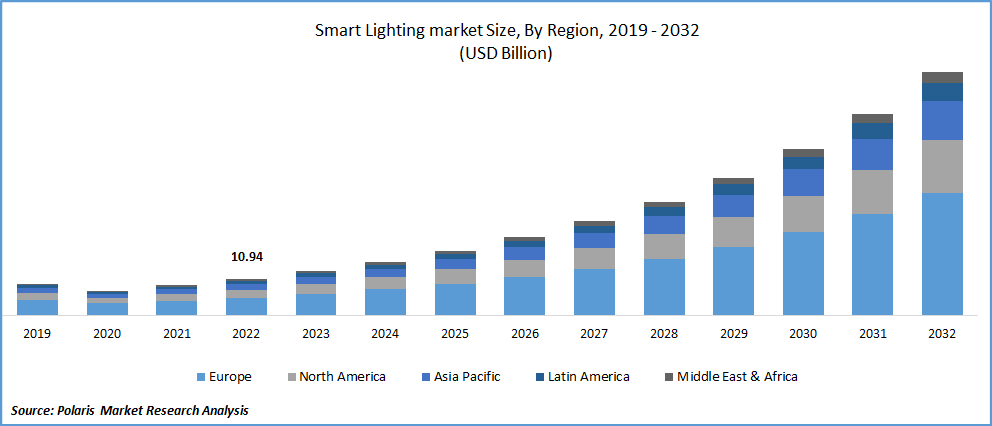
The global smart lighting market was valued at USD 13.2 billion in 2023 and is expected to grow at a CAGR of 20.8% during the forecast period. The quick expansion of smart city initiatives in established and emerging countries and the rising use of government subsidies for LED technology and sophisticated lighting systems drives the market for smart lighting.
Know more about this report: Download Sample Report
The need for intelligent lighting will further fuel the rapid expansion of commercial and industrial infrastructure developments. The growth of the smart lighting market during the anticipated period is also supported by an increase in end-use categories and growing government spending. The need for intelligent lighting has been significantly impacted negatively by the current COVID-19 outbreak. Due to the pandemic, there has been a modest decline in the demand for smart city engineering and construction services, which has led to a reduction in the usage of smart lighting systems.
Due to the ongoing COVID-19 pandemic's impact on production and raw material availability, other intelligent lighting firms have also reported declining sales. The pandemic also contributed to the fall in consumer purchasing power and the delay in finishing building projects, which reduced the quantity, schedule, and payment for purchase orders for smart lighting. As a result, it could limit the recent expansion of the worldwide market.
Know more about this report: Download Sample Report
Industry Dynamics
Growth Drivers
Government initiatives supporting energy efficiency, environmental protection, and strict laws against using incandescent bulbs are anticipated to be major drivers of the worldwide market for smart lighting. Around 19% of the world's power is generally used by the lighting industry, producing roughly 6% of greenhouse gas emissions.
The improved acceptance of standard protocols for intelligent lighting systems and new features such as API event generation and data analytics drive the market. Moreover, the United States, the United Kingdom, Germany, China, India, and Brazil are among the few key countries wherein smart cities have been expanding at an unprecedented rate.
According to the Consumer Technology Association, the sending on smart city projects globally reached almost USD 35.35 billion in 2020 from USD 14.85 billion in 2015. Similarly, the U.S. Government launched the “Smart Cities” initiative in 2015, with an investment of USD 160 million in the federal & incorporated more than 25 new technology collaborations to cope with challenges faced by local communities. Therefore, smart lighting has observed a significant rise in projects related to smart cities to improve the quality of life of individuals in the region.
Report Segmentation
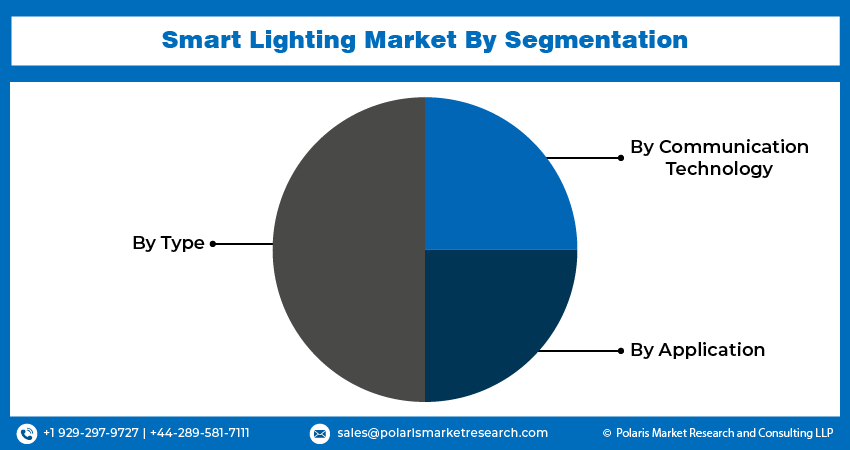
The market is primarily segmented based on type, communication technology, application, and region.
| By Type | By Communication Technology | By Application | By Region |
|
|
|
|
Know more about this report: Download Sample Report
Motion-Sensing Lights Segment is Expected to Witness Considerable Cagr over the Forecast Period
The motion-sensing lights segment is expected to witness considerable CAGR in the global industry during the foreseen period. This is due to the extensive adoption of intelligent home infrastructure projects. It provides end users a higher degree of protection and lowers energy usage by automatically shutting off lights when no motion is detected.
Wi-Fi Segment is Expected to Hold the Most Significant Market in 2022
The Wi-Fi segment is expected to hold the most significant market capture in the global market during the foreseen period based on the communication technology segment. The residential sector is the major adopter of such technology to control luminaire hues within a confined space, which eventually led to a rise in segmental growth worldwide.
On the contrary, the Bluetooth segment is expected to register a considerable share in revenue in the global market. One of the key advantages of using Bluetooth mesh for intelligent lighting is that it can help two-way communications. A similar mesh infrastructure can commission smart lighting solutions and control luminaire performance.
Further, the Bluetooth mesh has continually proven to be the most efficient and easy-to-use wireless technology for professional lighting applications and the only extremely scalable wireless standard. For instance, as of December 2019, nearly 500 Bluetooth mesh-certified products are available, up to 90% of which are lighting-focused end products. Therefore, this factor will be key for driving market growth worldwide.
Residential Segment is Anticipated to Witness a Large Revenue in 2022
The residential segment is expected to see a large revenue size in the global market, owing to the extensive implementation of intelligent lighting in residential buildings because of the rise in consumer awareness regarding smart lighting and the performance of energy-efficient products.
On the other hand, the commercial sector is anticipated to grow at a considerable CAGR in the worldwide market throughout the forecast period. The lighting for the gardens, outside walls, terrace, and outdoor areas of the shop space is part of the commercial architectural application. The need to provide energy-efficient lighting and track outdoor activities drives the market demand for smart lighting in commercial applications. This phenomenon is only used with intelligent street lighting. The need for intelligent lighting in commercial spaces is expected to increase, which is expected to contribute considerably to the segment's quick expansion throughout the forecasted period.
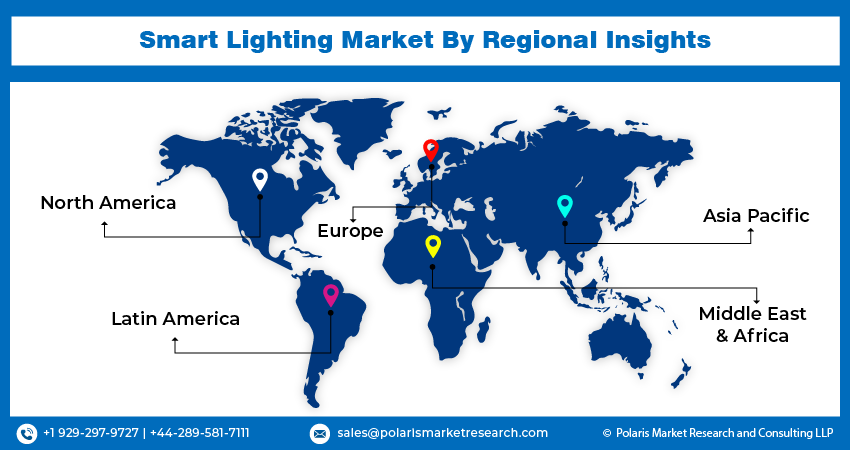
Europe Estimated for the Largest Market Share in 2022
Europe will be leading the global market in 2022. It is estimated for the largest share in terms of revenue due to the regional government drafting safety and uniform performance standards for specific indoor commercial intelligent lighting for roadways, parking, and garages. Dedicated LED luminaires and brilliant alternative lamps are evolving as the key trend in the lighting industry concerning the continual developments in LED design and technology.
Moreover, Asia-Pacific observed a high CAGR in the global market in 2022. The demand for intelligent lighting in the region is attributed to an increase over the forecast period, backed by the growing number of smart city and smart infrastructure projects commenced by the governments and the favorable public-private initiatives for offering low-cost LED lights at reasonable prices across the region. For instance, the National Smart Cities Mission was introduced to develop the country’s cities into intelligent cities. It was also directed toward the transformation of 100 smart cities in India to be completed.
Competitive Insight
Some of the major players operating in the global market include:
- Acuity Brands,
- GE current,
- Häfele GmbH & Co KG,
- Helvar,
- Honeywell International,
- Ideal Industries,
- Itron Inc.,
- LG Electronics,
- LightwaveRF,
- Lutron Electronics Company,
- Panasonic Corporation,
- RAB Lighting Inc.,
- Schneider Electric,
- Sengled Optoelectronics,
- Signify Holding,
- Syska,
- Verizon,
- Wipro Consumer Lighting,
- YEELIGHT,
- Zumtobel group ag.
Recent Developments
In October 2025: Qatar Public Works Authority began a nationwide shift to smart LED streetlights by 2027 aiming for 40 to 50 percent energy savings.
In September 2025: Snap One introduced Control4 X4 and Lux at CEDIA Expo with 600 watt dimming and Matter support for custom installs.
In June 2025: Snap One started commercial shipments of the Control4 X4 controller with built in edge AI for smart lighting scenes.
In May 2025: Riyadh Municipality expanded its smart pole project adding traffic sensors and Wi Fi to LED streetlights.
In January 2025: Signify Holding added new features and Philips Hue accessories to improve home lighting, entertainment, and security. The first generative AI assistant from Philips Hue became available to customers. Through the Hue app, users can create customized lighting scenes for moods, celebrations, or design styles. Settings can be generated using voice or text commands, with ongoing feedback for system improvements.
In November 2024: Lighting brands Thorn and Zumtobel of Zumtobel Group partnered with Sunderland AFC to upgrade the Stadium of Light’s lighting. This project is part of Sunderland AFC’s largest stadium investment in 20 years and supports the club’s goal of full energy independence by 2028.
Smart Lighting Market Report Scope
| Report Attributes | Details |
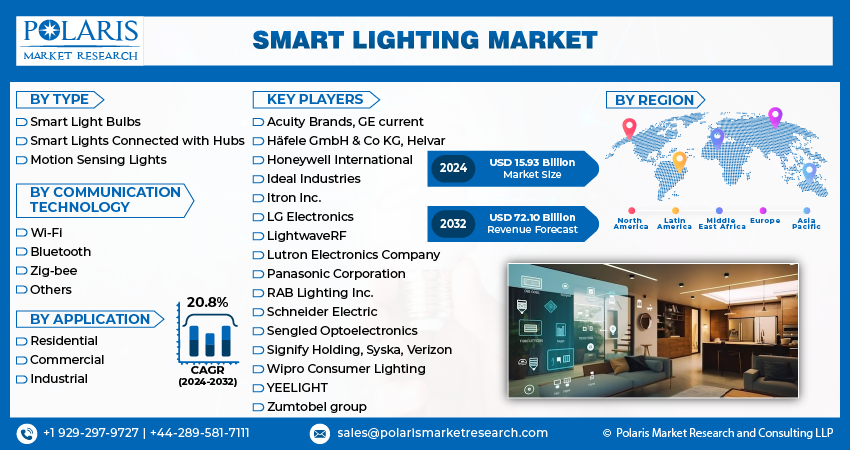
| Market size value in 2024 | USD 15.93 billion |
| Revenue forecast in 2032 | USD 72.10 billion |
| CAGR | 20.8% from 2024 – 2032 |
| Base year | 2023 |
| Historical data | 2019 – 2022 |
| Forecast period | 2024 – 2032 |
| Quantitative units | Revenue in USD billion and CAGR from 2024 to 2032 |
| Segments Covered | By Type, By Communication Technology, By Application, By Region |
| Regional scope | North America, Europe, Asia Pacific, Latin America, Middle East & Africa |
| Key Companies | Acuity Brands, GE current, Häfele GmbH & Co KG, Helvar, Honeywell International, Ideal Industries, Itron Inc., LG Electronics, LightwaveRF, Lutron Electronics Company, Panasonic Corporation, RAB Lighting Inc., Schneider Electric, Sengled Optoelectronics, Signify Holding, Syska, Verizon, Wipro Consumer Lighting, YEELIGHT, and Zumtobel group ag. |
FAQ's
Key companies in the smart lighting market are Acuity Brands, GE current, Häfele GmbH & Co KG, Helvar, Honeywell International, Ideal Industries, Itron Inc., LG Electronics, LightwaveRF, Lutron Electronics Company.
The global smart lighting market expected to grow at a CAGR of 20.8% during the forecast period.
Thesmart lighting market report covering key segments are type, communication technology, application, and region.
Key driving factor in the smart lighting market are government subsidies for LED technology and sophisticated lighting systems.
The global smart lighting market size is expected to reach USD 72.10 million by 2032.
Research Methodology
A robust system of research, verification, and forecasting designed to ensure reliable and actionable market insights.
Polaris Market Research & Consulting, Inc. uses a clear and structured approach to deliver insights that clients can rely on. The process combines detailed primary and secondary research, including direct communication with industry experts. The detailed information helps build a complete picture of market trends and developments. Secondary data is gathered from credible sources such as industry reports, company filings, government source links, and trusted organization databases. It is then cross-checked through discussions with key stakeholders across the value chain. Market size and forecasts are developed using both bottom-up and top-down methods to ensure accuracy and consistency in the final results.
1. Project Setup
Step 1 & 2:
- We start every project by clearly understanding the client’s objective or goal, then defining the market scope, and aligning regions, segments, and timelines.
- Once the foundation is set, we collect data from all-around of sources, including company reports, government databases, and paid industry platforms.
- Our research is based on secondary data, which helps us build a strong understanding of the market across regions and industries. Then we validate this information through primary research by speaking directly with industry experts, companies, and stakeholders.
- By combining secondary and primary research, we ensure that our market insights are accurate, practical, and closely aligned with real market conditions.
2. Data Collection
We gather information from both public and verified sources:
3. Data Structuring
Step 3:
- All collected data is organized into a consistent format to ensure accurate analysis. Since inputs come from multiple sources, they are standardized and aligned before use.
- The data is segmented by product, application, and region, and mapped across a defined historical period (2020–2024). All values are converted into common units (USD Mn/Bn), and volume and pricing are aligned where required to estimate revenue.
- Any overlaps or inconsistencies are reviewed and adjusted to maintain accuracy (<5% variance threshold).
- The result is a structured dataset that allows for clear comparison across regions and supports reliable analysis and forecasting.
Structured Market Dataset, USD Mn/Bn
| Region | Segment | VolumeUnits | Avg PriceUSD | RevenueUSD Mn | Share % |
|---|---|---|---|---|---|
| North America | Product A | 250 | 2.5 | 500 | 15% |
| Product A | XX | XX | XX | XX | |
| Product A | XX | XX | XX | XX | |
| Consistent methodology applied across regions | |||||
4. Market Estimation
Step 4: TOP-DOWN APPROACH
- We start with the overall market size at a global or macro level.
- The market is then narrowed down based on scope and industry relevance.
- We apply penetration rates and split the data by region and segment.
- This helps us estimate the market size for specific segments.
- The numbers are validated through cross-checks to ensure accuracy.
Step 5: BOTTOM-UP APPROACH
- We begin by analyzing data from leading companies in the market.
- Revenue data is collected and mapped across different segments.
- The data is then aggregated to estimate the total market size.
- To fill in any gaps, adjustments are made based on industry standards.
- Validation checks make sure that the results are correct.
5. Forecasting
Step 6:
At Polaris Market Research & Consulting, Inc., we employ a methodical forecasting strategy. This approach blends the analysis of historical data with real-time market validation. To forecast future trends with precision, we examine past patterns, pricing fluctuations, and the interplay of supply and demand. To ensure our conclusions reflect the present market landscape, we actively seek input from industry experts and key stakeholders.
To refine our predictions, we carefully consider critical elements such as market drivers and restraints, fluctuations in raw material costs, emerging technologies, and the production capabilities of various regions. Furthermore, we assess regulatory frameworks and potential policy shifts to gauge their potential impact on market expansion.
All this information is synthesized to generate precise forecasts for each segment and region. These forecasts illuminate the current state of the market and highlight forthcoming opportunities.
6. Validation & Triangulation
Step 7:
In the final stage, we validate all our estimates using a triangulation method, where data is cross-checked from multiple reliable sources, like company data, primary interviews, and secondary research. This helps us make sure that our numbers are correct and fit with the rest of the market.
This process involves verifying data consistency across various segments and geographic areas. It also requires comparing historical trends with the assumptions support the forecast. Any discrepancies involve adjustments to ensure everything remains aligned and dependable.
Once the data is finalized, we prepare the final outputs, including market size estimates, segment-wise breakdowns, and growth metrics. These are delivered in structured formats such as tables, charts, and data files for easy analysis and use.
We collaborate closely with clients, ensuring the final products align with their requirements. This includes offering tailored adjustments, supplementary data analyses, and continuous assistance. Furthermore, we monitor market trends post-delivery, providing updates and refinements to maintain the insights' relevance as time passes.
Triangulation Framework
Estimates are cross-verified across three sources:
Company-level data
• Primary inputs from industry participants
• Secondary benchmarks and published data
Variance maintained within +5-10%
Adjustments applied to align estimates
Segment values validated against overall market structure
Data Consistency & Integrity
Segment totals validated to 100%
Regional estimates aligned with global market size
Historical trends compared against forecast outputs
Assumptions reviewed for cross-segment and regional alignment
Final Outputs
Deliverables
Client Alignment & Support
- Deliverables are aligned with defined client requirements and scope
- Custom data cuts and segment splits are incorporated as required
- Post-delivery queries are addressed through analyst interactions
- Additional clarifications and data support are provided upon request
Client Continuity & Updates
- Market developments are tracked post-delivery to capture changes in key trends
- Updated data and revisions are provided based on new market inputs
- Additional refinements and data cuts are shared as required
- Continued analyst engagement supports evolving client requirements
Download Sample Report of Smart Lighting Market
Please fill out the form to request a customized copy of the research report.
