
Stone Paper Market Size, Share Global Analysis Report, 2023-2032
REPORT DETAILS
REPORT DETAILS
ABOUT THIS REPORT
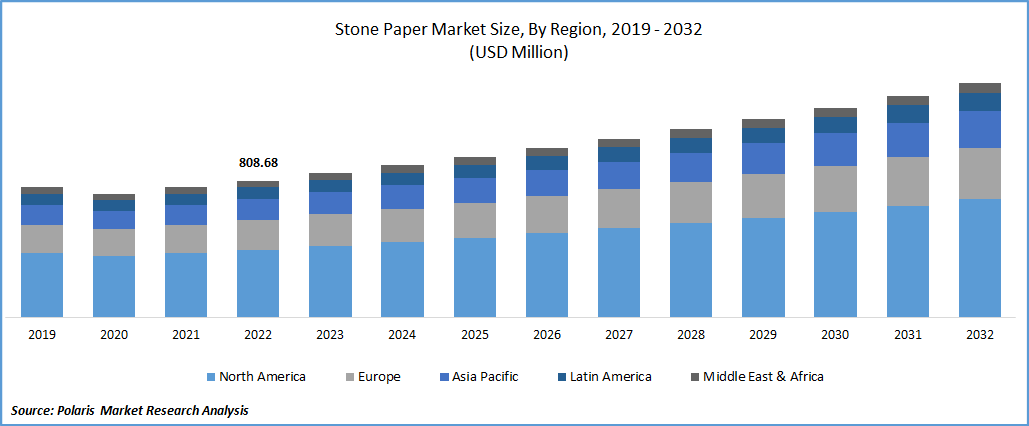
The global stone paper market was valued at USD 808.68 million in 2022 and is expected to grow at a CAGR of 5.5% during the forecast period. Growing demand and prevalence of the product owing to its eco-friendly, recycling, and waterproof properties, along with the increasing environmental concern towards deforestation to synthesize wood pulp effectively, are key factors expected to fuel the global market growth and demand in the forecast period. Additionally, the rapid increase in international trade due to extensively emerging e-commerce platforms fueling the demand for sustainable packaging products such as cardboard boxes and bags. The high focus of market players on developing products with more advanced features is also creating lucrative growth opportunities for the market.
To Understand More About this Research: Download Sample Report
For instance, in December 2021, Pebble Printing unveiled its first stone paper compatible with inkjet, manufactured using about 80% calcium carbonate and 20% high-density polyethylene. The new product is being developed with no trees or water, eliminating all poisonous chemicals and less energy consumed.
Stone paper is rapidly gaining momentum and traction in paper and packaging applications due to its unique composition that offers excellent water, oil, and tear resistance. Stone paper box pouches with attractive digital printing are also widely used to increase market awareness. Moreover, these products are largely preferred by various food companies due to their aesthetic and sustainable qualities and have found vast applications in the FMCG sector, stimulating the demand and pushing the market forward. Despite the growing demand for stone paper-based products globally, they are comparatively more expensive than other traditional papers available in the market, leading consumers to opt for other cheaper alternatives and hampering the market growth.
The outbreak of the COVID-19 pandemic has significantly impacted the growth of the stone paper market. The emergence of the lethal coronavirus across the globe has forced countries to impose several restrictions, including lockdowns, trade barriers, and regulations on mass movements, that resulted in the temporary closure of manufacturing facilities and high disruptions in the global supply chain. Due to this, stone paper production was negatively affected, and the market has seen a significant decline in demand and sales worldwide.
For Specific Research Requirements, Request For Customized Report
Industry Dynamics
Growth Drivers
The growing adoption of stone paper as an alternative to conventional form contributes to overcoming problems, including deforestation worldwide, due to its energy-saving and eco-friendly nature. Along with this, it further helps reduce carbon emissions more than traditional manufacturing processes, which are the major factors driving the global stone paper market growth over the study period. Furthermore, the increasing government support coupled with the economies of density and implementation of various types of stringent regulations of the emission of different kinds of greenhouse gases and the introduction of various innovative sources or materials is a few other factors likely to fuel the demand and growth of the market at a significant pace.
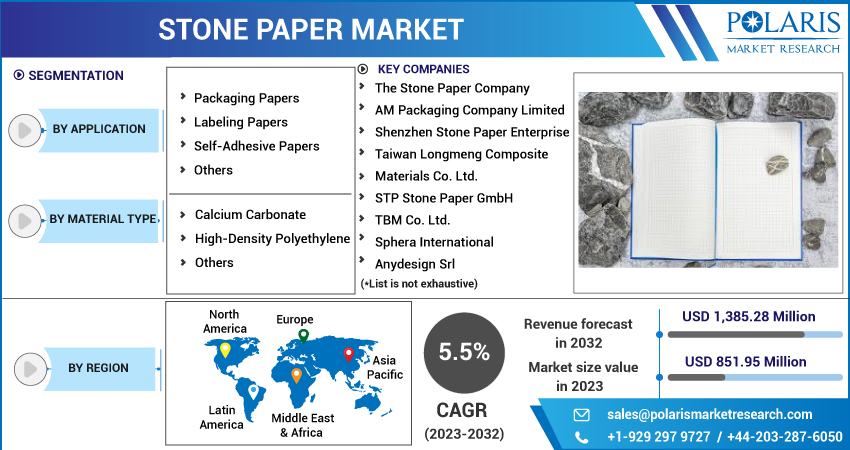
Report Segmentation
The market is primarily segmented based on application, material type, and region.
| By Application | By Material Type | By Region |
|
|
|
For Specific Research Requirements: Request for Customized Report
Labeling papers segment accounted for the largest market share during the forecast period
The labeling papers segment accounted for the largest market share and will likely retain its position throughout the forecast period. The growth of the segment market can be mainly attributed to its widespread use in various applications, including wrappers, colored notes, shelf tags, shelf signage, and sticky notes, because of its cost-effectiveness and better flexibility. Labeling paper includes product tags and labeling, multi-purpose notes, wine bottles, office uses, air-line luggage, door hangs, and identity hands, resulting in higher product demand worldwide.
Moreover, the growing penetration for labeling in the food & beverage packaging applications, as it provides complete information regarding the ingredients used and also offers a visual appeal to the product, to achieve product differentiation and gain consumer attention, many manufacturers across the globe are being implemented on labeling their brands, which in turn have paved the way for higher product demand and adoption in the forecast period.
However, the packaging papers segment is expected to grow fastest during the anticipated period, mainly driven by the rising need and prevalence to replace plastic with traditional packaging material. In addition, the rapidly surging use of recyclable stone paper containers across several industrial sectors will likely impact the segment market growth and demand positively.
High-density polyethylene segment is expected to grow fastest in upcoming years
The high-density polyethylene segment is expected to grow fastest over the projected period. The growing use of HDPE as a binder that provides the stone paper with a better foldable quality, which is similar to another traditional form, and increasing awareness regarding its ability to help in retaining the shape of stone paper because of the high density are among the major factors driving the growth of the segment market. Additionally, the wide range of benefits of using HDPE packaging, such as enhanced protection, highly adaptable, lightweight, excellent rigidity, and easily recyclable, further increase product application across several industries.
The calcium carbonate segment held the largest market share in 2022, which was highly accelerated by the abundant availability of the resource and the adoption of calcium carbonate as a key ingredient in stone paper production. It helps increase the brightness and opacity of stone paper and does not have any gain that allows for smoother writing, propelling the segment's demand and growth over the coming years.
Asia Pacific region dominated the global market in 2022
The Asia Pacific region dominated the global market with a healthy market share and is expected to maintain its dominance over the study period. The regional market growth can be largely attributed to rapid urbanization and continuously growing awareness regarding the regulation of the use of plastic and the implementation of sustainability. For example, the ban on plastic imports in China is creating significant growth opportunities for stone paper manufacturers and suppliers in the region.
In addition, the extensive rise in the demand for advanced packaging applications and the increase in the market and penetration of a variety of packaged food products in countries like India, China, South Korea, and Indonesia is further anticipated to boost the growth of the market.
The North American region is projected to emerge as the fastest growing region with a significant growth rate over the coming years on account of increasing research & development-related activities aimed at innovating sustainable products with several new and more advanced features and the robust presence of major manufacturers in the region.
Competitive Insight
Some of the major players operating in the global stone paper market include Stone Paper Company, AM Packaging Company, Shenzhen Stone Paper, Taiwan Longmeng Composite, STP Stone Paper, TBM Co., Sphera International, Anydesign, Guangzhou Myhome Wallpaper, Agood Company, Karst Stone Paper, WestRock Company, Parax Paper, & Stone Paper Italia.
Recent Developments
- In May 2025, TBM’s LIMEX Pellet was adopted by Vietnam’s BioTech for detergent refill pouches, reducing petroleum plastic use without raising costs.
- In May 2025, Shinto Tsushin and Shinryo Reihatsu launched LIMEX-based pipe-insulation exteriors offering higher strength and lower CO₂ emissions.
- In April 2025, TBM introduced GX Skills training linked to its ScopeX CO₂-tracking service, expanding sustainability solutions.
- In March 2025, Stora Enso’s Oulu packaging board line began ramp-up, boosting Europe’s renewable substrate supply.
- In February 2025, EU Packaging and Packaging Waste Regulation took effect, requiring full recyclability by 2030 and banning PFAS in food packaging from August 2026.
- In May 2024, Stone Paper Industries raised USD 10 million in a Series B funding round led by Sustainable Venture Capital to boost its production capacity and strengthen its global market expansion efforts.
- In February 2021, Siakal Enterprise announced the inauguration of its new production facility of unique stone paper. The total capacity of the new manufacturing facility is estimated at 9,000 tonnes, mainly based on Chinese Henan GX-Mach technology. The new stone paper is characterized by higher strength and better durability and is highly resistant to dirt and moisture.
- In November 2021, Naya introduced new mushroom packaging for better sustainability; the kit is completely biodegradable, recyclable, and compostable & it uses 100% recycled glass & labels made from stone paper. The new packaging product is developed with Mycelium Technology.
Stone Paper Market Report Scope
| Report Attributes | Details |
| Market size value in 2023 | USD 851.95 million |
| Revenue Forecast in 2032 | USD 1,385.28 million |
| CAGR | 5.5% from 2023– 2032 |
| Base year | 2022 |
| Historical data | 2019 – 2021 |
| Forecast period | 2023– 2032 |
| Quantitative units | Revenue in USD million and CAGR from 2023 to 2032 |
| Segments Covered | By Application, By Material Type, By Region |
| Regional scope | North America, Europe, Asia Pacific, Latin America; Middle East & Africa |
| Key Companies | The Stone Paper Company, AM Packaging Company Limited, Shenzhen Stone Paper Enterprise, Taiwan Longmeng Composite Materials Co. Ltd., STP Stone Paper GmbH, TBM Co. Ltd., Sphera International, Anydesign Srl, Guangzhou Myhome Wallpaper Co. Ltd., Agood Company, Karst Stone Paper, WestRock Company, Parax Paper, and Stone Paper Italia. |
FAQ's
The stone paper market report covering key segments are application, material type, and region.
Stone Paper Market Size Worth $1,385.28 Million By 2032.
The global stone paper market expected to grow at a CAGR of 5.5% during the forecast period.
Asia Pacific is leading the global market.
key driving factors in stone paper market are growing application in paper packaging.
Research Methodology
A robust system of research, verification, and forecasting designed to ensure reliable and actionable market insights.
Polaris Market Research & Consulting, Inc. uses a clear and structured approach to deliver insights that clients can rely on. The process combines detailed primary and secondary research, including direct communication with industry experts. The detailed information helps build a complete picture of market trends and developments. Secondary data is gathered from credible sources such as industry reports, company filings, government source links, and trusted organization databases. It is then cross-checked through discussions with key stakeholders across the value chain. Market size and forecasts are developed using both bottom-up and top-down methods to ensure accuracy and consistency in the final results.
1. Project Setup
Step 1 & 2:
- We start every project by clearly understanding the client’s objective or goal, then defining the market scope, and aligning regions, segments, and timelines.
- Once the foundation is set, we collect data from all-around of sources, including company reports, government databases, and paid industry platforms.
- Our research is based on secondary data, which helps us build a strong understanding of the market across regions and industries. Then we validate this information through primary research by speaking directly with industry experts, companies, and stakeholders.
- By combining secondary and primary research, we ensure that our market insights are accurate, practical, and closely aligned with real market conditions.
2. Data Collection
We gather information from both public and verified sources:
3. Data Structuring
Step 3:
- All collected data is organized into a consistent format to ensure accurate analysis. Since inputs come from multiple sources, they are standardized and aligned before use.
- The data is segmented by product, application, and region, and mapped across a defined historical period (2020–2024). All values are converted into common units (USD Mn/Bn), and volume and pricing are aligned where required to estimate revenue.
- Any overlaps or inconsistencies are reviewed and adjusted to maintain accuracy (<5% variance threshold).
- The result is a structured dataset that allows for clear comparison across regions and supports reliable analysis and forecasting.
Structured Market Dataset, USD Mn/Bn
| Region | Segment | VolumeUnits | Avg PriceUSD | RevenueUSD Mn | Share % |
|---|---|---|---|---|---|
| North America | Product A | 250 | 2.5 | 500 | 15% |
| Product A | XX | XX | XX | XX | |
| Product A | XX | XX | XX | XX | |
| Consistent methodology applied across regions | |||||
4. Market Estimation
Step 4: TOP-DOWN APPROACH
- We start with the overall market size at a global or macro level.
- The market is then narrowed down based on scope and industry relevance.
- We apply penetration rates and split the data by region and segment.
- This helps us estimate the market size for specific segments.
- The numbers are validated through cross-checks to ensure accuracy.
Step 5: BOTTOM-UP APPROACH
- We begin by analyzing data from leading companies in the market.
- Revenue data is collected and mapped across different segments.
- The data is then aggregated to estimate the total market size.
- To fill in any gaps, adjustments are made based on industry standards.
- Validation checks make sure that the results are correct.
5. Forecasting
Step 6:
At Polaris Market Research & Consulting, Inc., we employ a methodical forecasting strategy. This approach blends the analysis of historical data with real-time market validation. To forecast future trends with precision, we examine past patterns, pricing fluctuations, and the interplay of supply and demand. To ensure our conclusions reflect the present market landscape, we actively seek input from industry experts and key stakeholders.
To refine our predictions, we carefully consider critical elements such as market drivers and restraints, fluctuations in raw material costs, emerging technologies, and the production capabilities of various regions. Furthermore, we assess regulatory frameworks and potential policy shifts to gauge their potential impact on market expansion.
All this information is synthesized to generate precise forecasts for each segment and region. These forecasts illuminate the current state of the market and highlight forthcoming opportunities.
6. Validation & Triangulation
Step 7:
In the final stage, we validate all our estimates using a triangulation method, where data is cross-checked from multiple reliable sources, like company data, primary interviews, and secondary research. This helps us make sure that our numbers are correct and fit with the rest of the market.
This process involves verifying data consistency across various segments and geographic areas. It also requires comparing historical trends with the assumptions support the forecast. Any discrepancies involve adjustments to ensure everything remains aligned and dependable.
Once the data is finalized, we prepare the final outputs, including market size estimates, segment-wise breakdowns, and growth metrics. These are delivered in structured formats such as tables, charts, and data files for easy analysis and use.
We collaborate closely with clients, ensuring the final products align with their requirements. This includes offering tailored adjustments, supplementary data analyses, and continuous assistance. Furthermore, we monitor market trends post-delivery, providing updates and refinements to maintain the insights' relevance as time passes.
Triangulation Framework
Estimates are cross-verified across three sources:
Company-level data
• Primary inputs from industry participants
• Secondary benchmarks and published data
Variance maintained within +5-10%
Adjustments applied to align estimates
Segment values validated against overall market structure
Data Consistency & Integrity
Segment totals validated to 100%
Regional estimates aligned with global market size
Historical trends compared against forecast outputs
Assumptions reviewed for cross-segment and regional alignment
Final Outputs
Deliverables
Client Alignment & Support
- Deliverables are aligned with defined client requirements and scope
- Custom data cuts and segment splits are incorporated as required
- Post-delivery queries are addressed through analyst interactions
- Additional clarifications and data support are provided upon request
Client Continuity & Updates
- Market developments are tracked post-delivery to capture changes in key trends
- Updated data and revisions are provided based on new market inputs
- Additional refinements and data cuts are shared as required
- Continued analyst engagement supports evolving client requirements
Download Sample Report of Stone Paper Market
Please fill out the form to request a customized copy of the research report.
