
Calcium Carbonate Market Size & Share Global Analysis Report, 2026-2034
REPORT DETAILS
Calcium Carbonate Market Overview
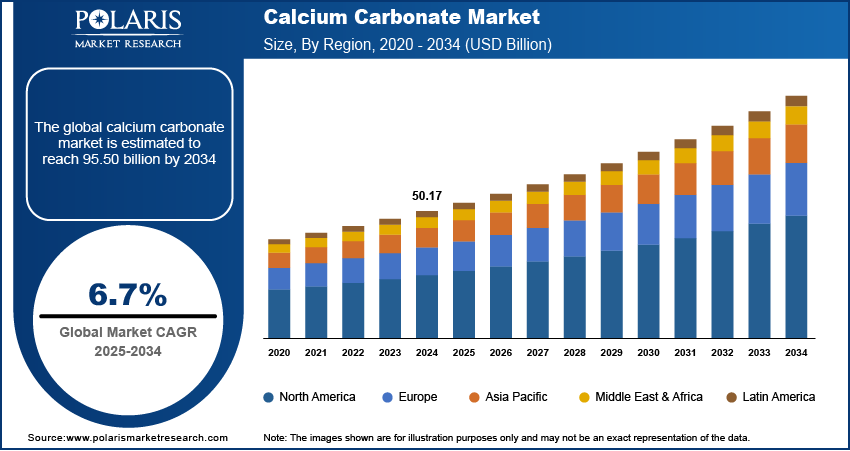
he global calcium carbonate market size was valued at USD 53.35 billion in 2025, growing at a CAGR of 6.8% from 2026 to 2034. Expanding construction activities, rising urbanization, and the desirable properties of calcium carbonate are the key factors driving market growth.
Market Statistics
Key Takeaways
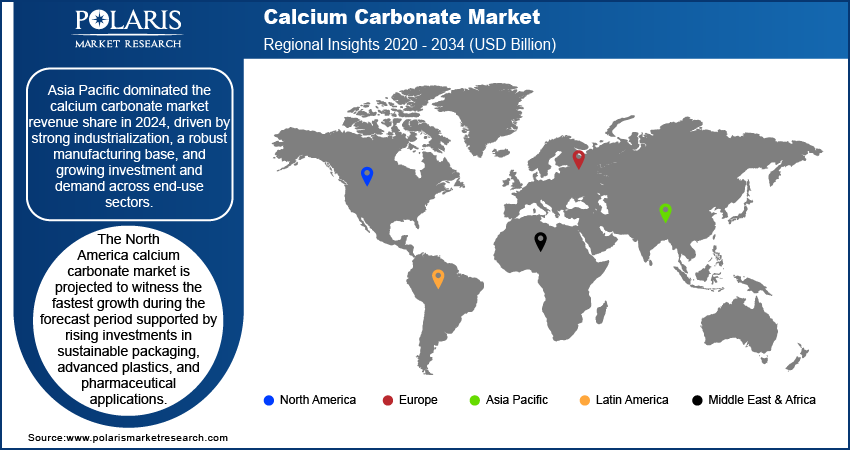
- Asia Pacific accounted for the largest market share of 52.45% in 2025. Rapid industrialization and a robust manufacturing base drive the region's leading market share.
- North America is projected to register the fastest growth of CAGR 5.6% during the projection period, driven by rising investments in pharmaceuticals and sustainable packaging.
- U.S. dominated in the North America region with 75.15% share in 2025.
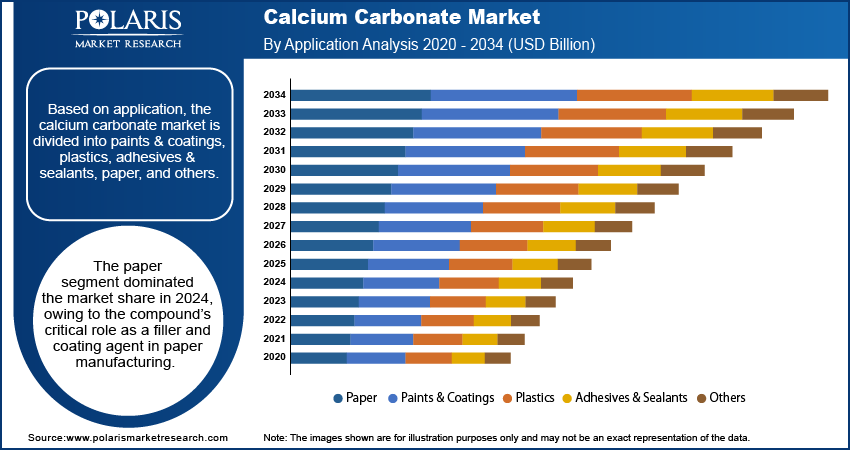
- The paper segment also held the highest market share of 33.21% in 2025, driven by strong demand for packaging, hygiene, and specialty papers. Additionally, calcium carbonate helped reduce paper costs while also enhancing performance.
- The precipitated calcium carbonate segment is expected to register the highest growth rate of CAGR 6.7%. Demand is rising for high-purity grades used in pharmaceuticals, advanced plastics, and specialty papers. The need for proper shape and adequate dispersion is significant.
Note: Figures and projections outlined in this report are the result of Polaris Market Research’s proprietary analytical processes, grounded in the latest available datasets and market observations.
Industry Dynamics
- Calcium carbonate in plastics is increasingly used in various plastics, such as polyethylene, polypropylene, and PVC, to enhance strength and stability and reduce resin costs.
- There is increasing use of sustainable calcium carbonate in biodegradable, marine-safe plastics to create environmentally friendly materials.
- The well-established role of calcium carbonate in the medical and pharmaceutical sectors is another factor contributing to market expansion.
- The shift towards sustainable, eco-friendly packaging is anticipated to create several market opportunities.
- Increasing cost due to high transportation charges may hinder market growth.
Calcium carbonate is a naturally occurring compound that is made up of calcium, carbon, and oxygen. It is widely used due to its varied chemical and physical properties. It has a growing demand due to increased construction activities in both developed and developing nations. In March 2025, there were as many as 1.549 million newly completed housing structures in America. In construction activities, calcium carbonate is an essential component of cement and concrete. It adds strength and smoothness.
Source: Polaris Market Research Analysis
The ongoing demand for infrastructure development, urbanization, and residential and commercial construction continues to increase the consumption of calcium carbonate. Additionally, its cost-effectiveness and compatibility with various construction composites make it a material of choice for manufacturers seeking both quality and economic efficiency.
The use of calcium carbonate is increasing as the paper industry continues to expand. Calcium carbonate serves as a critical filler and high performance pigment in paper manufacturing, enhancing paper brightness, opacity, and surface smoothness while also reducing production costs. The global demand for high-quality paper products, such as flexible packaging, printing paper, and cleaning & hygiene products, continues to rise, and the need for effective, economical raw materials, such as calcium carbonate, grows accordingly. As per the CAPEXIL's April 2025 report, India reported 12.5% year-on-year growth in paper production (i.e., 604,300 tons) in January 2023. Cumulative output for April 2022–January 2023 reached 5.55 million tons, marking a 6.7% increase compared to the same period in the previous year.
Calcium carbonate raises the level of quality of the paper by virtue of the brightness and smoothness the paper has after the calcium carbonate has been applied. At the same time, the print can improve with the application of calcium carbonate, which is a major factor embraced by the industry megatrend.
Difference Between: Calcium Carbonate vs Alternative Fillers
Calcium carbonate competes with alternative mineral fillers, such as talc, kaolin, and silica. They are used across plastics, paper, paints, coatings, rubber, and construction applications. Their selection depends on balancing cost, stiffness, thermal stability, surface finish, opacity, abrasion resistance, and processing performance. Calcium carbonate is preferred for its low cost and versatility. Alternative fillers are chosen for specialized performance requirements.
| Parameter | Calcium Carbonate | Talc | Kaolin | Silica |
| Relative Cost | Low | Medium | Medium | High |
| Main Advantage | Cost efficiency and versatility | High stiffness and heat resistance | Excellent brightness and surface smoothness | High hardness and reinforcement |
| Mechanical Performance | Moderate stiffness and good impact strength | Superior rigidity and dimensional stability | Moderate reinforcement with smooth finish | Excellent strength and abrasion resistance |
| Thermal Resistance | Moderate | High | Moderate–High | High |
| Surface Finish | Smooth with fine grades | Smooth and matte finish | Excellent smoothness and printability | Rougher finish in some applications |
| Processing Ease | Easy processing and dispersion | Good processability | Good dispersion properties | More difficult due to hardness |
| Abrasion Resistance | Moderate | Moderate | Low | Very high |
| Opacity/Brightness | High whiteness and opacity | Moderate | Excellent brightness | Moderate |
| Typical Applications | Plastics, paper, paints, PVC, adhesives | Automotive plastics, engineering polymers, packaging | Paper coatings, ceramics, paints, rubber | High-performance coatings, rubber, specialty plastics |
| Key Limitation | Lower heat resistance than talc or silica | Higher cost than calcium carbonate | Lower reinforcement capability | Higher processing cost an |
Source: Polaris Market Research Analysis
Market Dynamics
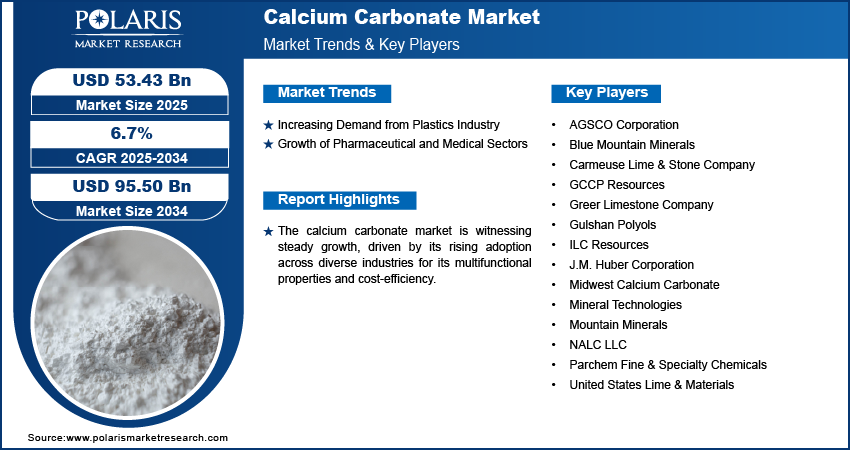
Increasing Demand from Plastics Industry
The plastics sector is driving market growth by enhancing the strength of plastics and facilitating greater efficiency. Calcium carbonate is added to polymers such as plastic, polypropylene, and PVC. With improvements in the rigidity, stability, and resistance of plastics, while also reducing production costs, the innovation is significant to the plastics sector. Due to the growing issue of plastic disposal, the use of alternatives, such as seashell-calcium carbonate-based plastics, is worthwhile and safe. These alternatives can also be biodegradable.
Growth of Pharmaceutical and Medical Sectors
Pharmaceutical and medical product development and growth are driving increased demand for calcium carbonate. This is due to calcium carbonate being a vital ingredient in several drug formulations. The use of the product is on the rise, and one reason is the need for stability in pharmaceutical products. It is essential for ensuring stability and smooth delivery of drugs. In addition, medical devices and oral hygiene preparations use calcium carbonate, making them essential products.
Source: Polaris Market Research Analysis
Segment Insights
Market Assessment by Application
The global market segmentation, based on application, includes paints & coatings, plastics, adhesives & sealants, paper, and others. The paper segment accounted for the largest share of the 33.21% in 2025, owing to the compound’s critical role as a filler and coating agent in paper manufacturing. Calcium carbonate acts as an agglomerator to increase paper brightness and smoothness, while providing cost benefits by extending upper-value pulp. It is imperative that calcium carbonate be used to manufacture printing and writing paper, as well as packaging paper, due to its widespread use in papermaking. For instance, paper demand continues to drive this segment's strength, especially in packaging-grade paper, driven by its quality and light weight. Furthermore, calcium carbonate's role in ink control underscores its importance in modern paper manufacture.
Market Evaluation by Product Type
The global market segmentation, based on product type, includes ground calcium carbonate and precipitated calcium carbonate. The precipitated calcium carbonate segment is expected to witness the fastest growth of CAGR 6.7% during the forecast period due to its superior properties and tailored functionalities. Ground calcium carbonate vs precipitated calcium carbonate products differ in their processing or production characteristics. While ground calcium carbonate involves mechanical treatment of limestone, precipitated calcium carbonate is manufactured with precise control over shape and size. As demand for customer-performance characteristics increases for fillers, PCC market growth will outpace that of traditional calcium carbonates.
Comparison Matrix: Ground Calcium Carbonate (GCC) vs Precipitated Calcium Carbonate (PCC)
| Parameter | Ground Calcium Carbonate (GCC) | Precipitated Calcium Carbonate (PCC) |
| Production Method | Mechanical grinding of natural limestone or marble | Chemical precipitation process using lime and carbon dioxide |
| Relative Cost | Lower | Higher |
| Purity | Typically 94–99% CaCO₃ | Usually 99–99.5%+ CaCO₃ |
| Particle Size | Coarser and broader distribution | Ultra-fine and highly controlled |
| Particle Shape | Irregular and angular | Uniform and engineered |
| Brightness & Opacity | Good brightness and opacity | Superior brightness and opacity |
| Surface Area | Lower | Higher |
| Processability | Excellent for bulk processing | Better for specialty formulations |
| Reinforcement Performance | Moderate | Higher reinforcement and dispersion properties |
| Main Advantage | Cost efficiency and wide availability | High purity and tailored performance |
| Common Applications | Plastics, paints, rubber, paper filler, and construction materials | Premium paper coating, pharmaceuticals, food, specialty plastics, and high-end coatings |
| Key Limitation | Lower purity and less particle control | Higher production and processing cost |
Source: Polaris Market Research Analysis
Source: Polaris Market Research Analysis
Regional Analysis
By region, the report provides insights into the calcium carbonate market in North America, Europe, Asia Pacific, Latin America, and the Middle East & Africa. Asia Pacific accounted for the largest share of 53.45% in 2025. Asia Pacific calcium carbonate market benefits from strong growth driven by infrastructure development, rising paper and plastic manufacturing, and the availability of limestone reserves. The Chinese and Indian economies have major consumption and export figures, supported by favorable mining policies and low labor costs. Asia Pacific high demand for the product continues to strengthen its position in the regional calcium carbonate market analysis.
The North America market is projected to witness the fastest growth of CAGR 5.6% during the forecast period, supported by rising investments in sustainable packaging, advanced plastics, and pharmaceutical applications. North American innovation using high-performance materials is driving demand for both ground calcium carbonate and precipitated calcium carbonate. In 2022, Imerys increased production at its Sylacauga, AL, site to meet demand and improve reliability. The growth in infrastructure projects and the rejuvenation of domestic manufacturing have also boosted consumption in the construction and industrial sectors. On the other hand, the trend toward green, fast-moving materials encourages companies to choose calcium carbonate as an environmentally friendly substitute that meets regulatory and environmental standards.
Source: Polaris Market Research Analysis
Key Players and Competitive Analysis Report
Large companies are entering the global calcium carbonate market with relatively strong positions, such as Omya AG, Imerys, and Mississippi Lime Company, which have consolidated through strong regional presence and integrated operations. In terms of growth rate, precipitated calcium carbonate outpaces ground calcium carbonate as a result of new developments in the processing of ultra-fine particles and advanced surface treatments. The largest consumer market is Asia Pacific, driven by significant infrastructure expansion in countries such as India and Southeast Asia. Paper and packaging are the major revenue segments. However, the growth rate is currently the highest in the construction and plastics segments. The growth rate is dependent on factors such as carbon neutrality. While smaller players are focusing on premiumization by creating specialty products, the major differentiators are carbon capture campaigns. A few key major players are Blue Mountain Minerals, GCCP Resources, Greer Limestone Company, ILC Resources, J.M. Huber Corporation, Midwest Calcium Carbonate, Mineral Technologies, Mountain Minerals, Parchem Fine & Specialty Chemicals, United States Lime & Materials, NALC LLC, Gulshan Polyols, AGSCO Corporation, and Carmeuse Lime & Stone Company.
The players in the calcium carbonate market are engaged in a race to specialize and stand out by focusing on sustainability and innovation. Similarly, the smaller players are competing with each other by focusing on markets where industry trends are likely to change.
Blue Mountain Minerals, headquartered in Columbia, California, is a long-established company specializing in the mining and processing of limestone and dolomitic limestone. The company provides finely ground limestone and other limestone-based materials to Northern and Central California. The company’s use of California's limestone supports the development of the region's agricultural production, such as almonds. The company’s calcium carbonate production helps stabilize soil pH and retain moisture for the cultivation of vital crops. The product also provides the necessary calcium for livestock development in the region. It also finds application in the manufacturing of glass, animal feed, and building materials, among other uses. Additionally, the company’s limestone product is used as a mitigating measure to reduce acid emissions during the energy production cycle. The company stands out for its focus on sustainability, including water recycling and the elimination of greenhouse gas emissions.
J.M. Huber Corporation is a family-owned America company that operates in engineered materials, natural resources, and specialty chemicals. They have a division, Huber Engineered Materials, that produces high-purity calcium carbonates to serve industries such as health and nutrition, pharmaceuticals, food manufacturing, and construction, as well as industrial markets. Their leading product is HuberCal calcium carbonate that originates from a pure and natural element known as limestone and exists as a granular or powdered compound that can serve to manufacture animal and human dietary supplements, fortify foodstuffs, manufacture antacids, and pharmaceutical pills. Their ISO-certified facilities, located in Quincy, Illinois, and Modesto, California, provide top-quality HuberCal that meets quality control and cGMP requirements. It has gained popularity for its purity and variability and serves as an important alternative to low-quality, expensive precipitated calcium carbonates. Moreover, it serves as an essential component in meeting the growing health and nutritional demands of consumers worldwide.
List of Key Companies
- AGSCO Corporation
- Blue Mountain Minerals
- Carmeuse Lime & Stone Company
- GCCP Resources
- Greer Limestone Company
- Gulshan Polyols
- ILC Resources
- J.M. Huber Corporation
- Midwest Calcium Carbonate
- Mineral Technologies
- Mountain Minerals
- NALC LLC
- Parchem Fine & Specialty Chemicals
- United States Lime & Materials
Calcium Carbonate Industry Developments
In September 2025, Carmeuse Group announced the successful acquisition of a controlling interest in Cementos Bío Bío S.A. The company stated that the acquisition will significantly enhance its footprint in the lime and cement industry. (Source: carmeuse.com)
In May 2025, MIDROC Investment Group opened Ethiopia’s first coated calcium carbonate plant in Awash 7 Kilo, producing materials for plastics, pipes, pharmaceuticals, footwear, sponges, and cables. (Source: fanamc.com)
Calcium Carbonate Market Segmentation
By Product Type Outlook (Revenue, USD Billion, 2021–2034)
- Ground Calcium Carbonate
- Precipitated Calcium Carbonate
By Application Outlook (Revenue, USD Billion, 2021–2034)
- Paper
- Paints & Coatings
- Plastics
- Adhesives & Sealants
- Others
By Regional Outlook (Revenue, USD Billion, 2021–2034)
- North America
- US
- Canada
- Europe
- Germany
- France
- UK
- Italy
- Spain
- Netherlands
- Russia
- Rest of Europe
- Asia Pacific
- China
- Japan
- India
- Malaysia
- South Korea
- Indonesia
- Australia
- Rest of Asia Pacific
- Middle East & Africa
- Saudi Arabia
- UAE
- Israel
- South Africa
- Rest of Middle East & Africa
- Latin America
- Mexico
- Brazil
- Argentina
- Rest of Latin America
Calcium Carbonate Market Report Scope
| Report Attributes | Details |
| Market Size in 2025 | USD 53.35 Billion |
| Market Size in 2026 | USD 56.85 Billion |
| Revenue Forecast by 2034 | USD 96.20 Billion |
| CAGR | 6.8% from 2026 to 2034 |
| Base Year | 2025 |
| Historical Data | 2021–2024 |
| Forecast Period | 2026–2034 |
| Quantitative Units | Revenue in USD billion, 2021–2034, and CAGR from 2026 to 2034 |
| Report Coverage | Revenue Forecast, Market Competitive Landscape, Growth Factors, and Trends |
| Segments Covered |
|
| Regional Scope |
|
| Competitive Landscape |
|
| Report Format |
|
| Customization | Report customization as per your requirements with respect to countries, regions, and segmentation. |
Source: Polaris Market Research Analysis
FAQ's
The global calcium carbonate market was valued at USD 53.35 billion in 2025 and is projected to reach USD 96.20 billion by 2034, growing at a steady CAGR of 6.8%.
Ground calcium carbonate (GCC) leads the market due to its cost-effectiveness, natural abundance, and broad use across the paper, plastics, construction, and coatings industries.
Demand is primarily driven by the paper, plastics, construction, paints & coatings, and automotive sectors. The paper industry remains the largest consumer, where calcium carbonate improves brightness, opacity, and smoothness, and helps reduce production costs.
Asia Pacific holds the largest market share of 52.45%, supported by rapid industrialization, a strong manufacturing base, and abundant limestone reserves. North America is expected to grow fastest, driven by investments in high-purity applications such as pharmaceuticals and sustainable packaging.
Growth is fueled by cost-effectiveness, eco-friendly properties, versatile filler applications, the expansion of the construction industry, and the rising adoption of nano-calcium carbonate in advanced plastics, paints, and coatings.
Download Sample Report of calcium carbonate market
Please fill out the form to request a customized copy of the research report.
