
Packaged Food Market Size, Share, Trends, Industry Analysis Report, 2025 - 2034
REPORT DETAILS
Packaged Food Market Summary
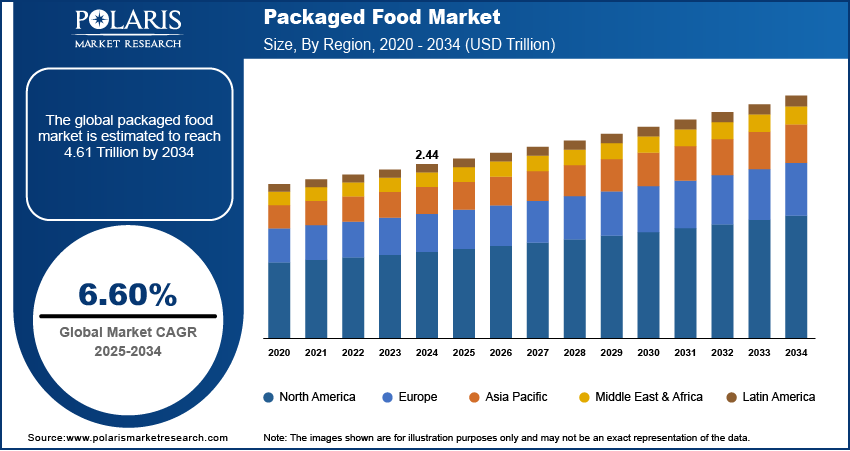
The global packaged food market size was valued at USD 2.44 trillion in 2024. The market is projected to grow at a CAGR of 6.60% during 2025 to 2034. Key factors driving demand for packaged foods include urbanization, improvements in food packaging technology, and the growth of e-commerce.
Market Statistics
Key Takeaways
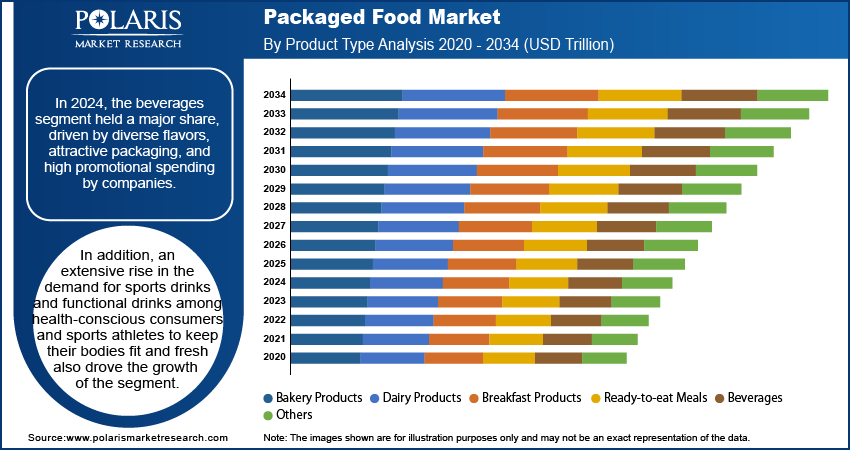
- The beverages segment accounted for the largest revenue share in 2024. This growth is attributed to the wide range of flavors, attractive packaging, and high expenditure on promotion.
- The online distribution channel segment is projected to register the fastest growth at a significant CAGR due to the rising penetration of the internet and rapid growth in the number of mobile phone users across the globe.
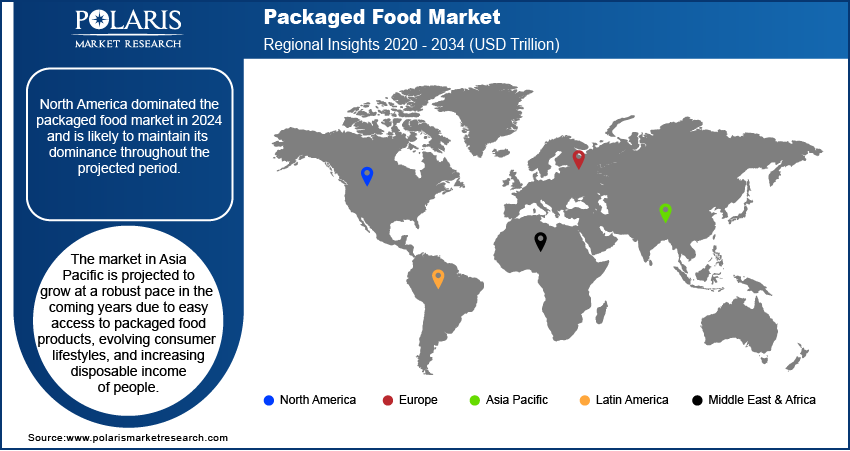
- North America dominated the packaged food market in 2024. This growth is attributed to the rising penetration of hectic lifestyles and high consumer spending power.
- The market in the Asia Pacific is projected to grow at a rapid pace in the coming years, owing to easy access to packaged food products and evolving consumer lifestyles.
Industry Dynamics
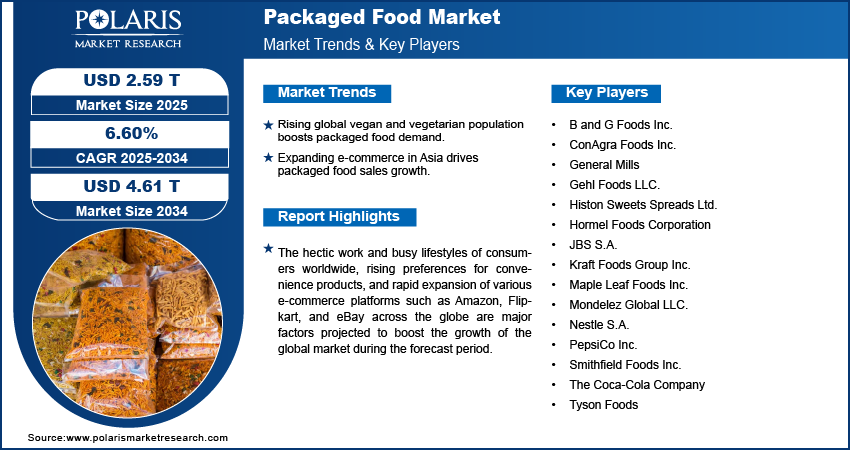
- The global packaged food market is fueled by a rapid rise in the number of vegans and vegetarians across the globe
- The growth in e-commerce across countries such as China, Japan, and India is also anticipated to increase demand for Packaged Food.
- Growing disposable income, especially in emerging countries such as India, is creating a lucrative market opportunity.
- Stringent government regulation may hamper the market growth.
The hectic work and busy lifestyles of consumers worldwide, rising preferences for convenience products, and rapid expansion of various e-commerce platforms such as Amazon, Flipkart, and eBay across the globe are major factors projected to boost the growth of the global market during the forecast period.
Source: Polaris Market Research Analysis
To Understand More About this Research: Download Sample Report
Growing innovations in food packaging, healthy ingredients, bold flavors, and plant-based products by several large market companies have contributed significantly to the growth of the market. For instance, in November 2022, Fresh Cravings announced the expansion of its dips collection at Publix stores. The company has introduced Jalapeno Popper and French Onion Plant-Based Dips into its existing dips collection. The new product comes with gluten and preservative-free products, which join the cravings family of hummus, refrigerated salsas, and Queso Plant-Based Dip.
Source: Polaris Market Research Analysis
Industry Dynamics
Growth Drivers
Extensive growth in the demand for plant-based food products owing to a rapid rise in the number of vegans and vegetarians across the globe is a major factor expected to drive the growth and adoption of packaged food over the projected period. For instance, according to a done by Vegetarian Times, nearly 9.7 million Americans are vegetarians or follow a vegetarian diet, and about 1 million of those are vegan. Moreover, sales of plant-based food grew by 27% with a market value of USD 7 billion.
The increasing efforts by key market players such as Nestle, The Coca-Cola Company, and Tyson Foods on the improvement of quality, better packaging, and lowering costs coupled with the availability of high technological advancements, especially in developed countries like US, Canada, France, and Germany are further likely to fuel the growth of the global market in the coming years.
What is the Regulatory Impact on the Packaging Preferences in Packaged Food Market?
The global industry is witnessing a rising imposition of the regulations on packaging food items and materials. Therefore, it has become mandatory for players to adhere to these regulation to stay ahead in the competition. Europe and the UK have the most stringent regulatory and sustainability norms. Also, the U.S. has state-level variation. It requires flexible packaging strategies for multi-state distribution. In Asia Pacific, India and China are tightening rules and presenting lucrative opportunities for eco-packaging startups. Mandatory EPR, food safety compliance, and plastic use bans are a few common drivers accelerating innovation in packaging. The following table provides packaging regulations heatmap.
| Region/Country | Regulations | Restrictions | Food Safety and Migration Standards | Sustainability/ESG Requirements | Labeling and Transparency | Trends |
| European Union | SUPD (Single-Use Plastics Directive), Packaging & Packaging Waste Directive | Ban on products made from certain single-use plastics, mandates for recyclable packaging | EFSA compliance for migration of chemicals | EPR for all packaging, carbon footprint reporting encouraged | Front-of-Pack (FoP) nutrition labeling, allergen labelling requirement | High requirement for biodegradable, reusable, mono-material packaging |
| U.S. | FDA Food Contact Regulations, state-level plastic bans | Varies as per state (CA, NY), voluntary recycling targets | BPA-free, food-grade plastics, migration limits | Voluntary, some state incentives | Nutrition Facts Panel, allergen labeling | Patchwork regulation, companies often comply at national and state level |
| India | FSSAI Packaging Regulations, Plastic Waste Management Rules (PWM) | Ban on products made of certain single-use plastics; mandatory EPR compliance | Food-grade, nontoxic, safe inks/adhesives | EPR for brand owners, recycling and collection targets | FoP nutrition labeling (Health Star Rating), allergen disclosure | Fines for non-compliance; shift toward eco-friendly packaging |
| China | GB/T packaging standards, SAMR Food Safety Laws | Restrictions on non-recyclable materials for imports | Migration limits for food contact materials | Encouragement for recyclable packaging, green credits | Labeling in Chinese language, allergen info | Importers must adhere to local standards; rising adoption of biodegradable materials |
| UK | Packaging Waste Regulations, Plastic Packaging Tax | Tax on plastic with certain recycled content | Food-grade compliance (similar to EU standards) | Mandatory reporting for EPR & recycled content | FoP nutrition labeling, allergens labeling | Focus on reducing virgin plastic use, incentives for recycled materials |
Source: Polaris Market Research Analysis
Report Segmentation
The market is primarily segmented based on product type, distribution channel, packaging type, and region.
| By Product Type | By Distribution Channel | By Packaging Type | By Region |
|
|
|
|
Source: Polaris Market Research Analysis
Know more about this report: Download Sample Report
Beverages Segment Accounted for the Largest Market Share in 2024
The beverages segment accounted for a major market share in 2024. This is attributed to the the availability of a wide range of flavors, attractive packaging, and high expenditure on the promotion of these products to gain consumer traction through various companies. In addition, an extensive rise in the demand for sports drinks and functional drinks among health-conscious consumers and sports athletes to keep their bodies fit and fresh also drove the growth of the segment.
The ready-to-eat meals segment is expected to grow at the fastest CAGR over the study period. Consumers from various developed and even developing nations are extremely shifting towards ready meals owing to their busy life schedules and adopting them as a convenient alternative for dual-earning households. The growing employment rate, especially in emerging countries such as India and Vietnam is leading the segment growth. Moreover, the increasing development of supermarkets in these emerging countries are also driving the segment growth.
Source: Polaris Market Research Analysis
Online Segment is Expected to Witness the Fastest Growth
The supermarket/hypermarket segment dominated the market in 2024 and is projected to maintain its dominance throughout the forecast period. A large number of global consumers prefer to buy groceries from supermarkets. This is due to the shopping experience offered by these stores and the option for verifying a product physically along with expert assistance.
The online distribution channel segment is projected to register the fastest growth at a significant CAGR in the coming years. This is attributed due to the rising penetration of the internet and rapid growth in the number of mobile phone users across the globe. In addition, the emergence of various online shopping platforms and the benefits they are offering to their consumers such as a wide range of products in one place, don’t need to bargain, the availability of almost every brand, and free home delivery services attracted consumers to buy their products through these online channels. This contributed to the dominance of the segment.
Plastic Packaging Segment Held the Largest Market Revenue Share in 2024
The dominance of the segment is majorly driven by several benefits offered to distributors, retailers, and consumers such as lightweight, easy availability, and lower emissions with cost-effectiveness. Moreover, plastic packaging can easily withstand harsh conditions and does not disintegrate rapidly and quickly in both cold and cold climates, and retain the freshness of beverages and food products inside. This has resulted in higher adoption of these packaging materials at a high rate in recent years worldwide. For instance, in May 2022, Amcor PLC announced the development of its latest technology, PowerPostTM, which is projected to deliver a bottle up to 30% lighter and made from 100% recyclable material. This is mainly developed for hot-fill beverages and to avoid spills from overflow.
The Demand in Asia Pacific is Expected to Witness Significant Growth
North America dominated the packaged food market in 2024 and is likely to maintain its dominance throughout the projected period. The growth of the regional market can be attributed to the rising penetration of hectic lifestyles, high consumer spending power, and the introduction of various new and attractive food products by key market companies, especially in countries such as the United States and Canada. In addition, packaged foods provide lots of choices for consumers to choose from, which eliminated the risk of food tampering, reduced spoilages of foods, and provided many other advantages that paved the way for higher adoption of these products in the region.
The market in Asia Pacific is projected to grow at a robust pace in the coming years due to easy access to packaged food products, evolving consumer lifestyles, and increasing disposable income of people. Moreover, an extensive rise in the urban population and the rising prevalence of various online shopping platforms in countries like India, China, and Indonesia are further expected to fuel the growth and demand for packaged food over the coming years. For instance, in 2021, India’s urban population was 493,169,259 with a significant increase of 2.32% from 2020. By 2030, the total Indian population living in urban areas is likely to reach over 600 million nearly 40% of the country’s population.
Source: Polaris Market Research Analysis
Competitive Insight
Key players in the market include
- Nestle
- Kraft Foods
- General Mills
- ConAgra Foods
- Hormel Foods
- Andros Foods
- Histon Sweets
- Gehl Foods
- B & G Foods
- Smithfield Foods
- PepsiCo
- Coca-Cola Company
- Mondelez.
Recent Developments
- January 2026: Foodberry partnered with U.S.-based BelGroup to co-develop innovative fruit-based snack products tailored for American consumers, aiming to expand healthier, on-the-go snacking options across the U.S. market.
- In May 2024: Walmart launched its new store-label food brand, Bettergoods, offering a wide range of products including frozen foods, dairy, snacks, beverages, pastas, soups, coffee, and chocolate.
- In May 2024: Aldi introduced a fully recyclable wrap for two of its own-label butter products, becoming the first UK supermarket to adopt this sustainable packaging solution.
Packaged Food Market Report Scope
| Report Attributes | Details |
| Market size value in 2024 | USD 2.44 trillion |
| Market size value in 2025 | USD 2.59 trillion |
| Revenue forecast in 2034 | USD 4.61 trillion |
| CAGR | 6.60% from 2025 – 2034 |
| Base year | 2024 |
| Historical data | 2020 – 2023 |
| Forecast period | 2025– 2034 |
| Quantitative units | Revenue in USD trillion and CAGR from 2025 to 2034 |
| Segments covered |
|
| Regional scope |
|
| Key companies | Nestle S.A., Kraft Foods Group Inc., General Mills, Tyson Foods, ConAgra Foods Inc., Hormel Foods Corporation, Andros Foods, Histon Sweets Spreads Ltd., Gehl Foods LLC., B, and G Foods Inc., Maple Leaf Foods Inc., Smithfield Foods Inc., JBS S.A., PepsiCo Inc., The Coca-Cola Company, and Mondelez Global LLC. |
Source: Polaris Market Research Analysis
FAQ's
• The global market size was valued at USD 2.44 trillion in 2024 and is projected to grow to USD 4.61 trillion by 2034.
• The global market is projected to register a CAGR of 6.60% during the forecast period.
• North America dominated the market in 2024.
• A few of the key players in the market include Nestle S.A., Kraft Foods Group Inc., General Mills, Tyson Foods, ConAgra Foods Inc., Hormel Foods Corporation, Andros Foods, Histon Sweets Spreads Ltd., Gehl Foods LLC., B, and G Foods Inc., Maple Leaf Foods Inc., Smithfield Foods Inc., JBS S.A., PepsiCo Inc., The Coca-Cola Company, and Mondelez Global LLC.
• The beverages segment dominated the market revenue share in 2024.
Download Sample Report of Packaged Food Market
Please fill out the form to request a customized copy of the research report.
