
Australia Bubble Tea Market Growth, Industry Report 2024-2032
REPORT DETAILS
REPORT DETAILS
Market Statistics
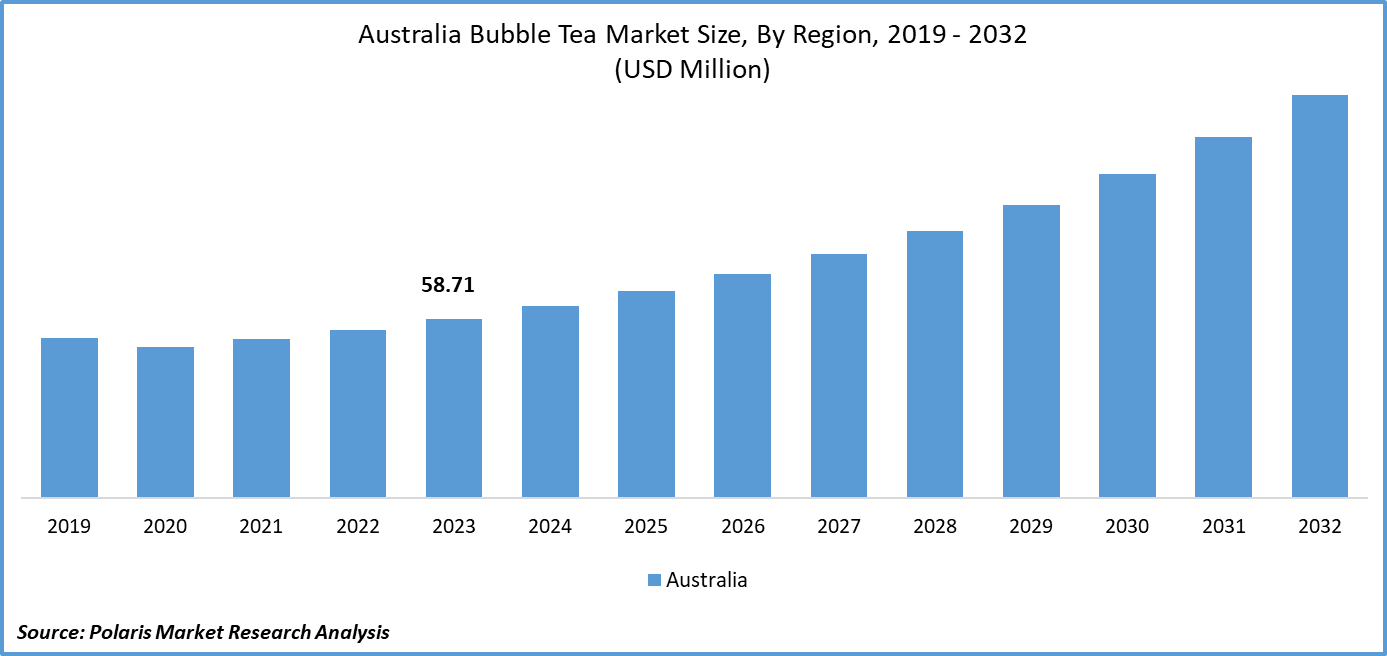
The australia bubble tea market size was valued at USD 58.71 million in 2023. The market is anticipated to grow from USD 62.90 million in 2024 to USD 131.99 million by 2032, exhibiting the CAGR of 9.7% during the forecast period
Australia Bubble Tea Market Overview
The increasing demand for tea and coffee-based drinks, particularly as nootropic drinks among young consumers, is a key factor driving the Australia bubble tea market growth. This demand is further fueled by the availability of a wide range of flavors tailored to changing consumer preferences. Bubble tea is favored for being a low-calorie, zero-fat beverage. Created in Taiwan in the 1980s, it was introduced to the United States in the 1990s. Since then, bubble tea has gained popularity in various local markets across the country due to its diverse flavors and appealing tastes.
For instance, in June 2023, Chaffic, an Australian company in the bubble tea industry, expanded its operations to Singapore by opening its inaugural store in the country. This step was taken to expedite their expansion plans in Southeast Asia.
To Understand More About this Research: Download Sample Report
Moreover, with an increasing awareness of the impact of diet on health, many consumers in Australia are opting for beverages with lower calorie, fat, and sugar content. Bubble tea, known for its frothy texture, fits this trend. This cold beverage includes chewy tapioca balls and is also referred to as Boba juice, Boba tea, or bubble milk tea in different regions of the country.
However, the presence of a democratized food culture in the country has led to the introduction of various cuisines, recipes, and beverages from diverse nations and cultures into the local market. Tapioca pearls, being gluten-free and considered a healthy dietary option, are favored by health-conscious consumers, who increasingly choose bubble tea as their beverage of choice. In recent years, a significant number of consumers have shifted their preferences from carbonated drinks to tea or coffee, driven by a growing awareness of health, fitness routines, and mindfulness about their diets and food choices.
Australia Bubble Tea Market Dynamics
Market Drivers
Rising Partnerships to Gain Market and Consumer Insights
Partnerships and collaborations play a crucial role in shaping the landscape of the Australian bubble tea market development. While mergers and acquisitions are less prevalent, businesses are actively engaging in partnerships to drive growth and innovation. These collaborations often involve the sharing of technology and resources, enabling companies to develop new products and improve existing ones. By working together, companies can also tap into each other's strengths and expertise, leading to more innovative and competitive offerings in the Australia bubble tea market opportunity.
Furthermore, these strategic initiatives are instrumental in enhancing the distribution network of bubble tea products. By collaborating with other businesses, companies can leverage their partners' existing networks and infrastructure to reach a wider audience. This is particularly important for offline channels, where having a strong distribution network is key to success.
Growing Demand for Exotic and Unique Flavours
The Australian bubble tea market growth is experiencing a surge in demand for unique and exotic flavors. Consumers are actively seeking out new and exciting beverage options, leading to a growing interest in bubble tea and its diverse range of flavors and textures. This trend is further fueled by the health-conscious movement among consumers, who are increasingly interested in healthier bubble tea options, such as sugar-free or low-calorie versions. Moreover, the influence of social media, food bloggers, and influencers has played a significant role in popularizing bubble tea and driving the Australia bubble tea market demand.
Market Restraints
Alternative Drinks Are Likely to Impede the Market Growth
The bubble tea market in Australia is confronted with a moderate threat from substitute products. This is particularly influenced by the preferences of the younger and working populations, who often seek out beverages that are not unique but also align with their taste preferences. This trend indicates a potential shift towards alternative beverage options, which could pose a challenge for the Australia bubble tea market expansion. However, the market has responded proactively by continuously innovating and introducing new flavors to cater to changing consumer demands.
Report Segmentation
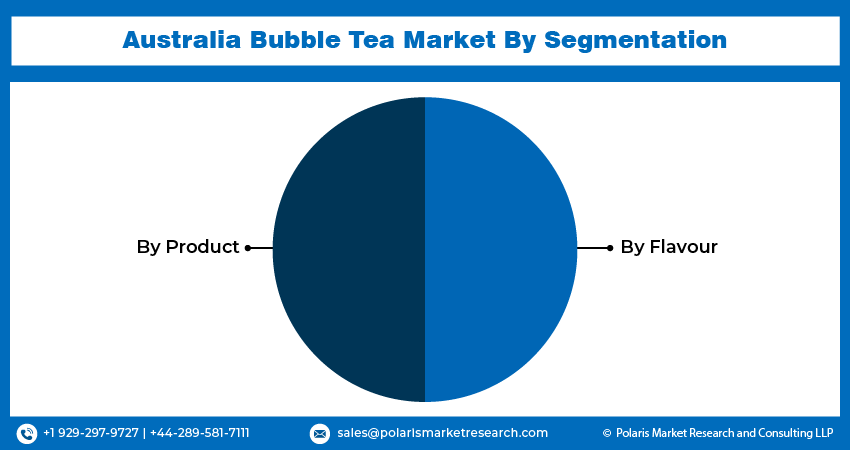
The market is primarily segmented based on product and flavor.
| By Product | By Flavour |
|
|
To Understand the Scope of this Report: Request Customization
Australia Bubble Tea Market Segmental Analysis
By Product Analysis
- The green tea segment is projected to grow at fastest CAGR during the Australia bubble tea market forecast period. The anticipated growth of the market can be attributed to the increasing popularity of green tea flavor, which blends easily with milk. Many consumers favor this flavor as a base ingredient due to its numerous benefits, including being an excellent source of antioxidants and having low sugar content. Green tea's ability to blend well with milk makes it a versatile and appealing choice for a wide range of consumers, contributing to its growing popularity in the market.
- The black tea segment led the industry market with a substantial revenue share in 2023. This particular type of bubble tea is highly popular in the market due to its natural and authentic flavor. It is known to help reduce blood glucose levels and bad cholesterol while improving gut health. Additionally, it is valued for being a rich source of antioxidants. These qualities contribute to the increasing demand for bubble tea in the country. Made from black tea, tapioca pearls, syrups, and milk, the classic Taiwanese bubble tea is a staple in many bubble tea shops and cafes. Its robust flavor and solid taste help maintain the authenticity of the drink, even when mixed with other ingredients. This is why many cafes offer black tea alternatives on their menus.
By Flavour Analysis
- The fruit segment accounted for the largest market share in 2023 and is likely to retain its position throughout the Australia bubble tea market forecast period. The main reason for the rise in popularity of fruit flavors in bubble tea is the variety they offer. Fruit flavors are well-liked because they provide both diversity and nourishment. Due to the various vitamins and minerals these drinks contain, health-conscious consumers are more likely to purchase them often. Because fruit-flavored bubble teas have less caffeine, many consumers naturally gravitate toward them. Fruit tastes like pineapple, grape, coconut, kiwi, lychee, lemon, green apple, and passion fruit are frequently utilized in bubble tea variations.
- The taro segment is expected to grow at the fastest growth rate over the coming years. Taro, a root vegetable known for its sweet flavor and starchy content, has become increasingly popular in the Australian bubble tea market, particularly in taro tea. This beverage has garnered attention for its sweet taste and the unique purple color it imparts. Makers and cafes are embracing taro as an ingredient primarily for its ability to add a vibrant purple hue to the drink, enhancing its visual appeal. The sweet and distinctive flavor of taro, coupled with its visually striking appearance, has contributed to its widespread popularity and adoption in the Australian beverage scene.
Competitive Landscape
The Australia Bubble Tea market development is fragmented and is anticipated to witness competition due to several players' presence. Major service providers in the market are constantly upgrading their technologies to stay ahead of the competition and to ensure efficiency, integrity, and safety. These players focus on partnership, product upgrades, and collaboration to gain a competitive edge over their peers and capture a significant market share.
Some of the major players operating in the global market include:
- BubbleTea Australia
- Chaffic
- Chatime
- Gong Cha
- Palgong
- ShareTea
- T BUN International
- Ten Ren Tea Co. Ltd
- UTOPIA
- Xing Fu Tang
Recent Developments
- In January 2025, Myprotein partnered with premium bubble tea brand CUPP to introduce three high-protein milk- and fruit-infused bubble tea variants, expanding its functional beverage offerings.
- In March 2022, Gong Cha a global chain of milk tea is aiming to plan for its expansion in Australia along with 17 stores in a current year.
Report Coverage
The Australia Bubble Tea market report emphasizes on key regions across the globe to provide better understanding of the product to the users. Also, the report provides market insights into recent developments, trends and analyzes the technologies that are gaining traction around the globe. Furthermore, the report covers in-depth qualitative analysis pertaining to various paradigm shifts associated with the transformation of these solutions.
The report provides detailed analysis of the market while focusing on various key aspects such as competitive analysis, product, flavor and their futuristic growth opportunities.
Australia Bubble Tea Market Report Scope
| Report Attributes | Details |
| Market size value in 2024 | USD 62.90 million |
| Revenue forecast in 2032 | USD 131.99 million |
| CAGR | 9.7% from 2024 – 2032 |
| Base year | 2023 |
| Historical data | 2019 – 2022 |
| Forecast period | 2024 – 2032 |
| Quantitative units | Revenue in USD million and CAGR from 2024 to 2032 |
| Segments covered | By Product, By Flavour |
| Customization | Report customization as per your requirements with respect to countries, region, and segmentation. |
FAQ's
The Australia Bubble Tea Market report covering key segments are product and flavor.
Australia Bubble Tea Market Size Worth $131.99 Million By 2032
Australia Bubble Tea Market exhibiting the CAGR of 9.7% during the forecast period
key driving factors in Australia Bubble Tea Market are rising partnerships to gain market and consumer insights
Download Sample Report of Australia Bubble Tea Market Growth, Industry Report 2024-2032
Please fill out the form to request a customized copy of the research report.
