
Global Automatic Tube Cleaning System Market Size, Share & Growth Analysis Report, 2024-2032
REPORT DETAILS
REPORT DETAILS
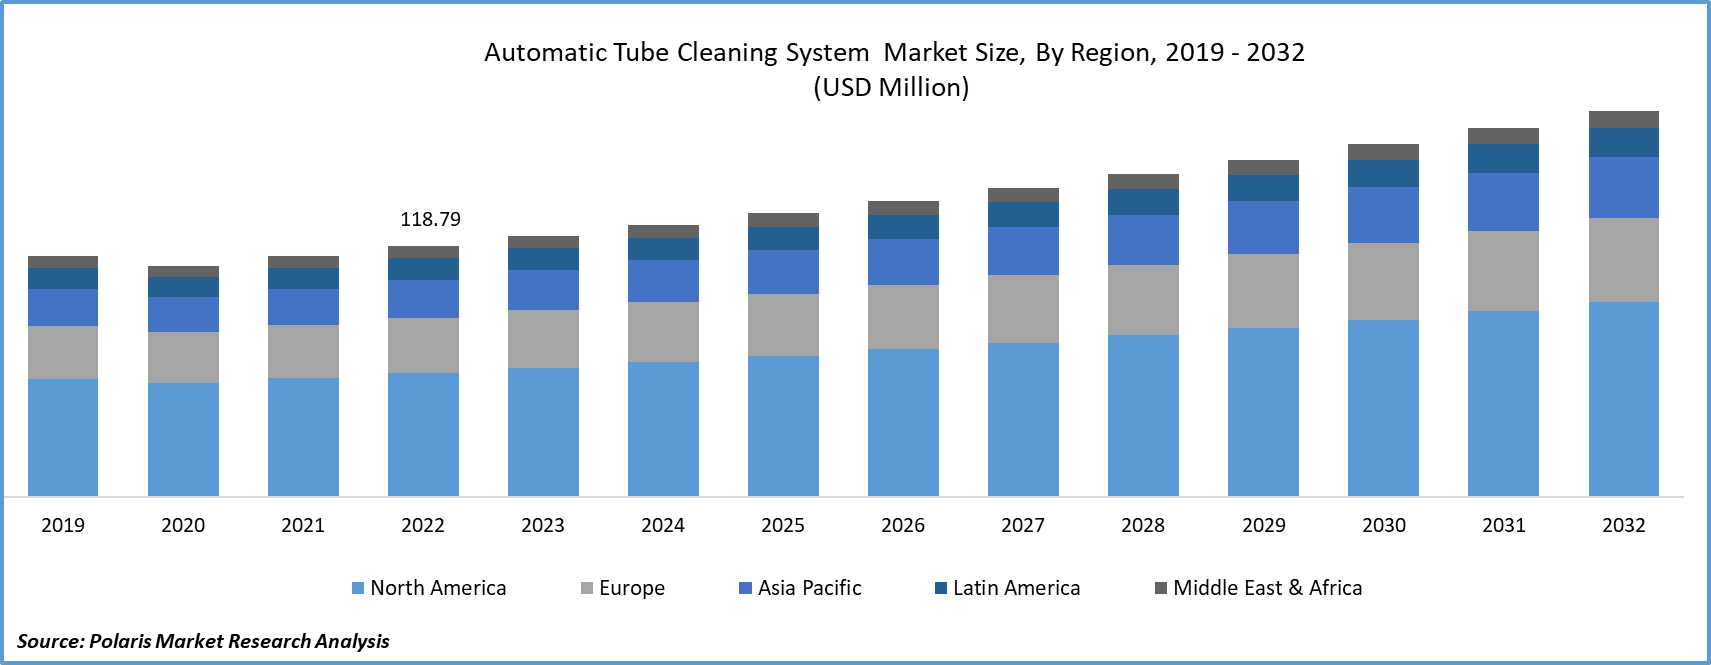
The global automatic tube cleaning system market was valued at USD 123.72 million in 2023 and is expected to grow at a CAGR of 4.50% during the forecast period.
Automatic Tube Cleaning System is a type of system designed for the maintenance and cleanliness of tubes in heat exchangers delivers notable benefits such as cost savings, simplified upkeep, and enhanced energy efficiency. These systems employ hydro-mechanical cleaning techniques to ensure that heat exchanger surfaces remain entirely free from fouling, thus preserving their operational efficiency.
To Understand More About this Research: Download Sample Report
Automatic tube cleaning systems are utilized to maintain the cleanliness and efficiency of pipes in various industrial applications. These systems prevent or remove deposits to ensure optimal performance of the equipment and can employ techniques like brushes, scrapers, or high-pressure water jets. This improves energy efficiency, reduces maintenance costs, and prolongs the lifespan of industrial equipment, particularly in heat exchangers, condensers, and other areas where deposits can accumulate and hinder fluid flow.
- For instance, Furthermore, individuals with diabetes often require ongoing medical attention due to increased hospitalization rates. It, in turn, contributes to the higher demand for coronary stents, as they are frequently used in treating diabetic patients with coronary artery disease.
Growing demand for automatic tube cleaning systems in power generation, HVAC and manufacturing industries due to their ability to maintain optimal performance of heat exchangers and tube-based equipment. This leads to efficient heat transfer, reduced energy consumption, and significant economic benefits. Their alignment with energy efficiency, sustainability objectives, and environmental rules makes them an attractive choice for various industries.
The COVID-19 pandemic has significantly impacted the automatic tube cleaning system market. This market caters primarily to industries such as HVAC, power generation, and industrial processing, where efficient heat exchanger and condenser tube systems are critical. Due to lockdowns and social distancing measures, many of these industries experienced disruptions, leading to a reduced demand for automatic tube cleaning systems. As a result, companies prioritized cost-cutting and deferred non-essential capital investments, leading to decreased maintenance and cleaning of tube systems.
However, the pandemic has also highlighted the importance of maintaining clean and efficient HVAC systems in healthcare facilities and public spaces. This has led to an increased focus on improving indoor air quality. This shift in perspective could drive demand for automatic tube cleaning systems, particularly in sectors where clean air and environmental safety are essential. As companies explore more automated and contactless solutions in the post-pandemic landscape, the adoption of smart technologies in the operation and maintenance of tube systems might see an upswing.
Industry Dynamics
Growth Drivers
- Increasing awareness about the hygiene and safety will drives Market Growth
Rising awareness about hygiene and safety will facilitate the growth of market. The growing emphasis on hygiene and safety in various industries is significantly fueling the expansion of the automatic tube cleaning system market. As businesses and organizations increasingly recognize the critical importance of maintaining clean and safe environments, the demand for innovative solutions that can automate and enhance tube cleaning processes is on the rise. These automatic tube cleaning systems offer a proactive approach to preventing contamination, microbial growth, and scale buildup within tubes and pipes, ensuring that equipment operates efficiently and that the risk of contamination-related issues is minimized.
With the heightened awareness of hygiene and safety standards, industries ranging from food processing to HVAC and power generation are actively adopting these systems to ensure compliance with stringent regulations and to safeguard the well-being of both their products and personnel. As a result, the automatic tube cleaning system market is witnessing robust growth as it addresses the pressing need for improved sanitation and safety across various sectors.
Report Segmentation
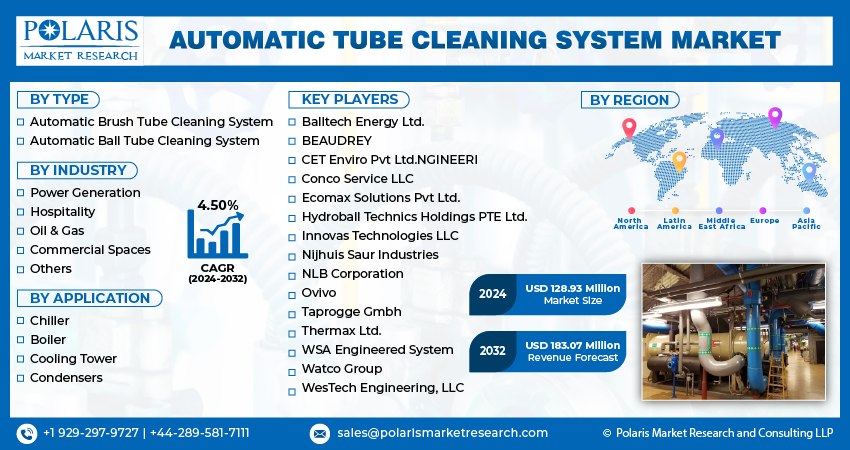
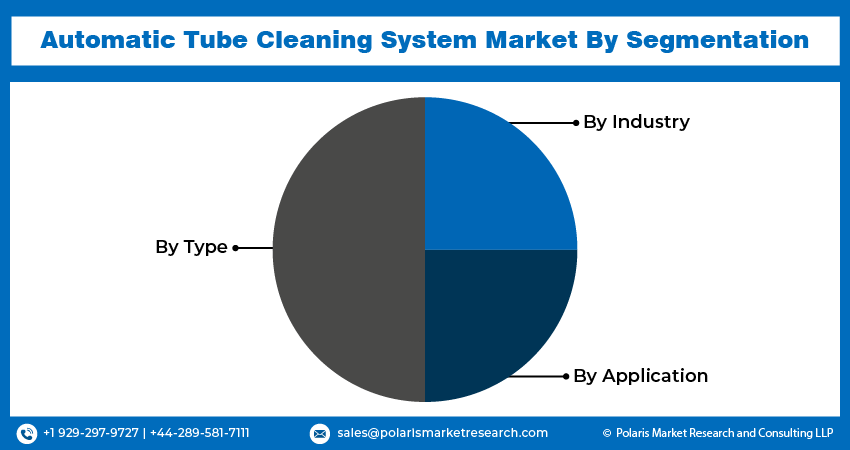
The market is primarily segmented based on type industry, application, and region.
| By Type | By Industry | By Application | By Region |
|
|
|
|
To Understand the Scope of this Report: Request Customization
By Type Analysis
- The automatic ball tube cleaning system segment accounted for the largest revenue share during the forecast period
On the basis of type the automatic tube cleaning system market is bifurcated into automatic brush tube cleaning system and automatic ball tube cleaning system. Between this the ball tube cleaning system is dominating the market with the highest revenue share. The ball tube cleaning system has gained growing popularity as a tube-cleaning method. This method involves using an injection pump to introduce rubberized balls, which are just slightly larger than the tube's circumference, into heat exchanger tubes. These balls are dispersed throughout multiple tubes, effectively cleaning them. This technology has proven particularly beneficial for large condensers utilized in power plants, leading to improved heat transfer efficiency. Furthermore, ongoing technological advancements in ball tube cleaning systems have yielded more efficient, reliable, and scalable solutions.
Enhancing power generation efficiency while reducing expenses associated with decreased fuel consumption is the primary goal. The sponge-ball tube cleaning system technology has long served as a widely recognized and embraced industry standard for maximizing condenser efficiency in the power generation sector.
By Industry Analysis
- The power generation segment dominating the market with largest revenue share during the forecast period
On the basis of Industry, the market has been bifurcated into power & generation, hospitality, oil & gas, commercial spaces and others. The power generation segment dominating the market with largest share during the forecast period. It plays a vital role in industrial operations, particularly in processes like steam production and cooling condensation. Water-based cooling systems within power plants often encounter a persistent problem of heat exchanger surfaces becoming clogged. This leads to decreased efficiency, resulting in higher energy consumption, increased CO2 and NOx emissions, and elevated operational costs.
The accumulation of deposits on the condenser reduces its overall effectiveness and necessitates higher energy usage in power plants, ultimately impacting their profitability. Consequently, the installation of automated tube cleaning systems is a common practice in power generation facilities, ensuring optimal energy production by continuous and automatic clog removal.
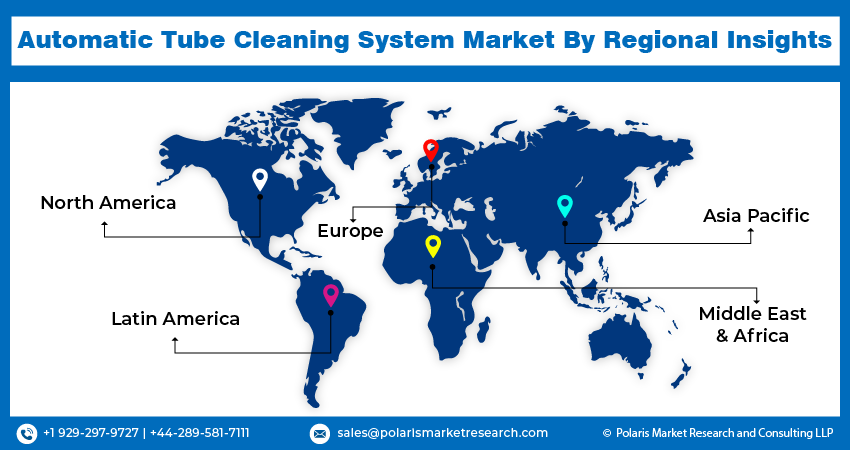
Regional Insights
- Asia-Pacific dominating the market with largest revenue share during the forecast period
Asia-Pacific dominating the market with largest revenue share in the forecast period. The surging adoption of automatic tube cleaning systems across various sectors in the Asia Pacific region, including industrial settings, the oil and gas industry, and hospitals, has led to a surge in customer demand for these systems. Notably, China, India, and Japan have witnessed increased investment and substantial advancements in their industrial sectors. These nations, serving as global industrial hubs, exhibit substantial growth potential for the automatic tube cleaning system market.
Furthermore, the escalating demand for electricity, driven by urbanization and population growth, underscores the necessity for power plants to meet the rising energy needs. As India and China continue to expand their utilization of renewable energy sources, it is expected that the market for automatic tube cleaning systems within these power plants will experience significant growth throughout the forecast period.
North America is anticipating to grow fastest during the forecast period. Due to the increasing acceptance of automatic tube cleaning, particularly in industries such as oil and gas, as well as various institutions, is fueling a considerable surge in demand for this product. Moreover, the expanding possibilities and prospects for growth in the automatic tube cleaning system market are creating ample opportunities for increased demand.
Key Market Players & Competitive Insights
The market is characterized by intense competition, with established players relying on advanced technology, high-quality products, and a strong brand image to drive revenue growth. These companies employ various strategies such as research and development, mergers and acquisitions, and technological innovations to expand their product portfolios and maintain a competitive edge in the market.
Some of the major players operating in the global market include:
- Balltech Energy Ltd.
- BEAUDREY
- CET Enviro Pvt Ltd.NGINEERI
- Conco Service LLC
- Ecomax Solutions Pvt Ltd.
- Hydroball Technics Holdings PTE Ltd.
- Innovas Technologies LLC
- Nijhuis Saur Industries
- NLB Corporation
- Ovivo
- Taprogge Gmbh
- Thermax Ltd.
- WSA Engineered System
- Watco Group
- WesTech Engineering, LLC
Recent Developments
- In October of 2022, Innovas Technologies launched the Helios Automatic Tube Cleaning System, an innovative solution designed to address fouling problems in water-cooled chiller plants. This pioneering system is a testament to Innovas Technologies' commitment to constantly pushing the limits of energy-efficient technology.
Automatic Tube Cleaning System Market Report Scope
| Report Attributes | Details |
| Market size value in 2024 | USD 128.93 million |
| Revenue forecast in 2032 | USD 183.07 million |
| CAGR | 4.50% from 2024 – 2032 |
| Base year | 2023 |
| Historical data | 2019 – 2022 |
| Forecast period | 2024 – 2032 |
| Quantitative units | Revenue in USD million and CAGR from 2024 to 2032 |
| Segments Covered | By Type, By Industry, By Application, By Region |
| Regional scope | North America, Europe, Asia Pacific, Latin America; Middle East & Africa |
| Customization | Report customization as per your requirements with respect to countries, region and segmentation. |
Research Methodology
A robust system of research, verification, and forecasting designed to ensure reliable and actionable market insights.
Polaris Market Research & Consulting, Inc. uses a clear and structured approach to deliver insights that clients can rely on. The process combines detailed primary and secondary research, including direct communication with industry experts. The detailed information helps build a complete picture of market trends and developments. Secondary data is gathered from credible sources such as industry reports, company filings, government source links, and trusted organization databases. It is then cross-checked through discussions with key stakeholders across the value chain. Market size and forecasts are developed using both bottom-up and top-down methods to ensure accuracy and consistency in the final results.
1. Project Setup
Step 1 & 2:
- We start every project by clearly understanding the client’s objective or goal, then defining the market scope, and aligning regions, segments, and timelines.
- Once the foundation is set, we collect data from all-around of sources, including company reports, government databases, and paid industry platforms.
- Our research is based on secondary data, which helps us build a strong understanding of the market across regions and industries. Then we validate this information through primary research by speaking directly with industry experts, companies, and stakeholders.
- By combining secondary and primary research, we ensure that our market insights are accurate, practical, and closely aligned with real market conditions.
2. Data Collection
We gather information from both public and verified sources:
3. Data Structuring
Step 3:
- All collected data is organized into a consistent format to ensure accurate analysis. Since inputs come from multiple sources, they are standardized and aligned before use.
- The data is segmented by product, application, and region, and mapped across a defined historical period (2020–2024). All values are converted into common units (USD Mn/Bn), and volume and pricing are aligned where required to estimate revenue.
- Any overlaps or inconsistencies are reviewed and adjusted to maintain accuracy (<5% variance threshold).
- The result is a structured dataset that allows for clear comparison across regions and supports reliable analysis and forecasting.
Structured Market Dataset, USD Mn/Bn
| Region | Segment | VolumeUnits | Avg PriceUSD | RevenueUSD Mn | Share % |
|---|---|---|---|---|---|
| North America | Product A | 250 | 2.5 | 500 | 15% |
| Product A | XX | XX | XX | XX | |
| Product A | XX | XX | XX | XX | |
| Consistent methodology applied across regions | |||||
4. Market Estimation
Step 4: TOP-DOWN APPROACH
- We start with the overall market size at a global or macro level.
- The market is then narrowed down based on scope and industry relevance.
- We apply penetration rates and split the data by region and segment.
- This helps us estimate the market size for specific segments.
- The numbers are validated through cross-checks to ensure accuracy.
Step 5: BOTTOM-UP APPROACH
- We begin by analyzing data from leading companies in the market.
- Revenue data is collected and mapped across different segments.
- The data is then aggregated to estimate the total market size.
- To fill in any gaps, adjustments are made based on industry standards.
- Validation checks make sure that the results are correct.
5. Forecasting
Step 6:
At Polaris Market Research & Consulting, Inc., we employ a methodical forecasting strategy. This approach blends the analysis of historical data with real-time market validation. To forecast future trends with precision, we examine past patterns, pricing fluctuations, and the interplay of supply and demand. To ensure our conclusions reflect the present market landscape, we actively seek input from industry experts and key stakeholders.
To refine our predictions, we carefully consider critical elements such as market drivers and restraints, fluctuations in raw material costs, emerging technologies, and the production capabilities of various regions. Furthermore, we assess regulatory frameworks and potential policy shifts to gauge their potential impact on market expansion.
All this information is synthesized to generate precise forecasts for each segment and region. These forecasts illuminate the current state of the market and highlight forthcoming opportunities.
6. Validation & Triangulation
Step 7:
In the final stage, we validate all our estimates using a triangulation method, where data is cross-checked from multiple reliable sources, like company data, primary interviews, and secondary research. This helps us make sure that our numbers are correct and fit with the rest of the market.
This process involves verifying data consistency across various segments and geographic areas. It also requires comparing historical trends with the assumptions support the forecast. Any discrepancies involve adjustments to ensure everything remains aligned and dependable.
Once the data is finalized, we prepare the final outputs, including market size estimates, segment-wise breakdowns, and growth metrics. These are delivered in structured formats such as tables, charts, and data files for easy analysis and use.
We collaborate closely with clients, ensuring the final products align with their requirements. This includes offering tailored adjustments, supplementary data analyses, and continuous assistance. Furthermore, we monitor market trends post-delivery, providing updates and refinements to maintain the insights' relevance as time passes.
Triangulation Framework
Estimates are cross-verified across three sources:
Company-level data
• Primary inputs from industry participants
• Secondary benchmarks and published data
Variance maintained within +5-10%
Adjustments applied to align estimates
Segment values validated against overall market structure
Data Consistency & Integrity
Segment totals validated to 100%
Regional estimates aligned with global market size
Historical trends compared against forecast outputs
Assumptions reviewed for cross-segment and regional alignment
Final Outputs
Deliverables
Client Alignment & Support
- Deliverables are aligned with defined client requirements and scope
- Custom data cuts and segment splits are incorporated as required
- Post-delivery queries are addressed through analyst interactions
- Additional clarifications and data support are provided upon request
Client Continuity & Updates
- Market developments are tracked post-delivery to capture changes in key trends
- Updated data and revisions are provided based on new market inputs
- Additional refinements and data cuts are shared as required
- Continued analyst engagement supports evolving client requirements
Download Sample Report of Global Automatic Tube Cleaning System Market Size, Share & Growth Analysis Report, 2024-2032
Please fill out the form to request a customized copy of the research report.
