
Bio-LNG Market Demand Scenario, Developments by 2026-2034
REPORT DETAILS
Bio-LNG Market Summary
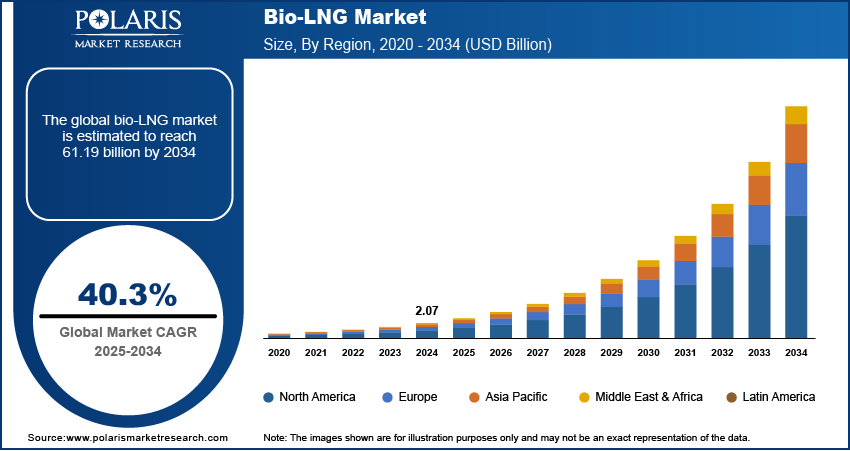
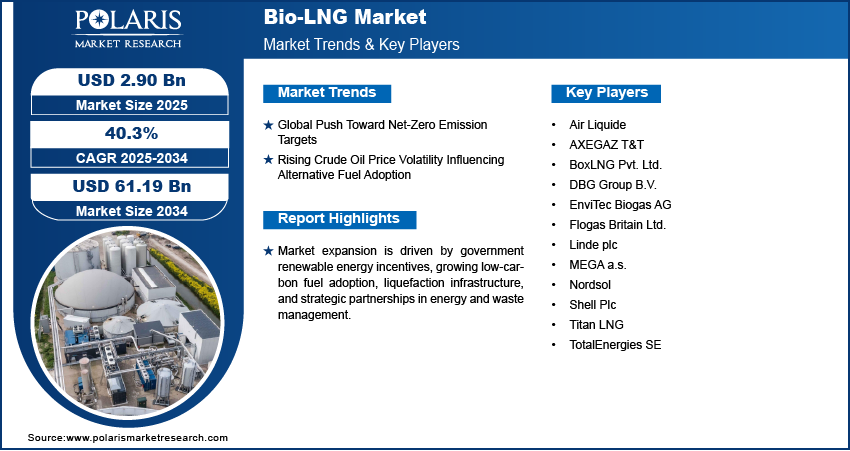
The global bio-LNG market size was valued at USD 2.90 billion in 2025, growing at a CAGR of 40.51% from 2026–2034. Worldwide push for net-zero emission goals combined with increasing volatility of crude oil prices is fueling the need for alternative sustainable fuels.
Market Statistics
Key Takeaways
- Europe dominated with 37.6% share in 2025, based on firm renewable policies and government support.
- Germany held 39.5% share of Europe in 2025, due to huge production units and supportive policies.
- Asia Pacific to grow the fastest at a CAGR of 41.5% in 2025, owing to industrialization and energy requirements.
- China held 41.5% share of APAC through bio-LNG projects and increasing infrastructure.
- Household waste held 19.7% share in 2025, with abundant availability of waste and usage in industries.
- Agricultural waste dominated the market with 27.6% share in 2025 from crop residues and by-products.
*Note: Figures and projections outlined in this report are the result of Polaris Market Research’s proprietary analytical processes, grounded in the latest available datasets and market observations.
Industry Dynamics
- Global drive towards net-zero emission targets is building momentum for the switch towards renewable and low-carbon fuels like bio-LNG.
- Volatility in crude oil prices is pushing industries and transport operators towards the adoption of bio-LNG as a cost-nat and sustainable fuel option.
- Exorbitant costs of production and infrastructure are holding back mass commercialization of bio-LNG.
- Technological advances in liquefaction, waste-to-energy technology and integration of renewable gas provide significant growth opportunities for the bio-LNG industry. Innovations.
What is Bio-LNG?
Bio-LNG is a renewable, low-carbon substitute for traditional liquefied natural gas, which is manufactured by the purifying and liquefaction of biogas from organic waste. It has high energy density, lower greenhouse gas emissions, and compatibility with the use of existing LNG infrastructure, and it is appropriate for heavy-duty transport, marine, and industrial energy requirements.
Governments and energy authorities are encouraging bio-LNG uptake with renewable fuel bonuses, emissions reduction targets, and circular economy programs. Increased investments in biogas upgrading, liquefaction facilities, and refueling networks are enhancing scalability of production and access to markets.
Bio-LNG Vs. Conventional LNG
Conventional LNG is produced from fossil natural gas reserves. However, bio-LNG is derived from organic waste, agricultural residues, sewage sludge, and other renewable biomass sources. Both fuels are chemically similar and compatible with existing LNG infrastructure. However, they differ significantly in terms of sustainability, carbon footprint, and environmental impact.
| Parameter | Bio-LNG | Conventional LNG |
| Carbon Emissions | Significantly lower lifecycle CO₂ emissions. It can achieve near-carbon-neutral or negative emissions, depending on the feedstock. | Higher greenhouse gas emissions due to fossil fuel extraction, liquefaction, and transport |
| Feedstock Source | Organic waste, agricultural residues, food waste, manure, sewage sludge | Fossil natural gas extracted from underground reserves |
| Sustainability | Renewable and supports circular economy principles | Non-renewable fossil-based fuel |
| Infrastructure Compatibility | Fully compatible with existing LNG storage, transport, and fueling infrastructure | Established infrastructure globally available |
| Fuel Efficiency | High energy density and comparable performance to LNG | High energy density with mature fuel efficiency standards |
| Environmental Impact | Lower NOx, SOx, and particulate emissions; reduces waste disposal issues | Lower emissions than coal and diesel, but methane leakage remains a concern |
| Lifecycle Carbon Footprint | Typically 70–90% lower than fossil fuels, depending on production pathway | Considerably higher due to upstream fossil extraction and methane slip |
| Resource Availability | Limited by biomass and organic waste availability | Widely available through global natural gas reserves |
| Adoption Challenges | High production costs and limited production capacity | Volatile gas prices and environmental regulations |
| Key End-Use Applications | Heavy-duty transport, shipping, industrial heating, power generation | Power generation, industrial fuel, marine fuel, transportation |
Source: Polaris Market Research Analysis
Source: Polaris Market Research Analysis
Increased emphasis on carbon neutralization, corporate sustainability goals, and energy diversification techniques is propelling market growth. Strong renewable energy regulations and waste management infrastructure in regions are leading to accelerated integration of bio-LNG, promoting energy security along with long-term decarbonization objectives. The European Union (EU) had a goal of 20% of renewable energy in overall energy consumption by 2020. It later raised the target further to 32% by 2030.
Drivers & Opportunities
Global Push Toward Net-Zero Emission Targets: The international trend toward net-zero emission goals is propelling the use of bio-LNG as a low-carbon fuel. In June 2024, 107 UN Net Zero Coalition countries had pledged to reach net-zero emissions by 2050 in an effort to keep global warming to 1.5°C. Governments are implementing reduction emission and renewable energy regulations. Bio-LNG assists industries and transportation operators in achieving decarbonization targets. It provides considerable lifecycle greenhouse gas reductions. The fact that it is compatible with current LNG infrastructure improves the chances of its adoption.
Rising Crude Oil Price Volatility Influencing Alternative Fuel Adoption: Increased volatility in crude oil prices is driving demand for stable cost alternatives such as bio-LNG. Fleet operators and industries desire stable pricing and assured supply. Bio-LNG employs domestically sourced feedstock, minimizing exposure to international oil price changes. Its economic value underpins broader take-up in transport and industrial applications. This enhances energy diversification and risk management.
Source: Polaris Market Research Analysis
Segmental Insights
Source Analysis
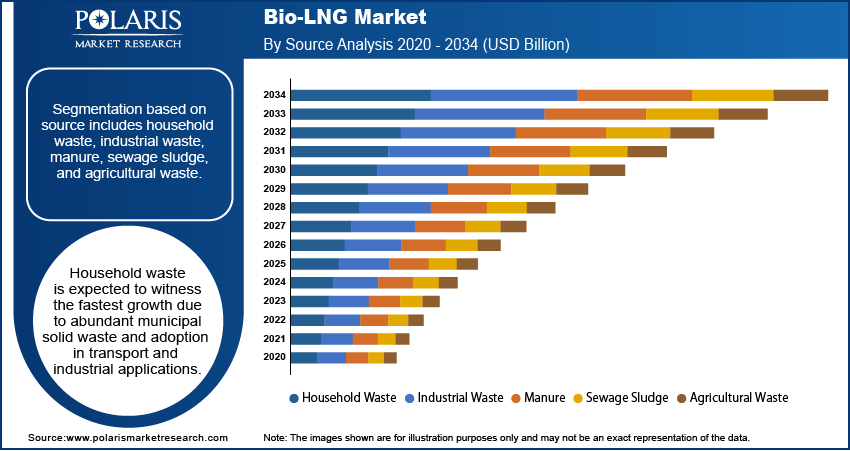
Based on source, segmentation consists of household waste, industrial waste, manure, sewage sludge, and agricultural waste. The household waste segment held 19.7% in 2025, due to the high availability of municipal solid waste for biogas production. In addition, domestic waste offers a stable feedstock and enables sustainable waste management strategies.
The agricultural waste category held 27.6% share, owing to growing use of crop residue and by-products. In addition, it minimizes environmental pollution alongside enabling circular economy practices in rural areas.
Production Process Analysis
On the basis of production process, the market is segmented into anaerobic digestion, biogas purification, methane separation, and liquefaction. The anaerobic digestion dominated the market with 38.9% in 2025, due to its efficiency in converting organic waste into methane. Moreover, it allows continuous biogas production and enhance large-scale integration with liquefaction facilities.
The liquefaction segment is projected to grow at the fastest CAGR of 40.2% during the forecast period owing to rising demand for transportable bio-LNG. Moreover, it enables higher energy density and storage efficiency while supporting distribution to end users effectively.
End User Analysis
On the basis of end user, the market is segmented into transportation, power generation, manufacturing, maritime, and others. The transportation segment dominated the market with 35.2% share in 2025 owing to increasing adoption of bio-LNG in heavy-duty trucks and buses. In addition, it minimizes greenhouse gas emissions and facilitates government decarbonization targets effectively.
The maritime segment is also expected to expand at the highest CAGR of 42.2% over the forecast period owing to increasing demand for marine low-carbon fuels. In October 2025, Balearia is now running three ferries exclusively on bio-LNG, cutting about 80,300 tonnes of CO₂ and supporting sustainable transport. In addition, it enables compliance with international emission regulations and supports sustainable shipping operations globally.
Technological Advancements in Bio-LNG Production
Technological advancements in Bio-LNG production are significantly enhancing process efficiency, methane recovery, and overall sustainability of renewable fuel generation. Producers use advanced cryogenic liquefaction systems, AI-based biogas monitoring, high-efficiency methane purification technologies, and integrated waste-to-energy conversion systems. They help reduce operational costs while increasing fuel quality and production scalability. Bio-LNG plants use these to achieve higher methane purity and lower energy consumption. They support the global transition toward low-carbon transportation and circular economy models.
| Technological Advancement | Description | Key Benefits |
| Advanced Liquefaction Systems | Modern cryogenic and single mixed refrigerant (SMR) technologies improve biomethane liquefaction efficiency and reduce energy consumption during Bio-LNG production. | Higher energy efficiency, lower operating costs, improved LNG storage and transportation |
| AI-Driven Biogas Optimization | Artificial intelligence and machine learning systems optimize anaerobic digestion by monitoring feedstock quality, pH levels, methane yield, and process conditions in real time. | Increased methane output, predictive maintenance, reduced downtime, enhanced operational control |
| Improved Methane Purification Technologies | Advanced membrane separation, TPSA (Temperature Pressure Swing Adsorption), cryogenic separation, and water scrubbing technologies enable higher methane purity levels exceeding 97–99%. | Better fuel quality, reduced CO₂ impurities, compliance with transportation fuel standards |
| Efficient Waste Conversion Technologies | Enhanced anaerobic digestion systems and waste preprocessing technologies improve conversion of agricultural waste, food waste, manure, and municipal waste into biomethane. | Improved waste utilization, higher biogas yield, reduced landfill emissions |
| Carbon Capture & Integration Systems | Integrated carbon capture technologies recover CO₂ generated during biogas upgrading for industrial reuse or sequestration. | Lower lifecycle emissions, additional revenue streams, support for net-negative emission goals |
| Modular & Small-Scale Bio-LNG Plants | Compact modular Bio-LNG systems allow decentralized production near feedstock sources, improving supply chain efficiency. | Reduced transportation costs, scalable deployment, improved rural energy access |
| Biological & Chemical Methanation Technologies | Emerging methanation technologies convert captured CO₂ into renewable methane using hydrogen and microbial processes. | Enhanced methane production, improved carbon recycling, support for renewable energy integration |
| Smart Monitoring & Automation Systems | IoT-enabled sensors and automated monitoring platforms improve plant performance tracking and energy management. | Real-time analytics, operational efficiency, reduced maintenance costs |
Source: Polaris Market Research Analysis
Source: Polaris Market Research Analysis
Regional Analysis
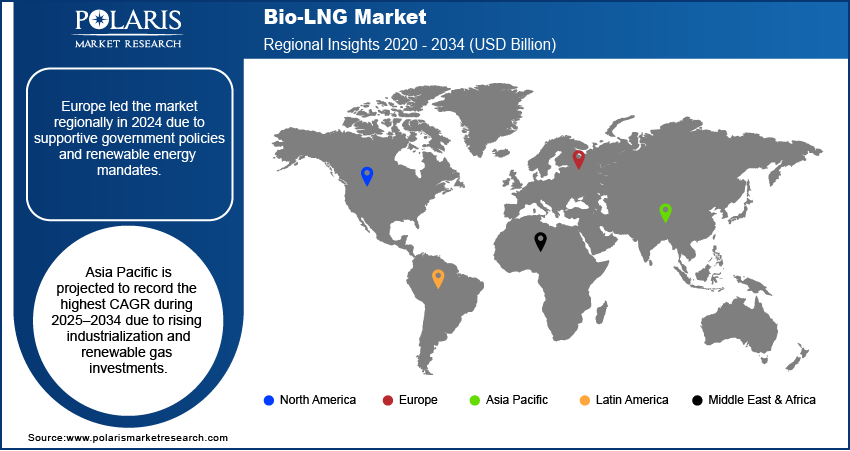
Europe dominated the bio-LNG market with 37.6% share in 2025, due to strict emission reduction policies promoting renewable fuels. Moreover, advanced waste management infrastructure encourages large-scale biogas production. In 2024, Eurostat reported that renewable energy supply in the EU rose 3.4% from 2023, reaching about 11.3 million terajoules. In addition, strong investments in liquefaction and refueling networks also support bio-LNG adoption.
Germany Bio-LNG Market Insight
Germany led Europe with 39.5% share in 2025, in the adoption of bio-LNG owing to huge government subsidies for projects using renewable gas. Furthermore, its highly developed industrial and transport sectors allow for huge bio-LNG utilization. Plus, public-private partnerships are speeding the development of alternative fuel infrastructure.
North America Bio-LNG Market
North America held the second largest position growing at a CAGR of 39.5% during the forecast period, due to increasing use of low-carbon transportation fuels and favorable federal renewable energy laws. Furthermore, vast availability of feedstock from municipal and agriculture sources supports production of bio-LNG. Further, corporate sustainability efforts also enhance usage.
Asia Pacific Bio-LNG Market
Asia Pacific is the fastest growing region at a CAGR of 41.5% owing to increasing energy demand and rising focus on clean transport fuels. Moreover, rapid industrialization supports higher bio-LNG utilization. In addition, favorable government policies for renewable energy and waste-to-energy projects are driving market growth. For instance, in January 2025, Ecomak secured the contract to supply and commission the filtration system for a 12 MW Waste-to-Energy plant in Southeast Asia, treating 700 tonnes of municipal waste per day.
China Bio-LNG Market Overview
Regional growth is led by China with 41.5% share of APAC in the form of large-scale utilization of agricultural and municipal waste for bio-LNG. Further, its renewable energy goals stimulate adoption across the industrial and transport sectors. To this end, increasing LNG refueling infrastructure aids effective market penetration.
Source: Polaris Market Research Analysis
Key Players & Competitive Analysis Report
The bio-LNG industry is moderately competitive, with players enhancing capabilities on the production, liquefaction, and distribution infrastructure. Investments in biogas upgrading technologies, refueling networks, and collaborations with waste management companies and transport operators also support fuel quality, market reach, and uptake.
Which are the key players in Bio-LNG Market?
Key players in the market include Linde plc, Nordsol, Flogas Britain Ltd., MEGA a.s., AXEGAZ T&T, TotalEnergies SE, Titan LNG, DBG Group B.V., BoxLNG Pvt. Ltd., Shell Plc, EnviTec Biogas AG, and Air Liquide.
Key Players
- Air Liquide
- AXEGAZ T&T
- BoxLNG Pvt. Ltd.
- DBG Group B.V.
- EnviTec Biogas AG
- Flogas Britain Ltd.
- Linde plc
- MEGA a.s.
- Nordsol
- Shell Plc
- Titan LNG
- TotalEnergies SE
Industry Developments
-
April 2026: Gasum and Wasaline extended their agreement to continue bio-LNG supply through 2027. Through this agreement, the companies would strengthen their commitment to develop sustainable maritime transport on the Baltic Sea. (Source: gasum.com)
-
October 2025: Gasum has started building three new bio-LNG stations in Finland, set to open in early 2026, expanding its renewable fuel network for heavy-duty transport. (Source: gasum.com)
-
October 2025: Balearia began operating three ferries exclusively on bio-LNG, cutting around 80,300 tonnes of CO₂ and supporting its sustainability goals. (Source: balearia.com)
-
September 2025: Hapag-Lloyd and Shell signed a multi-year deal to supply Bio-LNG for dual-fuel ships, supporting emissions reduction and Hapag-Lloyd’s net-zero goal by 2045. (Source: hapag-lloyd.com)
-
July 2025: NYK Line began continuous use of bio-LNG for its LNG-powered car carriers Daisy Leader and Sumire Leader, supplied by Titan Clean Fuels at the Port of Zeebrugge, helping cut emissions and support decarbonization goals. (Source: nyk.com)
-
March 2025: Titan Clean Fuels and Mitsui O.S.K. Lines completed their first bio-LNG bunkering at the Port of Zeebrugge, supplying a certified waste-based bio-LNG blend to the Celeste Ace to reduce emissions and expand low-carbon fuel use in shipping. (Source: mol.co.jp)
-
May 2024: Nordsol and Prodeval partnered to develop a Bio-LNG production facility in Portugal that will process agricultural organic waste, strengthening renewable energy efforts in Southern Europe. (Source: nordsol.com)
Bio-LNG Market Segmentation
By Source Outlook (Revenue, USD Billion, 2021–2034)
- Household Waste
- Industrial Waste
- Manure
- Sewage Sludge
- Agricultural Waste
By Production Process Outlook (Revenue, USD Billion, 2021–2034)
- Anaerobic Digestion
- Biogas Purification
- Methane Separation
- Liquefaction
By End User Outlook (Revenue, USD Billion, 2021–2034)
- Transportation
- Power Generation
- Manufacturing
- Maritime
- Others
By Regional Outlook (Revenue, USD Billion, 2021–2034)
- North America
- U.S.
- Canada
- Europe
- Germany
- France
- UK
- Italy
- Spain
- Netherlands
- Russia
- Rest of Europe
- Asia Pacific
- China
- Japan
- India
- Malaysia
- South Korea
- Indonesia
- Australia
- Vietnam
- Rest of Asia Pacific
- Middle East & Africa
- Saudi Arabia
- UAE
- Israel
- South Africa
- Rest of Middle East & Africa
- Latin America
- Mexico
- Brazil
- Argentina
- Rest of Latin America
Bio-LNG Market Report Scope
| Report Attributes | Details |
| Market Size in 2025 | USD 2.90 Billion |
| Market Size in 2026 | USD 4.06 Billion |
| Revenue Forecast by 2034 | USD 61.99 Billion |
| CAGR | 40.51% from 2026 to 2034 |
| Base Year | 2025 |
| Historical Data | 2021–2024 |
| Forecast Period | 2026–2034 |
| Quantitative Units | Revenue in USD Billion and CAGR from 2026 to 2034 |
| Report Coverage | Revenue Forecast, Competitive Landscape, Growth Factors, and Industry Trends |
| Segments Covered |
|
| Regional Scope |
|
| Competitive Landscape |
|
| Report Techniqueat |
|
| Customization | Report customization as per your requirements with respect to countries, regions, and segmentation. |
Source: Polaris Market Research Analysis
FAQ's
The global market size was valued at USD 2.90 billion in 2025 and is projected to grow to USD 61.99 billion by 2034.
The global market is projected to register a CAGR of 40.51% during the forecast period.
Europe dominated with 37.6% share in 2025.
A few of the key players in the market are Linde plc, Nordsol, Flogas Britain Ltd., MEGA a.s., AXEGAZ T&T, TotalEnergies SE, Titan LNG, DBG Group B.V., BoxLNG Pvt. Ltd., Shell Plc, EnviTec Biogas AG, and Air Liquide.
Household waste held 19.7% share in 2025.
The maritime segment is also expected to expand at the highest CAGR of 42.2% over the forecast period.
Download Sample Report of Bio-LNG Market
Please fill out the form to request a customized copy of the research report.
