
Global Blood Meal Market Size, Share & Growth Analysis Report, 2023-2032
REPORT DETAILS
REPORT DETAILS
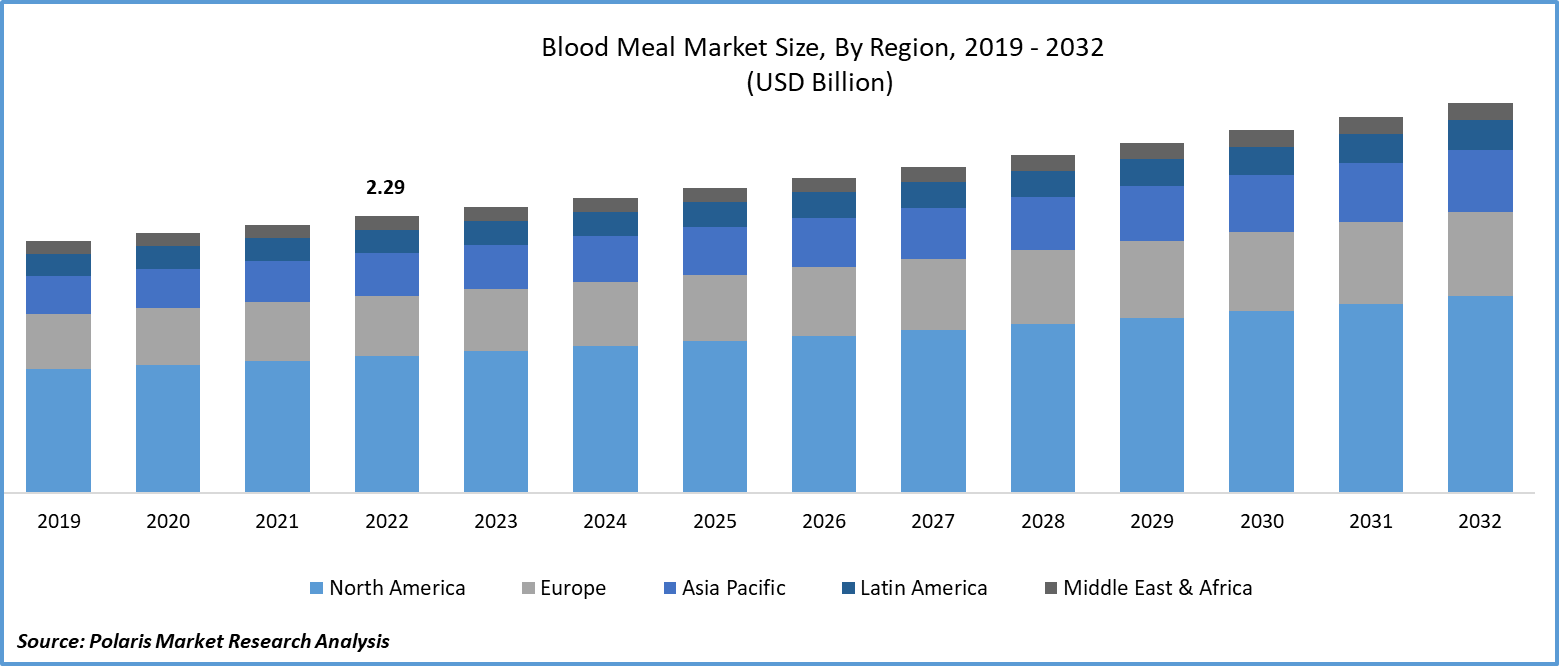
The global blood meal market was valued at USD 2.29 billion in 2022 and is expected to grow at a CAGR of 3.5% during the forecast period.
The rapid increase in the consumption of various types of meat products across the globe and growing consumer awareness about the numerous potential benefits of consuming blood meals rich in various essential nutrients, including protein, iron, and nitrogen, have led to increased usage of the product as a dietary supplement and organic fertilizer, are among the prominent factors expected to drive global market growth over the coming years.
To Understand More About this Research: Download Sample Report
- For instance, as per a report published by THE WORLD COUNTS, global meat consumption is likely to reach between 460 million to 570 million by 2050, which is approx. Double with the consumption of meat in 2008. The US is the country with the highest meat consumption per capita, with around 124 kilos, followed by Australia and Argentina, with 122 and 109 kilos, respectively.
Additionally, with the drastic increase in the number of farmers worldwide seeking and utilizing blood meal in combination with several other compost materials like paper or straw and dried leaves, among others, in order to better ensure the availability of nutrients and adoption as an appropriate natural and cost-effective alternative to boost the nutrient contents in the soil, the demand and need for blood meal has grown drastically and put a pressure of companies to develop blood meal specially catered to farming usage.
In recent years, there has been an emerging trend among manufacturers and suppliers all over the world to introduce new value-added blood meal products like fortified blood meal with specified nutrients or blends and food-as-a-medicine products, which is further likely to escalate product demand at a rapid pace.
For Specific Research Requirements: Request for Customized Report
- For instance, in August 2023, ModifyHealth, a global leader in food as medicine space, announced the launch of its new food-as-medicine meal, which is mainly developed to help people fight several costly and chronic conditions. The new meals will allow the company to provide better care and relieve pain points for consumers dealing with the struggles of restrictive diets.
Industry Dynamics
Growth Drivers
- Exponential growth of poultry feed industry
The product has gained significant traction and is becoming increasingly popular as an important feed ingredient in poultry feed due to its many beneficial characteristics such as better performance and cost-effectiveness. This, in turn, has driven extensive global blood meal market growth. Additionally, the exponential rise in demand for poultry across various nations and the emergence of blood meal as a source of various important micronutrients, such as iron, which is crucial for the formulation of hemoglobin as well as the prevention of anemia, is anticipated to create lucrative growth opportunities for the market.
- For example, according to the Agri-Food Outlook 2023 report, the total feed tonnage was estimated to be around 1.266 billion metric tons globally. Out of this, approximately 525.8 million metric tons of totalled feed is poultry feed, accounting for 42% of total compound feed production worldwide.
Report Segmentation
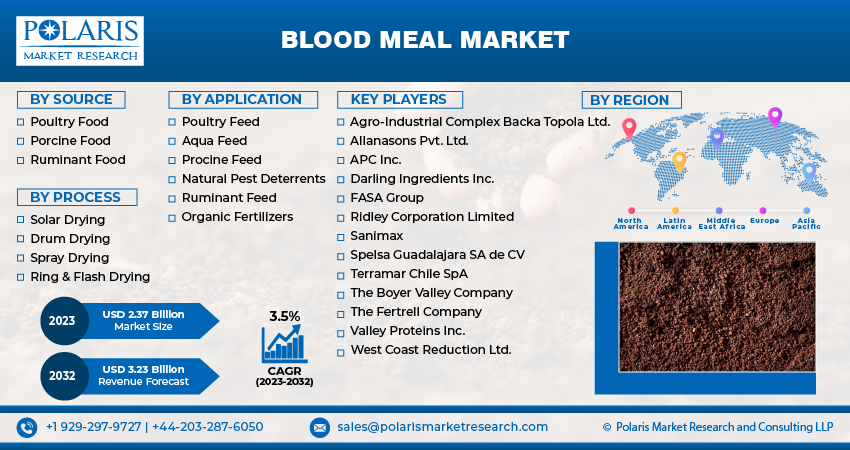
The market is primarily segmented based on source, process, application, and region.
| By Source | By Process | By Application | By Region |
|
|
|
|
To Understand the Scope of this Report: Request Customization
By Source Analysis
- Poultry food segment accounted for the largest market share in 2022
The poultry food segment accounted for a notable market share. The growth of the segment market can be largely attributed to the increased use of blood meals by a large number of poultry farmers as supplementary feed ingredients in order to meet the protein requirements of birds and also to improve the overall productivity of poultry.
Apart from this, poultry farmers across the world are increasingly becoming aware of the specific nutritional requirements of their birds for optimal growth and production, which has led to a greater emphasis on formulating balanced diets, including the incorporation of high-quality protein sources such as blood meal, which have fueled the growth of the segment market.
By Process Analysis
- Ring & flash drying segment held the significant market share in 2022
The ring & flash drying segment held a significant market share in terms of revenue in 2022, which is majorly driven by the widespread use of this processing method to manufacture blood meal more effectively and efficiently, as it helps in reducing waste and complying with environmental standards. In addition, the growing advances in ring & flash drying methods have resulted in improved efficiency and cost-effectiveness of blood meal production, which encourages a greater number of meat processing plants to invest in such kind of technologies and processing methods, thereby influencing the segment market at a rapid pace.
By Application Analysis
- Organic fertilizers segment is expected to witness highest growth
The organic fertilizers segment is expected to grow at the highest growth rate over the next coming years on account of increasing consumer awareness and concern about food safety and environmental sustainability across the world and the growing popularity of blood meal in the agriculture sector, as it is rich in nitrogen which is an essential nutrient for plant growth.
Additionally, several major governments and regulatory bodies have been introducing new favorable polices and certifications to support organic farming practices and promote the use of organic inputs like blood meal, which, in turn, is expected to bode well for segment market growth in the near future.
Regional Insights
- North America region dominated the global market in 2022
The North America region dominated the global market. The regional market growth is highly attributable to the region’s increased consumption of various types of livestock products, including meat products, and the presence of a well-established animal feed sector across the region. The continuous increase in research & development activities and efforts in agriculture and organic farming practices are also likely to open up new application areas and formulation methods for products, thereby propelling the overall regional market growth.
- For instance, according to our findings, the consumption of broiler meat in the United States amounted to about 98.9 pounds per capita in the year 2022, and the number is expected to be around 100.1 pounds per capita by 2023.
Asia Pacific will grow at a rapid pace, owing to continuous expansion and establishment of manufacturing capabilities in major Asia Pacific countries and a surge in the number of governments promoting the use of several specified feed ingredients.
Key Market Players & Competitive Insights
The blood meal market is moderately competitive in nature with the presence of several leading companies all over the world. Top companies involved in the production and distribution of product are investing significantly to ensure the quality of their products and also looking to strengthen their market position ahead of their competitors and gain a competitive edge.
Some of the major players operating in the global market include:
- Agro-Industrial Complex Backa Topola Ltd.
- Allanasons Pvt. Ltd.
- APC Inc.
- Darling Ingredients Inc.
- FASA Group
- Ridley Corporation Limited
- Sanimax
- Spelsa Guadalajara SA de CV
- Terramar Chile SpA
- The Boyer Valley Company
- The Fertrell Company
- Valley Proteins Inc.
- West Coast Reduction Ltd.
Recent Developments
- In August 2023, Beneo, an ingredient supplier, announced the launch of its new wholegrain barley flour named Orafti β-Fit, which will tout enough beta-glucans to justify attention-grabbing and qualified heart health claims. The newly developed flour can easily deliver the same number of beta-glucans found in 3 bowls of oatmeal in just 15 grams of 3-4 tablespoons.
- In April 2023, Nestle introduced its new line of meals, namely nutritious Lean Cuisine Balance Bowls, that is likely to support people in managing their blood sugar levels and help consumers to achieve their personal nutritional goals effectively. Also, the new meal meets the guidelines of American Diabetes Association Better Choices for the Life Program.
Blood Meal Market Report Scope
| Report Attributes | Details |
| Market size value in 2023 | USD 2.37 billion |
| Revenue forecast in 2032 | USD 3.23 billion |
| CAGR | 3.5% from 2023 – 2032 |
| Base year | 2022 |
| Historical data | 2019 – 2021 |
| Forecast period | 2023 – 2032 |
| Quantitative units | Revenue in USD billion and CAGR from 2023 to 2032 |
| Segments covered | By Source, By Process, By Application, By Region |
| Regional scope | North America, Europe, Asia Pacific, Latin America; Middle East & Africa |
| Customization | Report customization as per your requirements with respect to countries, region and segmentation. |
Research Methodology
A robust system of research, verification, and forecasting designed to ensure reliable and actionable market insights.
Polaris Market Research & Consulting, Inc. uses a clear and structured approach to deliver insights that clients can rely on. The process combines detailed primary and secondary research, including direct communication with industry experts. The detailed information helps build a complete picture of market trends and developments. Secondary data is gathered from credible sources such as industry reports, company filings, government source links, and trusted organization databases. It is then cross-checked through discussions with key stakeholders across the value chain. Market size and forecasts are developed using both bottom-up and top-down methods to ensure accuracy and consistency in the final results.
1. Project Setup
Step 1 & 2:
- We start every project by clearly understanding the client’s objective or goal, then defining the market scope, and aligning regions, segments, and timelines.
- Once the foundation is set, we collect data from all-around of sources, including company reports, government databases, and paid industry platforms.
- Our research is based on secondary data, which helps us build a strong understanding of the market across regions and industries. Then we validate this information through primary research by speaking directly with industry experts, companies, and stakeholders.
- By combining secondary and primary research, we ensure that our market insights are accurate, practical, and closely aligned with real market conditions.
2. Data Collection
We gather information from both public and verified sources:
3. Data Structuring
Step 3:
- All collected data is organized into a consistent format to ensure accurate analysis. Since inputs come from multiple sources, they are standardized and aligned before use.
- The data is segmented by product, application, and region, and mapped across a defined historical period (2020–2024). All values are converted into common units (USD Mn/Bn), and volume and pricing are aligned where required to estimate revenue.
- Any overlaps or inconsistencies are reviewed and adjusted to maintain accuracy (<5% variance threshold).
- The result is a structured dataset that allows for clear comparison across regions and supports reliable analysis and forecasting.
Structured Market Dataset, USD Mn/Bn
| Region | Segment | VolumeUnits | Avg PriceUSD | RevenueUSD Mn | Share % |
|---|---|---|---|---|---|
| North America | Product A | 250 | 2.5 | 500 | 15% |
| Product A | XX | XX | XX | XX | |
| Product A | XX | XX | XX | XX | |
| Consistent methodology applied across regions | |||||
4. Market Estimation
Step 4: TOP-DOWN APPROACH
- We start with the overall market size at a global or macro level.
- The market is then narrowed down based on scope and industry relevance.
- We apply penetration rates and split the data by region and segment.
- This helps us estimate the market size for specific segments.
- The numbers are validated through cross-checks to ensure accuracy.
Step 5: BOTTOM-UP APPROACH
- We begin by analyzing data from leading companies in the market.
- Revenue data is collected and mapped across different segments.
- The data is then aggregated to estimate the total market size.
- To fill in any gaps, adjustments are made based on industry standards.
- Validation checks make sure that the results are correct.
5. Forecasting
Step 6:
At Polaris Market Research & Consulting, Inc., we employ a methodical forecasting strategy. This approach blends the analysis of historical data with real-time market validation. To forecast future trends with precision, we examine past patterns, pricing fluctuations, and the interplay of supply and demand. To ensure our conclusions reflect the present market landscape, we actively seek input from industry experts and key stakeholders.
To refine our predictions, we carefully consider critical elements such as market drivers and restraints, fluctuations in raw material costs, emerging technologies, and the production capabilities of various regions. Furthermore, we assess regulatory frameworks and potential policy shifts to gauge their potential impact on market expansion.
All this information is synthesized to generate precise forecasts for each segment and region. These forecasts illuminate the current state of the market and highlight forthcoming opportunities.
6. Validation & Triangulation
Step 7:
In the final stage, we validate all our estimates using a triangulation method, where data is cross-checked from multiple reliable sources, like company data, primary interviews, and secondary research. This helps us make sure that our numbers are correct and fit with the rest of the market.
This process involves verifying data consistency across various segments and geographic areas. It also requires comparing historical trends with the assumptions support the forecast. Any discrepancies involve adjustments to ensure everything remains aligned and dependable.
Once the data is finalized, we prepare the final outputs, including market size estimates, segment-wise breakdowns, and growth metrics. These are delivered in structured formats such as tables, charts, and data files for easy analysis and use.
We collaborate closely with clients, ensuring the final products align with their requirements. This includes offering tailored adjustments, supplementary data analyses, and continuous assistance. Furthermore, we monitor market trends post-delivery, providing updates and refinements to maintain the insights' relevance as time passes.
Triangulation Framework
Estimates are cross-verified across three sources:
Company-level data
• Primary inputs from industry participants
• Secondary benchmarks and published data
Variance maintained within +5-10%
Adjustments applied to align estimates
Segment values validated against overall market structure
Data Consistency & Integrity
Segment totals validated to 100%
Regional estimates aligned with global market size
Historical trends compared against forecast outputs
Assumptions reviewed for cross-segment and regional alignment
Final Outputs
Deliverables
Client Alignment & Support
- Deliverables are aligned with defined client requirements and scope
- Custom data cuts and segment splits are incorporated as required
- Post-delivery queries are addressed through analyst interactions
- Additional clarifications and data support are provided upon request
Client Continuity & Updates
- Market developments are tracked post-delivery to capture changes in key trends
- Updated data and revisions are provided based on new market inputs
- Additional refinements and data cuts are shared as required
- Continued analyst engagement supports evolving client requirements
Download Sample Report of Blood Meal Marke
Please fill out the form to request a customized copy of the research report.
