
Commodity Plastics Market Share, Size, Trends, Industry Analysis Report, 2025 - 2034
REPORT DETAILS
Commodity Plastics Market Summary
The global commodity plastics market size was valued at USD 567.94 billion in 2024. The market is projected to grow from USD 598.58 billion in 2025 to USD 1,038.06 billion by 2034. It is projected to exhibit a CAGR of 6.3% from 2025 to 2034. The extensive usage of these plastics in a broad range of applications, such as magnetic tapes, garbage containers, photography, and clothing, is driving the market growth.
Market Statistics
Key Takeaways
- The polyethylene (PE) segment led the market with a significant revenue share in 2024.
- The packaging segment dominated the market with a notable share due to packaging playing a crucial part in safeguarding commodities from impairing and damage in each sector.
- Asia Pacific led the market with extensive revenue share in 2024 due to the notable funding by governments of several emerging countries to strengthen their skilled labor has encouraged several plastic manufacturing and processing firms from the West to set up their base in the region.
- North America emerged as the region with notable income distribution due to robust emphasis on innovation, strong manufacturing framework, and elevated usage of commodity plastics such as PE, PVC, and PP.
Industry Dynamics
- The packaging industry has observed significant growth because of changing consumer lifestyles and consumption habits, technological advancements in packaging, and the surge of e-commerce.
- Many governments globally have initiated strict directives on vehicle emissions and fuel efficiency, which has caused the increased production of EVs that are cleaner and provide a more eco-friendly conveyance alternative, fueling the market expansion.
- The growing costs of metals have encouraged manufacturers across various industries to look for alternative materials such as plastics, creating an opportune space for the market to grow.
- The growing concerns about ecological sustainability may create challenges for the growth of the market.
Source: Polaris Market Research Analysis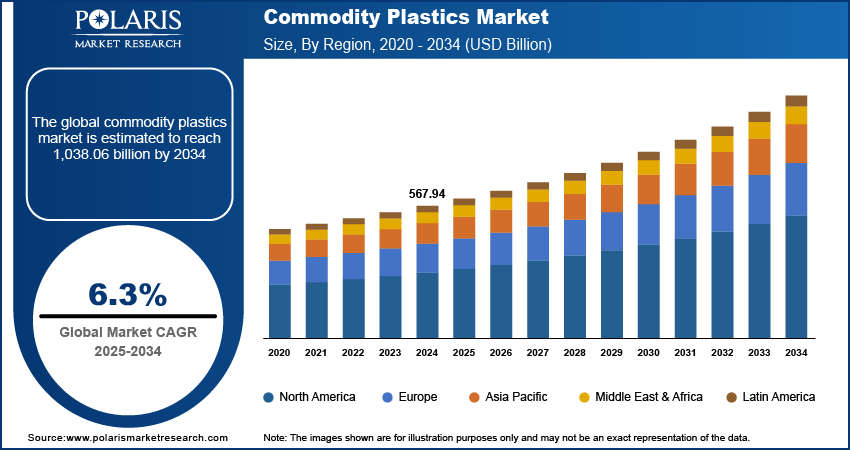
To Understand More About this Research: Download Sample Report
Commodity plastics are inexpensive plastics with broad applicability across various industries. These plastics are used in a wide range of applications, including garbage containers, magnetic tapes, photography, and clothing.
The commodity plastics market growth is primarily fueled by the increased usage of these plastics in flexible packaging, automobile parts, and other consumable products. The desirable properties of commodity plastics, including high durability and enhanced moisture resistance, also contribute to their growing demand. The constantly rising need for long-lasting light materials in the construction industry further drives the expansion of the market.
The rising prices of metals have prompted manufacturers across various industries to seek alternative materials such as plastics, a trend expected to drive the commodity plastics market development in the coming years. The shift towards the utilization of bio-based plastics due to fluctuating crude oil prices and rising awareness about the environmental pollution caused by fossil fuels is also expected to create several market opportunities during the projection period.
Commodity Plastics Market Dynamics
Growing Packaging Industry
The packaging industry has witnessed significant growth in recent times, driven by shifting consumer lifestyles and consumption patterns, technological advances in packaging, and the rise of e-commerce. Commodity plastics are widely used in many different types of packaging such as food packaging, non-packaging, and medical flexible packaging, as they are cost-effective, lightweight, and durable. These plastics can also be molded into different shapes and are easy to decorate and print on, making them important print marketing material. Thus, with the growing packaging industry, the commodity plastics market demand is rising.
Rising Adoption of Electric Vehicles
Several governments worldwide have introduced stringent regulations on vehicle emissions and fuel efficiency. These regulations have led to increased production of electric vehicles (EVs), which are a cleaner and more environmentally friendly transportation option. They have also compelled original equipment manufacturers (OEMs) to adopt lightweight materials such as plastics in EV manufacturing. The use of plastics reduces vehicle battery consumption, as less weight takes less energy during acceleration. Thus, the growing adoption of EVs is boosting the commodity plastics market revenue.
Source: Polaris Market Research Analysis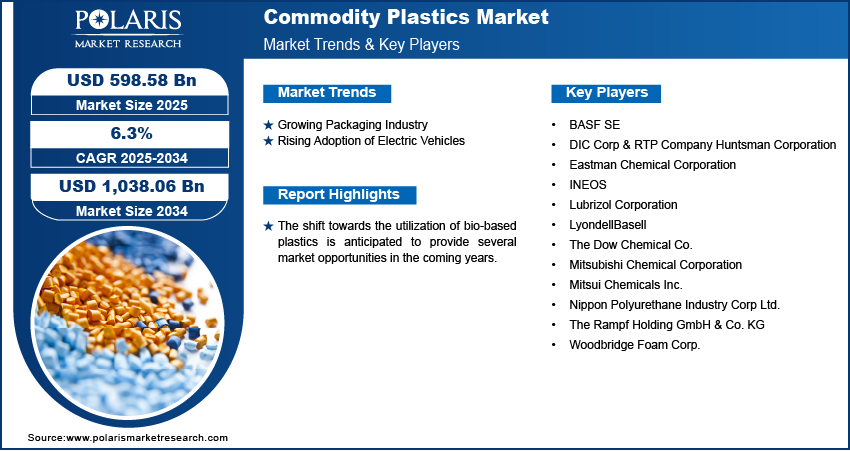
Commodity Plastics Market Segment Insights
Commodity Plastics Market Assessment by Product
The commodity plastics market, based on product, is segmented into polypropylene (PP), polyethylene (PE), polyvinyl chloride (PVC), polyethylene terephthalate (PET), polystyrene (PS), and others. The polyethylene (PE) segment held a significant revenue share of 35.9% in 2024. The versatility, durability, low density, and excellent chemical resistance of PE commodity plastics have resulted in their extensive use across various industries. PE is widely used in the manufacturing of bags, containers, and films for the packaging industry. In addition, there is a high demand for PE in the construction sector for piping and plumbing applications owing to their durability and longevity.
Commodity Plastics Market Evaluation by End-Use Industry
The commodity plastics market segmentation, based on the end-use industry, includes automotive, consumer goods, electronics, packaging, pharmaceuticals, and textiles. The packaging segment dominated the market with a revenue share of 41.8% in 2024, owing to the crucial role packaging plays in protecting products from spoiling and damage in every sector. The increased demand for flexible packaging has also boosted the adoption of commodity plastics in the packaging industry. Further, rising emphasis on sustainability and increased demand for bio-based polymers propels the robust growth of the segment.
Source: Polaris Market Research Analysis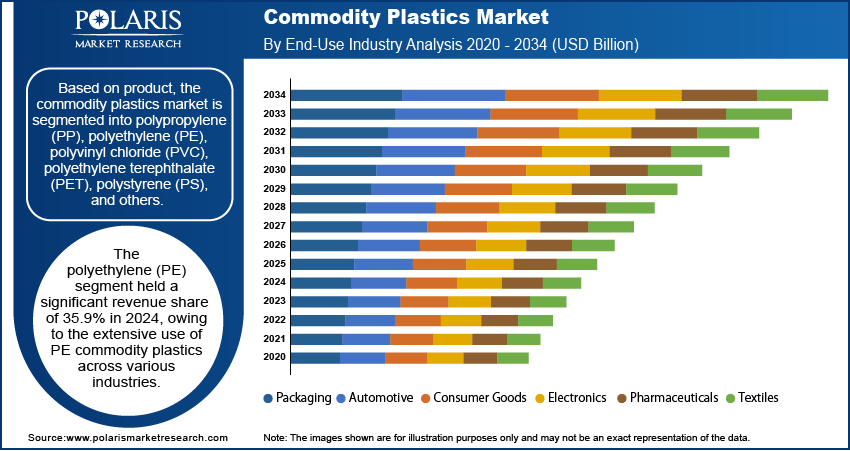
Commodity Plastics Market Regional Analysis
By region, the market report offers commodity plastics market insights into North America, Europe, Asia Pacific, Latin America, and the Middle East & Africa. Asia Pacific led the market with a revenue share of 50.9% in 2024. The significant investments by governments of many emerging nations to strengthen their skilled workforce have prompted many plastic manufacturing and processing companies from the West to establish their base in the region. The rapid growth of the e-commerce industry also contributes to the robust regional market demand.
The commodity plastics market in North America accounted for a significant market share in 2024. Key factors driving market demand in the region are a strong emphasis on innovation, robust manufacturing infrastructure, and the high use of commodity plastics such as PE, PVC, and PP. In addition, major auto companies in North America have integrated polymer technology into automotive manufacturing to improve vehicle performance and fuel efficiency, positively impacting market growth in the region.
Source: Polaris Market Research Analysis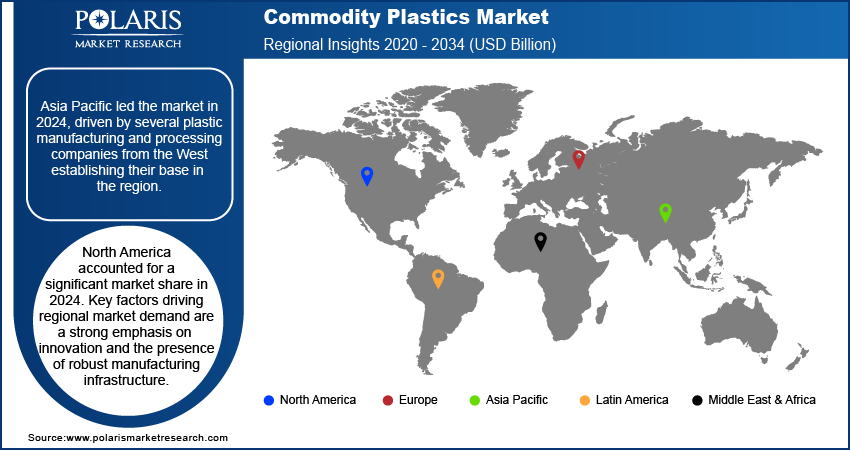
Commodity Plastics Market – Key Players and Competitive Insights
The commodity plastics industry is fragmented, with several small and medium-sized companies. The leading market players are making significant investments in R&D to extend their product lines. They are also undertaking several strategic initiatives, such as mergers and acquisitions and partnerships, to improve their global reach. To expand and survive in a more competitive environment, market participants must offer innovative solutions.
In recent years, the market for commodity plastics has witnessed several technological and innovation breakthroughs, with key players seeking to provide advanced solutions that help meet sustainability goals. The commodity plastics market research report offers a market assessment of all the key players, including BASF SE, Mitsui Chemicals Inc., Eastman Chemical Corporation, INEOS, Mitsubishi Chemical Corporation, DIC Corp & RTP Company Huntsman Corporation, LyondellBasell, The Dow Chemical Co., Nippon Polyurethane Industry Corp Ltd., Woodbridge Foam Corp., Lubrizol Corporation, and The Rampf Holding GmbH & Co. KG.
List of Key Players in Commodity Plastics Market
- BASF SE
- DIC Corp & RTP Company Huntsman Corporation
- Eastman Chemical Corporation
- INEOS
- Lubrizol Corporation
- LyondellBasell
- The Dow Chemical Co.
- Mitsubishi Chemical Corporation
- Mitsui Chemicals Inc.
- Nippon Polyurethane Industry Corp Ltd.
- The Rampf Holding GmbH & Co. KG
- Woodbridge Foam Corp.
Commodity Plastics Market Developments
In November 2025, Fresh Del Monte Produce Inc., a leading producer of high-quality fruits and vegetables, partnered with Arena Packaging to launch Reusable Plastic Containers (RPCs) specifically for bananas. The initiative aims to extend banana shelf life, reduce operational costs, and lower carbon emissions.
In October 2025, Coca-Cola India rolled out Coca-Cola in 100% recycled PET (rPET) bottles, manufactured by SLMG Beverages Ltd. and Moon Beverages Ltd., supporting a greener and more sustainable future in India.
In September 2025, China’s rapid growth in ethylene production is expected to impact global commodity plastics markets. With over 54 million tonnes per year of capacity currently online and plans to increase output by 9% by 2030, the surge could create oversupply, pressuring global prices and intensifying competition. This expansion may pose challenges for U.S. and European chemical producers already grappling with weak demand.
In February 2025, Ecolab and TotalEnergies introduced a new plastic packaging solution made from recycled materials, promoting sustainability in the heavy-use packaging sector. The companies stated that this solution aligns with the European Union’s circular economy commitments.
In October 2024, Arkema introduced bio-based ethyl acrylate produced from sustainably sourced bioethanol. With a 40% biocarbon content (BCC), the product delivers a 30% reduction in carbon footprint. Targeted at growing sectors like new energies, e-mobility, living comfort, and building efficiency, this launch strengthens Arkema’s portfolio of bio-based and lower-carbon specialty acrylic resins and additives.
Commodity Plastics Market Segmentation
By Product Outlook (Revenue – USD Billion, 2020–2034)
- Polyethylene (PE)
- Polypropylene (PP)
- Polyvinyl Chloride (PVC)
- Polyethylene Terephthalate (PET)
- Polystyrene (PS)
- Others
By End-Use Industry Outlook (Revenue – USD Billion, 2020–2034)
- Automotive
- Consumer Goods
- Electronics
- Packaging
- Pharmaceuticals
- Textiles
By Regional Outlook (Revenue – USD Billion, 2020–2034)
- North America
- US
- Canada
- Europe
- Germany
- France
- UK
- Italy
- Spain
- Netherlands
- Russia
- Rest of Europe
- Asia Pacific
- China
- Japan
- India
- Malaysia
- South Korea
- Indonesia
- Australia
- Rest of Asia Pacific
- Middle East & Africa
- Saudi Arabia
- UAE
- Israel
- South Africa
- Rest of the Middle East & Africa
- Latin America
- Mexico
- Brazil
- Argentina
- Rest of Latin America
Commodity Plastics Market Report Scope
| Report Attributes | Details |
| Market Size Value in 2024 | USD 567.94 billion |
| Market Size Value in 2025 | USD 598.58 billion |
| Revenue Forecast by 2034 | USD 1,038.06 billion |
| CAGR | 6.3% from 2025 to 2034 |
| Base Year | 2024 |
| Historical Data | 2020–2023 |
| Forecast Period | 2025–2034 |
| Quantitative Units | Revenue in USD billion and CAGR from 2025 to 2034 |
| Report Coverage | Revenue Forecast, Market Competitive Landscape, Growth Factors, and Industry Trends |
| Segments Covered |
|
| Regional Scope |
|
| Competitive Landscape |
|
| Report Format |
|
| Customization | Report customization as per your requirements with respect to countries, regions, and segmentation. |
Source: Polaris Market Research Analysis
Commodity Plastics Market FAQ's
• The market was valued at USD 567.94 billion in 2024 and is projected to grow to USD 1,038.06 billion by 2034.
• The market is projected to register a CAGR of 6.3% from 2025 to 2034.
• Asia Pacific accounted for the largest region-wise market size in 2024.
• A few of the key players in the market are BASF SE; Mitsui Chemicals Inc.; Eastman Chemical Corporation; INEOS; Mitsubishi Chemical Corporation; DIC Corp & RTP Company Huntsman Corporation; LyondellBasell; The Dow Chemical Co.; Nippon Polyurethane Industry Corp Ltd.; Woodbridge Foam Corp.; Lubrizol Corporation; and The Rampf Holding GmbH & Co. KG.
• The polyethylene (PE) segment accounted for the largest market share in 2024.
• The packaging segment dominated the market for commodity plastics in 2024.
Download Sample Report of Commodity Plastics Market
Please fill out the form to request a customized copy of the research report.
