
Farm Equipment Market Size, Share & Trends Analysis Report, 2025-2034
REPORT DETAILS
Farm Equipment Market Summary
The global farm equipment market size was valued at USD 169.94 billion in 2024. The farm equipment industry is projected to grow from USD 178.81 billion in 2025 to USD 285.66 billion by 2034, exhibiting a CAGR of 5.3% during 2025–2034.
Market Statistics
Farm equipment refers to machinery and tools used in agriculture to assist with tasks such as planting, cultivating, and harvesting crops, as well as managing livestock. These tools help increase efficiency, reduce labor, and improve productivity on farms.
The growing global population demands more food, leading to an increased focus on boosting agricultural productivity. To meet this demand, farmers are adopting advanced farm equipment designed to enhance crop growth efficiency. High-tech machines such as seeders, harvesters, and sprayers ensure faster and more precise farming processes. Modern equipment helps maximize crop output while minimizing losses and delays. Increased yields from using advanced machinery make farm equipment a critical investment for farmers, driving substantial demand for these tools in the agricultural sector.
Source: Polaris Market Research Analysis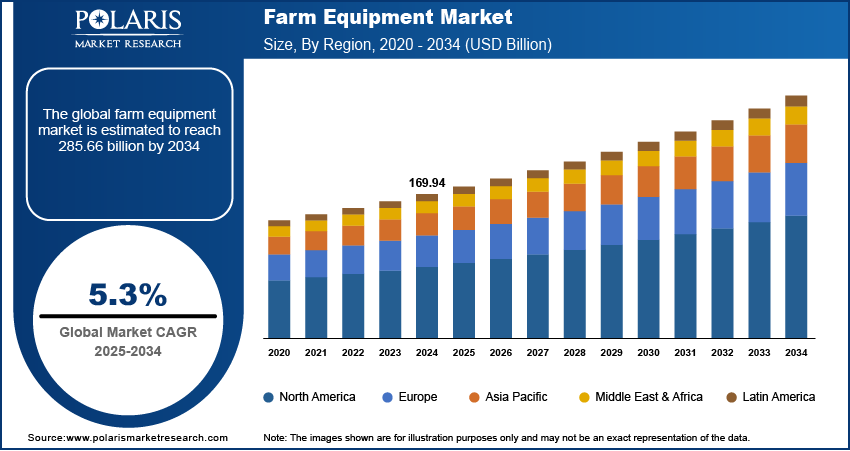
To Understand More About this Research: Download Sample Report
Technological innovations in farm equipment have revolutionized agriculture practices. The introduction of precision farming tools, such as GPS, sensors, and automated machinery, allows farmers to monitor and manage crops with great accuracy. These advancements help optimize resource usage, improve crop yields, and reduce waste. Additionally, AI-driven machinery and robotics are being used to automate repetitive tasks, lowering the need for manual labor and improving overall farm efficiency. Farmers are increasingly relying on these tools to stay competitive as technology continues to evolve, thereby driving the farm equipment market growth.
Market Dynamics
Labor Shortage in Agriculture
The agriculture labor employment worldwide is declining, due to which many agriprenuers are shifting to automated solutions such as farm equipment. According to the World Bank, in India alone, agriculture employment decreased to 42.86% of the total population in 2022 from 58% in 2002, showcasing the shortage of labor in the agriculture sector. Urbanization is a key factor contributing to this shortage, as people migrate to cities in search of better job opportunities. In response, farmers are turning to farm equipment that performs tasks previously handled by large workforces. Thus, the rising labor shortage in agriculture is propelling the farm equipment market demand.
Rising Push Toward Sustainable Farming
Sustainable farming practices are becoming more important as environmental concerns grow. Farmers are increasingly adopting eco-friendly equipment designed to reduce carbon emissions, minimize water usage, and limit pesticide runoff. New equipment that conserves water and reduces soil disturbance is gaining popularity among environmentally conscious farmers. The demand for energy-efficient machinery, such as electric tractors or precision sprayers, is also rising. Additionally, governments worldwide are pushing for greener agricultural practices through various incentives and fund schemes such as the Government of India launched the National Mission for Sustainable Agriculture (NMSA), in which USD 131.56 billion in funds were provided as of 2024. This government push toward sustainable farming is driving the need for modern farm equipment that supports these objectives, thereby boosting the farm equipment market development.
Source: Polaris Market Research Analysis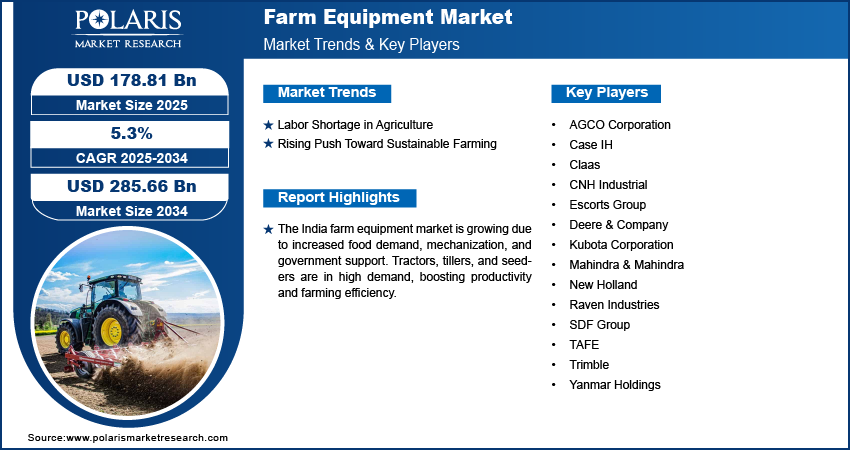
Segment Analysis
Market Assessment by Product Outlook
The farm equipment market segmentation, based on product, includes tractors, harvesters’ machinery, planting equipment, spraying equipment, and others. The tractor segment is expected to witness significant growth during the forecast period. Tractors are essential for a wide range of farming activities, including plowing, planting, and harvesting. The demand for advanced tractors equipped with modern technologies, such as GPS and automation, is rising as farmers seek ways to increase efficiency and productivity. These innovations make farming processes faster and more precise, allowing farmers to handle larger areas of land. The growing need for greater productivity and labor-saving solutions is driving the segmental growth.
Market Evaluation by Application Outlook
The farm equipment market segmentation, based on application, includes land development & seed bed preparation, sowing & planting, weed cultivation, plant protection, harvesting & threshing, and post-harvest & agro-processing. The land development & seed bed preparation segment dominated the farm equipment market share in 2024 as it contains vital tasks such as plowing, tilling, and preparing the soil for planting. Proper land development is key to improving soil quality and creating the best growing conditions for crops. Specialized equipment such as plows, cultivators, and tillers are used to break up the soil and form a seedbed that supports healthy crop growth. The ongoing focus on increasing crop yields and improving soil management has led to a high demand for equipment for land development and seedbed preparation, thereby boosting the segmental growth.
Source: Polaris Market Research Analysis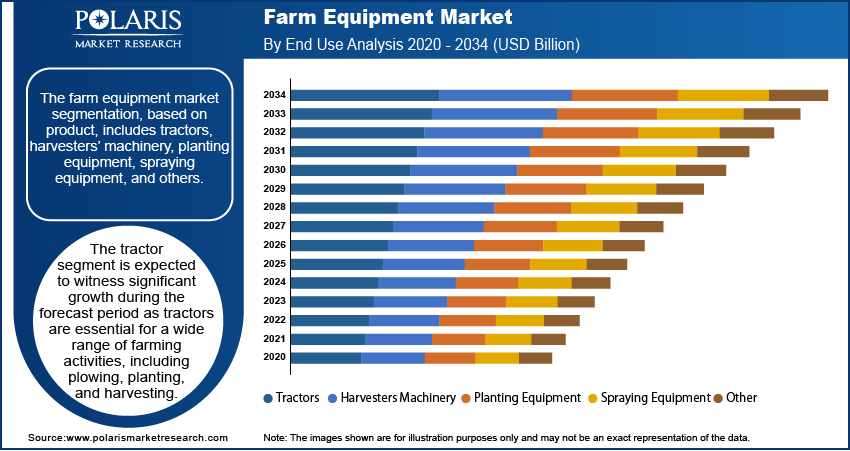
Regional Analysis
By region, the study provides the farm equipment market insights into North America, Europe, Asia Pacific, Latin America, and the Middle East & Africa. In 2024, North America dominated the farm equipment market revenue due to advanced farming techniques and large-scale agricultural operations. Farmers in this region widely adopt modern, high-tech machinery, such as tractors, harvesters, and precision farming tools, to increase productivity and efficiency. The growing focus on sustainable farming practices and the need for labor-saving solutions further propel the demand for farm equipment in the region. Government subsidies and support programs encourage the use of advanced farm machinery, thereby fueling the farm equipment market expansion in North America.
According to the farm equipment market statistics, Asia Pacific is expected to record a significant share during the forecast period. Rapid urbanization and increasing population, leading to the need for higher agricultural productivity, are driving the demand for farm equipment. Countries such as China, Japan, and Australia are increasing the adoption of modern machinery to boost crop yields and improve farming efficiency. The demand for advanced farming equipment is growing as farmers are seeking to optimize land use and increase output. Government support, technological advancements, and innovations in machinery are further fueling the farm equipment market growth in Asia Pacific.
The farm equipment market in India is experiencing substantial growth due to a large agricultural sector and increasing demand for food products. There is a growing shift toward mechanization in states with more developed agriculture. Tractors, tillers, and seeders are in high demand as farmers are focusing on reducing labor dependency and addressing land fragmentation. Government initiatives promoting mechanization and subsidies for farm equipment further support this shift, thereby creating lucrative farm equipment market opportunities in India.
Source: Polaris Market Research Analysis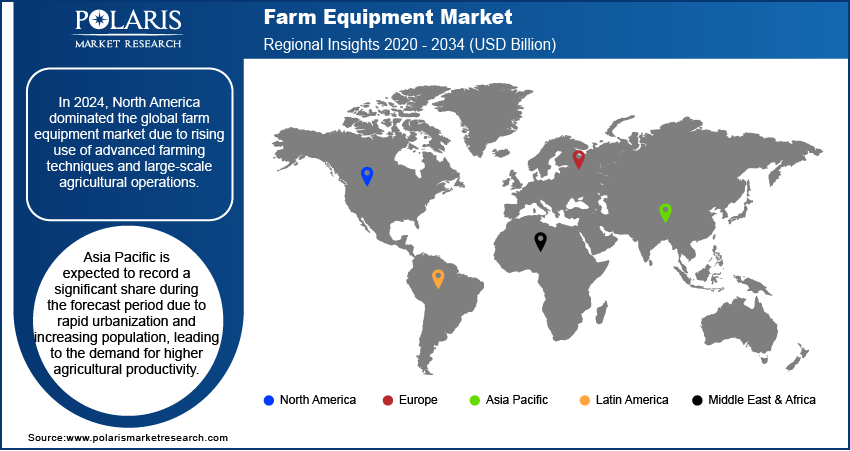
Key Players & Competitive Analysis Report
The farm equipment market ecosystem is constantly evolving, with numerous companies striving to innovate and distinguish themselves. Major global corporations dominate the market by leveraging extensive research and development, and advanced techniques. These companies pursue strategic initiatives such as mergers and acquisitions, partnerships, and collaborations to enhance their product offerings and expand into new markets.
New companies are impacting the farm equipment market trends by introducing innovative products to meet the demand of specific market sectors. This competitive environment is amplified by continuous progress in product offerings. A few major players in the farm equipment market include AGCO Corporation, Case IH, Claas, CNH Industrial, Escorts Group, Deere & Company, Kubota Corporation, Mahindra & Mahindra, New Holland, Raven Industries, SDF Group, TAFE, Trimble, and Yanmar Holdings.
Trimble Inc., founded in 1978, is an American technology company providing software, hardware, and services that integrate the digital and physical worlds. Its core technologies encompass positioning, modeling, connectivity, and data analytics, with solutions aimed at improving productivity, quality, safety, transparency, and sustainability across various industries. The company's product range includes GNSS receivers, scanners, total stations, laser rangefinders, UAVs, and inertial navigation systems, alongside software processing tools available through subscription, term, and perpetual licenses. Trimble serves diverse sectors by offering tools to measure, build, grow, and move assets. A key area of focus is agriculture, where Trimble Agriculture provides precision solutions designed to address technological challenges throughout the agricultural supply chain. These solutions enable farmers to optimize resource allocation for a reliable and safe food supply while promoting environmental sustainability. The agriculture product line includes guidance and steering systems, flow and application controls, water management tools, planting solutions, nutrient management, and crop protection technologies. Trimble’s solutions are versatile, accommodating various seasons, crops, terrains, and farm sizes, and are compatible with equipment from most manufacturers. The Connected Farm concept represents Trimble’s intention to offer a suite of precision solutions for modern agricultural management. Operating globally, Trimble has a significant presence across numerous countries, including the US, Sweden, Germany, Finland, New Zealand, Canada, the Netherlands, China, the UK, and India.
Kubota Corporation, founded in 1890 and based in Osaka, Japan, operates as a multinational manufacturing and technology company. Publicly listed on the Tokyo Stock Exchange, Kubota's activities encompass agricultural machinery, construction equipment, engines, and environmental solutions. Originating as a foundry, Kubota expanded into agriculture with kerosene engines in 1922 and later contributed to 3D graphics chips and the Solar Ark project. The company's product line includes tractors, combine harvesters, construction equipment, engines ranging from 0.276-liter to 6.1-liter, vending machines, pipes, valves, cast metal, pumps, and systems for water purification, sewage treatment, and air conditioning. Kubota is involved in both rice and dry-field farming, developing technologies and equipment to support food production. The company is also engaged in smart agriculture, integrating data and automation to improve farming practices. The Agri Robo series features automated tractors, combine harvesters, and transplanters for rice farming. The Kubota Smart Agri System (KSAS) employs technologies and ICT to support farm operations, visualizing agricultural data for management. Kubota maintains a global presence with manufacturing facilities in Japan, the USA, Germany, France, China, and Thailand. The company distributes its products across Europe, North America, Latin America, Oceania, Asia, and Africa. Kubota Tractor Corporation manages the distribution of Kubota products in the United States. Kubota's activities in water and environment systems include ductile iron pipes, valves, pumps, and sewage treatment plants.
List of Key Companies
- AGCO Corporation
- Case IH
- Claas
- CNH Industrial
- Escorts Group
- Deere & Company
- Kubota Corporation
- Mahindra & Mahindra
- New Holland
- Raven Industries
- SDF Group
- TAFE
- Trimble
- Yanmar Holdings
Industry Developments
In February 2025, AGCO unveiled enhanced features for its Fendt e100 Vario electric tractor, increasing both battery capacity and operational runtime to support longer fieldwork. The upgraded model underscores the company’s commitment to advancing sustainable, low-emission farming practices.
In January 2025, John Deere revealed several new autonomous equipment during a press conference at CES 2025 to support customers in agriculture, construction, and commercial landscaping.
In September 2024, AGCO announced to acquire Trimble Inc., a firm specializing in advanced robotics technologies, thereby enhancing its automation capabilities in the agricultural sector. This strategic move is aimed at integrating advanced robotics solutions into AGCO's existing suite of precision farming tools.
Market Segmentation
By Product Outlook (Revenue – USD Billion, 2020–2034)
- Tractors
- Harvesters Machinery
- Planting Equipment
- Spraying Equipment
- Others
By Application Outlook (Revenue – USD Billion, 2020–2034)
- Land Development & Seed Bed Preparation
- Sowing & Planting
- Weed Cultivation
- Plant Protection
- Harvesting & Threshing
- Post-harvest & Agro-processing
By Regional Outlook (Revenue – USD Billion, 2020–2034)
- North America
- US
- Canada
- Europe
- Germany
- France
- UK
- Italy
- Spain
- Netherlands
- Russia
- Rest of Europe
- Asia Pacific
- China
- Japan
- India
- Malaysia
- South Korea
- Indonesia
- Australia
- Rest of Asia Pacific
- Middle East & Africa
- Saudi Arabia
- UAE
- Israel
- South Africa
- Rest of Middle East & Africa
- Latin America
- Mexico
- Brazil
- Argentina
- Rest of Latin America
Report Scope
| Report Attributes | Details |
| Market Size Value in 2024 | USD 169.94 billion |
| Market Size Value in 2025 | USD 178.81 billion |
| Revenue Forecast by 2034 | USD 285.66 billion |
| CAGR | 5.3% from 2025–2034 |
| Base Year | 2024 |
| Historical Data | 2020–2023 |
| Forecast Period | 2025–2034 |
| Quantitative Units | Revenue in USD billion and CAGR from 2025 to 2034 |
| Report Coverage | Revenue Forecast, Market Competitive Landscape, Growth Factors, and Trends |
| Segments Covered |
|
| Regional Scope |
|
| Competitive Landscape |
|
| Report Format |
|
| Customization | Report customization as per your requirements with respect to countries, regions, and segmentation. |
Source: Polaris Market Research Analysis
Farm Equipment Market FAQ's
The market size was valued at USD 169.94 billion in 2024 and is projected to grow to USD 285.66 billion by 2034.
The global market is projected to register a CAGR of 5.3% during the forecast period.
North America held the largest share of the global market in 2024.
A few key players in the market are AGCO Corporation, Case IH, Claas, CNH Industrial, Escorts Group, John Deere & Company, Kubota Corporation, Mahindra & Mahindra, New Holland, Raven Industries, SDF Group, TAFE, Trimble, and Yanmar Holdings.
The land development & seed bed preparation segment dominated the market in 2024 as it contains vital tasks such as plowing, tilling, and preparing the soil for planting.
The tractor segment is expected to witness significant growth during the forecast period as tractors are essential for a wide range of farming activities, including plowing, planting, and harvesting.
Download Sample Report of Farm Equipment Market
Please fill out the form to request a customized copy of the research report.
