
Floating Storage and Regasification Unit Market Size, Share, and Forecast 2026 to 2034
REPORT DETAILS
Floating Storage and Regasification Unit Market Summary
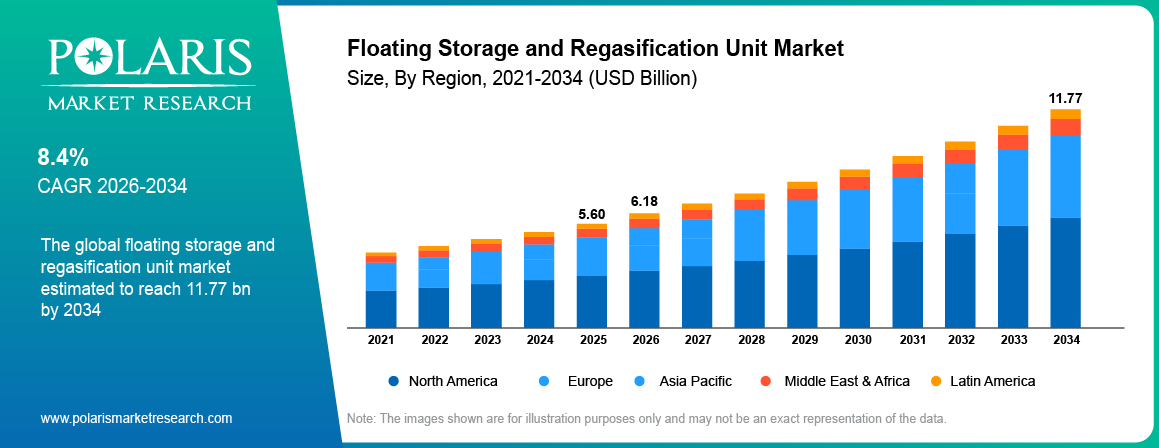
According to Polaris Market Research analysis, the floating storage and regasification unit market was valued at USD 5.60 Billion in 2025. It is projected to reach USD 11.77 Billion by 2034, growing at a CAGR of 8.4% from 2026 to 2034. Demand is driven by energy security programs in importing countries, power shortages in emerging economies, and how quickly a floating terminal can start work compared with a land terminal. Converted vessels earn the largest construction revenue, while newbuild units are gaining ground as buyers order larger ships for longer contracts. Supply spans the vessels, regasification equipment, conversion yards, and charter services that turn liquefied natural gas into pipeline gas at the shore. Europe is the leading market. Asia Pacific is the fastest growing region.
Market Statistics
Key Takeaways
- Europe brought in 32.4% of 2026 revenue, led by Germany, Italy, and Poland as buyers replaced pipeline gas with imported cargoes.
- Asia Pacific is the fastest growing region, at a CAGR of 11.9% from 2026 to 2034, owing to gas for power in Vietnam, the Philippines, Bangladesh, and India.
- Converted FSRU retained 54.3% of 2026 construction revenue, attributed to the lower cost and quicker delivery of rebuilt LNG carriers.
- Newbuild FSRU is the quickest construction type to scale, with a CAGR of 10.5% through 2034, as charterers move toward purpose built ships.
- The mid size storage class earned USD 3,375 Million in 2026, the largest storage total, since vessels of this size fit most existing jetties and ship schedules.
- Long Term Charter led contract model revenue with 61.9% in 2026, due to import terminals that sign for ten years or longer.
- Revenue from LNG Bunkering and Other Uses is projected to grow at a CAGR of 14.3% from 2026 to 2034, as ports now use floating units to fuel ships.
- Power Generation led application revenue with 49.9% in 2026, since gas plants in import dependent countries have no pipeline to rely on.
- Offshore Moored units expand faster than any other deployment type, since sites with shallow water or crowded ports cannot host a jetty.
Note: Figures and projections outlined in this report are the result of Polaris Market Research’s proprietary analytical processes, grounded in the latest available datasets and market observations.
Floating Storage and Regasification Unit Market Definition
The floating storage and regasification unit market covers vessels that store liquefied natural gas (LNG) and convert it back to gas for delivery to pipelines or power plants at the shore. It spans converted and newbuild floating storage and regasification units (FSRU), together with the charter, conversion, and operating services sold with them.
Counted products include newbuild FSRU vessels, LNG carriers converted to FSRU service, regasification modules, mooring and gas export systems sold with the vessel, and time charter or operating revenue. Land based terminals and floating liquefaction units are excluded. This keeps the market a fraction of the broader liquefied natural gas market. Floating storage units without regasification equipment sit outside the boundary.
An FSRU works in four steps. Carriers moor alongside and transfer LNG into the vessel tanks. The cargo is held at about minus 162 degrees Celsius, pumps and vaporizers heat it back into gas, and a gas arm or pipeline carries the gas to shore. Different vendors often supply the ship, the regasification equipment, and the port connection; as a result, a project may involve five or six contractors.
Scale demonstrates how fast floating terminals have spread. Brazil raised LNG import capacity from 2.5 billion cubic feet a day in 2020 to 5.1 billion in August 2025, according to the United States Energy Information Administration. Most of the added capacity sits on floating units. Poland, Germany, Egypt, and several Asian importers have followed the same path.
Comparison of FSRUs and Land Based LNG Terminals: Key Differences
| Attribute | Floating Storage and Regasification Units | Land Based LNG Terminals |
| Construction time | Months to two years, including conversion | Three to five years for tanks and jetties |
| Capital outlay | Mostly charter payments over the contract term | Large upfront spending by the owner |
| Site needs | Sheltered water, a mooring, and a gas link | Land, tank pits, and marine works |
| Flexibility | Vessel can be moved when demand shifts | Fixed asset for forty years |
| Storage size | Limited by vessel tanks | Can be expanded with more tanks |
| Growth direction | Fast, as buyers seek quick supply | Steady, in large markets with long term demand |
Source: Polaris Market Research Analysis
Shore terminals retain appeal in markets with heavy cargo volumes and demand persisting for decades, since a national hub receiving several cargoes each week justifies permanent tanks and a breakwater. Importers that require gas urgently, or that are uncertain about long term demand, gain considerably more from a floating unit, and some importers run both types in parallel.
Porter's Five Forces Analysis
| Force | Intensity | Rationale |
| Bargaining power of suppliers | Moderate to High | Shipyards, tank designers, and regasification module makers form a small group, and yard slots for conversions are limited. |
| Bargaining power of buyers | Moderate | State gas companies and utilities sign long charters and negotiate hard, yet the supply of available vessels is thin, limiting price pressure. |
| Threat of new entrants | Low to Moderate | Owning an FSRU needs capital, port approvals, and operating records, although financiers back new fleets for charters. |
| Threat of substitutes | Moderate | Land terminals and pipelines compete in large markets, and renewables cut the need for gas fired power in some countries. |
| Competitive rivalry | High | A handful of owners compete for every tender on price, delivery date, and availability. |
Source: Polaris Market Research Analysis
Concentration among suppliers is the main structural issue here. A few yards and tank designers handle nearly every conversion and newbuild; as a result, owners book yard slots early and buy second hand carriers before projects are awarded.
Market Dynamics
Driver Impact Analysis
| Driver | Impact on Market Growth | Time Horizon |
| Energy security programs in importing countries | High | Short to Medium Term |
| Fast power supply for emerging economies | High | Medium Term |
Source: Polaris Market Research Analysis
Driver: Energy Security Programs Are Replacing Pipeline Gas With Imported Cargoes, Creating Market Demand
Governments in Europe and elsewhere seek diversified gas sources, because a single pipeline can be interrupted by political disputes or technical failure. A floating terminal allows a country to receive cargoes from numerous suppliers within a year, and the same vessel can be redeployed when requirements change. The small scale LNG market study covers the smaller cargoes that move on from such terminals.
For example, in December 2025, Germany had FSRU terminals operating at Mukran, Wilhelmshaven, and Brunsbuettel, with the Mukran site able to reach 13.5 billion cubic meters a year at full capacity. The Brunsbuettel vessel returned on 24 November after upgrades, and a Stade terminal was not expected before the second quarter of 2026.
Europe is projected to grow at a CAGR of 6.2% from 2026 to 2034, since new terminals in Poland, Greece, and the Netherlands supplement existing infrastructure. Charter owners with uncommitted vessels gain most, as customers prefer proven ships with short lead times.
Driver: Quick Delivery Is Letting Emerging Economies Add Gas Supply Faster Than Land Terminals, Creating Market Demand
Emerging economies often require gas for power long before they can fund a land terminal. A floating unit can start work in months since the ship already exists, and the buyer pays through a charter rather than a large upfront sum. That makes the option attractive to countries with limited borrowing space.
For example, in February 2026, Energos Infrastructure was offering FSRUs for charter beginning in 2027 and 2028, a route to supply that avoids a multiyear terminal build. Apollo controls the company.
Short Term Charter is projected to grow at a CAGR of 12.3% from 2026 to 2034, as first time importers evaluate demand before committing to a long contract. Owners holding spare vessels benefit considerably, since every idle month represents forgone revenue.
Restraint: Weak Gas Power Plans and High Charter Costs Are Delaying Projects, Limiting Adoption
Numerous planned gas power plants have stalled, and without power plants there is no buyer for regasified gas. Charter rates and financing costs rise when vessels are scarce, and cargo prices can make buyers pause. Smaller importers often wait for cheaper cargoes or for solar and wind projects to settle.
For example, in October 2026, Wood Mackenzie estimated that only 14.9 gigawatts of 53 gigawatts of planned gas fired power in Southeast Asia would come online by 2030, with Vietnam facing a gap of 25.7 gigawatts. Reuters reported through Pipeline & Gas Journal that the Philippines has halted at least three LNG related projects in two years.
Industrial is projected to grow at a CAGR of 10.6% from 2026 to 2034, ahead of Gas Grid and City Gas Supply at 4.5%, due to factories that cannot rely on weak grids. This restraint is felt most by gas fired power projects in Southeast Asia and South Asia.
Opportunity: Converted Carriers Are Creating Openings for Quick and Lower Cost Capacity
Rebuilding an LNG carrier into an FSRU costs less than a newbuild and takes less time, since the hull and tanks already exist. Older carriers that lose long term contracts to larger ships become candidates. Yards with conversion slots and regasification module suppliers stand to gain.
For example, in September 2026, the converted vessel LNGT Türkiye left the Seatrium yard in Singapore, completing a seven vessel rebuild program for Karpowership. The company then ordered a ninth conversion, LNGT Akdeniz, with regasification capacity up to 600 million cubic feet a day and work due to start in the first quarter of 2027.
Converted FSRU is projected to grow at a CAGR of 6.4% from 2026 to 2034, slower than Newbuild FSRU at 10.5%. Conversion work begins from a large revenue base, which adds more to the 2026 total but lifts overall growth by less through 2034.
Opportunity: First Time Importers Are Creating Demand for Short Term Floating Regasification Services
Countries that have never imported LNG often start with a short contract to learn the market. A floating unit can be rented for a few years, and the buyer can scale up or leave if demand disappoints. Owners that offer bundled supply and regasification services reach buyers who lack trading teams.
For example, in November 2026, Excelerate Energy reported a five year regasification and supply agreement in Iraq, with minimum offtake of 250 million cubic feet a day and a target start in the second quarter of 2027. It also signed a seven year regasification agreement with a Frontera Energy subsidiary in Colombia for service in the first quarter of 2027.
Iraq is projected to grow at a CAGR of 18.0% from 2026 to 2034, the highest in Middle East & Africa, and Colombia is projected to grow at 9.7%. Both countries start from low revenue; as a result, these contracts barely move global totals but raise their regional growth rates.
Trend: Owners Are Moving Toward Larger Newbuild Vessels and Longer Charters Backed by Korean Yards
Charterers increasingly ask for larger ships with purpose built tanks, and owners respond by ordering newbuilds at Korean yards. Longer charters back those orders, since a lender requires years of contracted income. Smaller owners that rely on older converted ships respond by targeting short term work.
For example, in July 2026, HD Korea Shipbuilding & Offshore Engineering won an order worth 492.8 billion won to build an FSRU, with delivery by the first half of 2029. Separately, Samsung Heavy Industries is building a 170,000 cubic meter FSRU for MISC at Lumut in Malaysia, due in early 2029.
Above 170,000 Cubic Meters is projected to grow at a CAGR of 13.0% from 2026 to 2034, as bigger ships reduce the cargo calls needed per unit of gas delivered. Delivery slots at yards for such ships are taken years in advance, leaving urgent buyers with few options.
Value Chain Analysis
| Stage | Activities | Representative Participants |
| Design and containment | Tank design, insulation, and regasification process engineering | Gaztransport & Technigaz (GTT) and Wärtsilä |
| Shipbuilding and conversion | Newbuild hulls and rebuilds of LNG carriers into FSRU service | Samsung Heavy Industries, HD Korea Shipbuilding & Offshore Engineering, Hanwha Ocean, and Seatrium |
| Vessel ownership and charter | Owning FSRUs and leasing them to terminal buyers | Excelerate Energy, Höegh Evi, Energos Infrastructure, and Golar LNG |
| Terminal operation and supply | Mooring, cargo handling, and gas delivery with or without LNG supply | Excelerate Energy, New Fortress Energy, and Karpowership |
| Gas buyers and distribution | Power plants, utilities, and industrial users of regasified gas | State gas companies, utilities, and industrial groups |
Source: Polaris Market Research Analysis
Value concentrates in vessel ownership and conversion capacity, since scarce vessels and limited yard slots determine charter rates. Shipyards earn from construction and rebuilds, designers collect fees on every tank installed, and customers fund the entire chain through charter and tariff payments.
Profitability differs considerably between stages, with charters generating long term contracted income and shipbuilding depending on the timing of orders. Owners that supply LNG in addition to the vessel earn trading margins on top, whereas those that only lease the vessel earn a fixed day rate.
Floating Storage and Regasification Unit Market Segmentation Analysis
Five lenses are applied in turn, as buyers choose a hull type, a tank size, a contract, an end use, and a mooring for different reasons.
Construction Insights
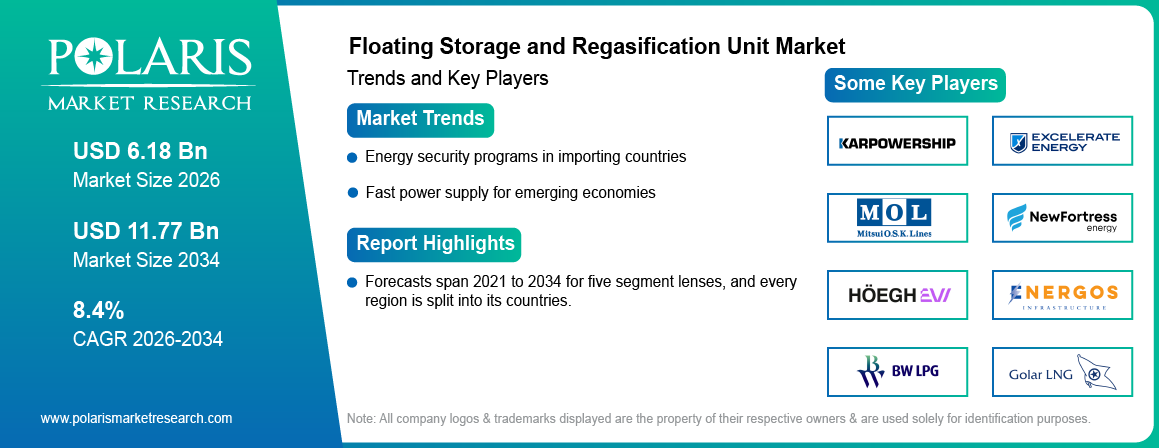
Converted FSRU accounted for 54.3% of construction revenue in 2026, owing to the lower price and faster delivery of rebuilt LNG carriers. A converted ship reuses a hull and tanks that already exist, and the yard adds regasification modules, a gas arm, and mooring gear. Owners also like the resale value of a carrier hull.
For example, in May 2025, Höegh Evi and Egypt's state gas company EGAS agreed a ten year time charter for the converted vessel Hoegh Gandria at Port of Sumed. Peak send out is up to 1,000 million standard cubic feet a day, and deployment is planned for the fourth quarter of 2026 (Source: Baird Maritime).
Newbuild FSRU is projected to grow at a CAGR of 10.5% from 2026 to 2034, as charterers increasingly specify purpose built vessels with larger tanks and lower boil off rates. Revenue was USD 2,826 Million in 2026, and delivery slots at the principal shipyards are already allocated several years in advance.
The choice between the two paths depends on timing and budget. A buyer that requires gas within two years usually picks a conversion, while a buyer planning a fifteen year import program often prefers a newbuild with modern tanks and engines.
Residual and redeployment value also influence the choice. A converted carrier retains a hull that other LNG shipping companies understand. An owner can return it to the carrier market if a charter ends early, whereas a newbuild FSRU is engineered around regasification and preserves value mainly through its next contract. Lenders weigh both considerations when setting loan terms and equity requirements.
Conversion capacity is limited to a few yards; as a result, owners that hold carriers without long term contracts have an advantage. Yards with open slots can raise prices when several projects compete for the same window.
Storage Capacity Insights
140,000 to 170,000 Cubic Meters accounted for 54.6% of storage capacity revenue in 2026, driven by vessels that fit most existing jetties and keep cargo calls to a manageable number. This size matches the standard LNG carrier, and cargo supply and port rules are well understood. The LNG storage tank market study covers the tanks behind these vessels.
Demand for Above 170,000 Cubic Meters is projected to grow at a CAGR of 13.0% from 2026 to 2034, since larger tanks cut the number of cargo calls and lift send out for big importers. For example, in June 2026, Poland's gas grid operator confirmed that a second FSRU in the Bay of Gdansk, due in 2028, would add 6.1 billion cubic meters a year of capacity (Source: Notes from Poland).
Up to 140,000 Cubic Meters was worth USD 1,223 Million in 2026, attributed to smaller importers and short duration projects where a shallow port or modest demand excludes a larger vessel. Growth is the slowest of the three classes, at 1.9%.
Tank technology also matters. Membrane designs from licensors such as GTT dominate newbuild orders. GTT also supplied the membrane tank design used in the ship that Samsung Heavy Industries is building for MISC, a 170,000 cubic meter unit due in the first quarter of 2029.
Boil off and regasification output interact with tank size. A larger tank holds cargo longer between deliveries and therefore smooths pipeline flow when carriers arrive late, whereas a smaller tank calls for more frequent cargo deliveries and closer scheduling with suppliers. Customers consequently match tank size to the number of cargoes they can reliably secure each month.
Contract Model Insights
Long Term Charter accounted for 61.9% of contract model revenue in 2026, owing to import terminals that require a fixed vessel for a decade or more and lenders that want contracted income. Owners secure financing against these charters, and day rates stay stable.
For example, in November 2026, Excelerate Energy said the charter of its FSRU Sequoia with Petrobras in Brazil had been extended by five years through 2038 (Source: Finviz). Such extensions give owners predictable cash flows and give buyers long term supply security.
Short Term Charter is projected to grow at a CAGR of 12.3% from 2026 to 2034, as newcomers to LNG imports and seasonal customers lease vessels for a limited number of years. Revenue was USD 1,334 Million in 2026, and spare vessels typically secure employment quickly whenever market conditions tighten.
Owned and Operated was worth USD 1,021 Million in 2026, driven by state companies and utilities that buy their own units to control the asset. This route requires the most capital and skilled crews, and it grows more slowly than rented models, at 6.9%.
Pricing differs across these routes. Long charters are priced per day with escalators, short charters carry a premium for flexibility, and owned units move cost to the buyer balance sheet. Bundled supply deals add LNG trading margin on top of the vessel fee.
The creditworthiness of the customer matters in every contract model. State utilities with strong balance sheets can negotiate long charters on better terms, while smaller customers may be asked for guarantees or advance payments. Owners generally favor customers whose gas supply contracts already extend several years, because this reduces the probability of idle time.
Application Insights
Power generation accounted for 49.9% of application revenue in 2026, owing to gas fired plants in countries with no pipeline supply. A floating unit moored beside a power plant can feed it within months, much faster than a land terminal can be built. The gas turbine market study covers the generating equipment at these plants.
Industrial was worth USD 832 million in 2026, due to factories that rely on gas for heat and feedstock and cannot count on weak grids. Gas Grid and City Gas Supply earned 30.7% of revenue, driven by European and Asian utilities that blend imported gas into national networks.
For example, in October 2026, Wood Mackenzie projected that Southeast Asia LNG use would climb to 39 million tonnes by 2028 from 27 million in 2025, according to Reuters. Planned gas power in the region is still running behind schedule, and floating supply stays attractive as a quick option.
The LNG Bunkering and Other Uses segment is on course for a CAGR of 14.3% from 2026 to 2034, the highest of the four applications, since ports use floating units to fuel ships and supply small scale distribution. Revenue is small at USD 364 Million in 2026; as a result, a single new contract moves the figure noticeably.
Industrial customers prioritize stable pricing and gas grid operators prioritize security of supply; as a result, the two groups evaluate a project against different criteria. Power producers focus on start date and regasification output, while bunkering customers focus on permitting and safety review, and each group consequently assembles a different shortlist of owners.
Deployment Insights
Jetty Moored units accounted for 68.4% of deployment revenue in 2026, driven by ports that already have a berth, a sheltered basin, and pipeline links. A jetty cuts mooring cost, and cargo carriers can come alongside in routine weather.
Offshore Moored is projected to grow at a CAGR of 11.6% from 2026 to 2034, as sites with shallow water, crowded harbors, or community objections move the terminal away from shore. For example, in August 2025, federal energy statistics listed Barcarena at 0.75 billion cubic feet a day, Terminal Gás Sul at 0.50, and the Cosan terminal at 0.50 among Brazil's FSRU based additions.
Others was worth USD 468 Million in 2026, attributed to river barge and nearshore setups, and to temporary moorings used during port works. It grew at 9.9% over the period.
Site conditions determine the outcome. Wave height, seabed depth, and distance to the electricity and gas grids establish the cost of a mooring, and regulators evaluate fishing activity, shipping lanes, and local opinion before approving a berth.
The choice of mooring also affects insurance, maintenance, and weather related downtime. Jetty berths allow convenient access for crews and supplies, whereas offshore sites depend on calm sea windows for cargo transfer. The choice of mooring also affects insurance, maintenance, and weather related downtime. Jetty berths allow convenient access for crews and supplies, whereas offshore sites depend on calm sea windows for cargo transfer. The offshore support vessel market study covers the fleets that serve such offshore moorings. Owners price these risks into day rates, and customers compare total cost over the contract term rather than the headline rate.
Floating Storage and Regasification Unit Market Regional Analysis
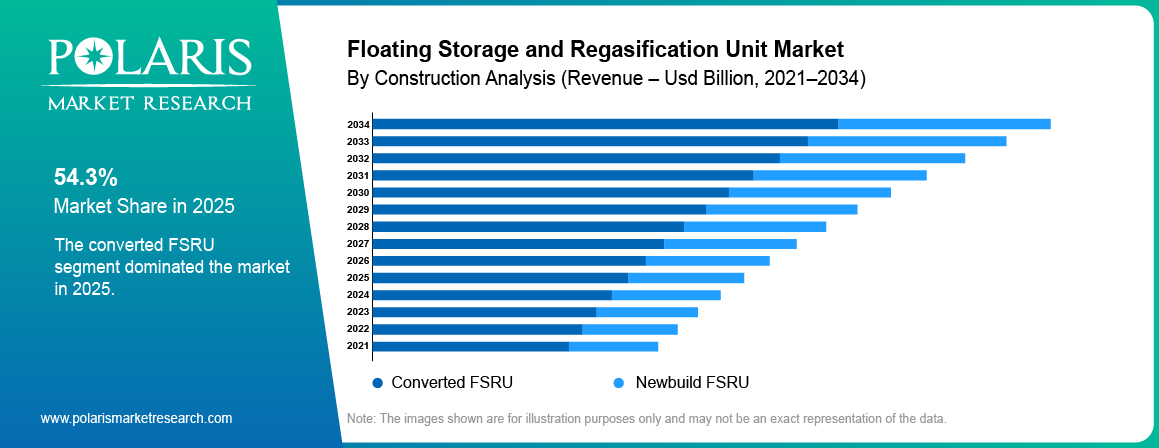
Regional demand follows import needs in the natural gas market, pipeline politics, and the speed of power plant projects. Europe is the largest region, Asia Pacific grows fastest from a large base, and North America stays small as the United States exports LNG rather than importing it.
North America Market
The share of North America in 2026 revenue was 2.4%, the smallest of the five regions, as the United States exports LNG and Canada and Mexico rely mostly on pipeline gas. The region is projected to grow at a CAGR of 2.3% from 2026 to 2034, the slowest pace of any region.
Mexico is expected to expand faster than the larger United States market, with a CAGR of 4.0% from 2026 to 2034, as power plants on the Pacific and Gulf coasts look for supply that pipelines cannot provide. Canada is projected to grow at 2.3%, driven by east coast gas needs, while the United States grows at 1.2% from USD 80 Million in 2026.
Most floating regasification work in the region is tied to import projects on the east and west coasts of Mexico and to occasional winter supply in the north east of the United States. Permitting is slow, and export focused investment draws capital away from import capacity.
Demand would change if pipeline limitations persist in coastal areas or if Mexican power plants expand capacity faster than the gas pipeline network, although the small base of the region limits any effect on global totals.
Europe Market
Europe held 32.4% of revenue in 2026, owing to terminals built in Germany, the Netherlands, Italy, Greece, and Poland since 2022 to replace Russian pipeline gas. Germany is the largest country market, at USD 471 Million in 2026, while Poland grows quickest, at a CAGR of 11.0% from 2026 to 2034.
For example, in June 2026, the Polish transmission company confirmed a third LNG terminal, lifting planned capacity above 20 billion cubic meters a year. The Swinoujscie terminal has run since December 2015 at 8.3 billion cubic meters, and imports could reach 50 billion cubic meters a year from 2030.
Europe is projected to grow at a CAGR of 6.2% from 2026 to 2034, ranking fourth among regions for growth, since much of the capacity needed after 2022 is now in place. Turkey, Italy, and Greece add units for regional trade, while Germany is optimizing the sites it already runs.
Policy decisions will shape the next phase of development. Governments weigh the expense of maintaining spare import capacity against the risk of a supply interruption, and extensions of existing arrangements are keeping owner revenue stable in the interim.
Asia Pacific Market
Asia Pacific contributed 28.0% of 2026 revenue and is projected to grow at a CAGR of 11.9% from 2026 to 2034, the fastest of any region, driven by gas for power in South and Southeast Asia. China is the largest country in the region, at USD 377 Million in 2026, and the Philippines grows quickest, at 25.1% from 2026 to 2034.
India is projected to grow at 13.2%, Vietnam at 21.8%, and Pakistan and Bangladesh also add capacity since pipeline gas is scarce. Wood Mackenzie estimated in October 2026 that Vietnam faces a shortfall of 25.7 gigawatts against its gas power plans; as a result, that growth depends on projects that have been slow to materialize.
In the Rest of Asia Pacific, Malaysia's state shipping company MISC has a 170,000 cubic meter FSRU on order from Samsung Heavy Industries for Lumut, Perak, the country's first. Delivery is expected in the first quarter of 2029.
Spending depends on the speed with which power plants and grid connections reach completion. Where a vessel arrives before the associated plant, owners may collect only minimum payments and customers carry the cost without consuming the gas. Careful coordination of vessel arrival and plant commissioning therefore matters as much as the vessel itself.
Latin America Market
Latin America produced 18.8% of 2026 revenue and is projected to grow at a CAGR of 7.4% from 2026 to 2034. Growth is attributed to terminals in Brazil and new supply deals in Colombia. Brazil is the largest country, at USD 600 Million in 2026, while Colombia grows quickest, at 9.7% against 6.5% for Brazil.
For example, in August 2025, the United States Energy Information Administration put Brazil's LNG import capacity at 5.1 billion cubic feet a day, against 2.5 billion in 2020. A further unit at Suape was scheduled for early 2026.
Argentina and Chile use floating units for winter peaks when pipeline supply falls short, and Colombia is replacing declining domestic production. Currency swings and hydropower conditions in the region decide how much gas power plants must run in a given year.
Hydrological conditions influence the quantity of gas consumed. In wet years hydropower displaces gas fired generation and terminals operate below capacity, whereas dry years push utilities to lease additional regasification capacity. Owners that offer flexible start dates and shorter terms are best suited to this pattern.
Middle East & Africa Market
Middle East & Africa generated 18.4% of 2026 revenue and is projected to grow at a CAGR of 7.7% from 2026 to 2034, ranking second among regions for growth. That pace is attributed to summer power demand in Egypt and new supply projects in Iraq. Egypt is the largest country market, at USD 337 Million in 2026, and Iraq grows quickest, at 18.0% from 2026 to 2034.
For example, in May 2025, Egypt's EGAS agreed with Höegh Evi to deploy the FSRU Hoegh Gandria at Port of Sumed under a ten year charter, with conversion work starting immediately. Egypt has turned from gas exporter to importer, and floating capacity is a quick fix for summer power demand.
Kuwait and the United Arab Emirates rent units for peak months, and Ghana and South Africa have floating terminals under study for gas power supply. Funding and credit risk are the main limits in the smaller African markets.
Credit risk deserves particular attention across the region. Payment guarantees from state utilities or development lenders frequently determine whether a vessel is chartered, and owners with experience in emerging markets and access to insurance against non payment are better placed to secure these contracts.
Floating Storage and Regasification Unit Market Competitive Landscape
The field splits into four layers, as vessel owners and operators charter FSRUs, shipyards build and convert them, technology licensors design tanks, and gas suppliers bundle cargoes with terminal services. A buyer usually signs with an owner once and then keeps the same vessel for years.
Excelerate Energy reported third quarter 2026 revenue of USD 297.2 million, against USD 391.0 million a year earlier, with net income of USD 60.0 million and adjusted earnings before interest, taxes, depreciation, and amortization (EBITDA) of USD 133.5 million. Full year adjusted EBITDA guidance runs from USD 495 million to 515 million.
Competition centers on vessel availability. Energos Infrastructure, controlled by Apollo, offers FSRUs for charter starting in 2027 and 2028, and Karpowership has ordered a ninth conversion at Seatrium. Market share moves slowly, since charters last for years and few ships are free at any time.
Scale and balance sheet strength establish the hierarchy among owners. A large fleet allows an owner to answer a short notice request by redeploying a vessel, whereas a small owner must wait for an existing charter to conclude. Shipyards compete on delivery slots, tank designers compete on boil off performance and licensing terms, and alliances between owners and yards are common because they secure slots before a project is awarded.
Vendor Landscape Snapshot
| Company | Vendor Positioning | Role |
| Excelerate Energy, Inc. | Leader | FSRU owner and terminal operator with Petrobras, Iraq, and Colombia contracts |
| Höegh Evi | Leader | FSRU owner and operator, with a ten year Egypt charter for Hoegh Gandria |
| Golar LNG Limited | Leader | FSRU and floating LNG owner |
| BW LNG Pte. Ltd. | Challenger | LNG carrier and FSRU owner |
| Energos Infrastructure | Challenger | FSRU owner controlled by Apollo, offering vessels for charter from 2027 |
| New Fortress Energy Inc. | Challenger | Gas supplier with FSRU based terminals in Brazil, including Barcarena |
| Mitsui O.S.K. Lines, Ltd. | Challenger | Shipping group with LNG vessel interests |
| Karpowership (Karadeniz Holding) | Challenger | Floating power and FSRU operator with a conversion program at Seatrium |
| Samsung Heavy Industries Co., Ltd. | Leader | Shipbuilder with an FSRU under construction for MISC |
| HD Korea Shipbuilding & Offshore Engineering Co., Ltd. | Leader | Shipbuilder that won an FSRU order in July 2026 |
| Hanwha Ocean Co., Ltd. | Challenger | Korean shipbuilder with LNG vessel capability |
| Seatrium Limited | Challenger | Conversion yard for Karpowership and Excelerate FSRU projects |
| Gaztransport & Technigaz (GTT) | Niche Player | Membrane tank designer, including the tank design for the MISC FSRU |
Source: Polaris Market Research Analysis
Floating Storage and Regasification Unit Market Technology and Innovation Landscape
Innovation centers on larger tanks, lower boil off, and cleaner regasification. Membrane containment is replacing older designs on newbuilds, and open loop and closed loop vaporizers are chosen by water temperature and environmental rules.
Conversion engineering is the second theme. Yards now handle an entire carrier rebuild in around a year, and Seatrium completed seven vessels for Karpowership before accepting a ninth order. Standard module designs shorten each project.
Power and ship fuel links are a further layer, as some units now deliver gas to power barges and bunkering vessels. Emission rules push owners toward dual fuel engines and shore power at berth.
Digital monitoring is spreading across fleets. Sensors on pumps, vaporizers, and mooring lines feed predictive maintenance tools that reduce unplanned downtime. Operators also use cargo scheduling software to coordinate carrier arrivals with regasification targets, leaving the core hardware unchanged while increasing utilization and helping owners satisfy the uptime clauses in their charters.
Technology and Innovation Landscape Snapshot
| Area | Role | Status and Representative Developers |
| Membrane containment | Hold LNG at low temperature with thin metal layers | Production, with GTT |
| Regasification modules | Heat LNG back into gas on board | Production, with Wärtsilä and other equipment makers |
| Carrier to FSRU conversion | Rebuild an LNG carrier for storage and send out | Production, with Seatrium |
| Large newbuild FSRU | Add storage above 170,000 cubic meters | Scaling, with Samsung Heavy Industries and HD Korea Shipbuilding & Offshore Engineering |
| Floating power links | Feed gas fired power barges beside the terminal | Production, with Karpowership |
| LNG bunkering supply | Fuel ships from a floating terminal | Early commercial use |
Source: Polaris Market Research Analysis
Use Case Analysis
Emergency Supply for Pipeline Gas Loss
Governments facing the sudden loss of pipeline supply increasingly turn to FSRUs, because a chartered vessel can be commissioned within months and can receive cargoes from several suppliers at once. Germany followed this approach after 2022 and now operates several floating terminals.
The principal constraint is regasification output and pipeline connectivity rather than storage, since the grid can absorb only a limited volume of gas each day. Buyers that plan ahead therefore confirm pipeline capacity and storage levels before committing to a particular vessel.
Gas for Power in Emerging Economies
Countries with rapidly rising electricity demand moor an FSRU beside a gas fired power plant or connect it to the national grid, and Egypt, Bangladesh, and the Philippines have pursued this model. Payment takes the form of periodic charter fees instead of a large capital outlay, which preserves public borrowing capacity.
Project schedules determine commercial outcomes in this use case. If a power plant is completed late, the vessel remains idle, and some contracts include minimum payment clauses that transfer the cost of delay to the customer.
Seasonal Peak Supply
Utilities in regions with pronounced seasonal demand lease units for several months each year, and the vessel can relocate between hemispheres as seasons change. Owners fill the remaining time with short charters to other customers.
Demand during peak periods is concentrated; as a result, day rates increase when numerous customers seek cover simultaneously. Customers that contract early generally obtain more favorable terms and greater certainty of delivery.
Regional Hubs and Re Export
Poland and Turkey are planning floating capacity to supply neighboring markets, with onward transmission by pipeline. A regional hub requires several cargoes each month and a sufficiently liquid gas market to justify the investment.
Policy support is significant, since governments increasingly treat these terminals as strategic energy security assets, and regulators in numerous countries set the access tariffs that determine whether third parties can use the capacity.
Ship Fueling and Small Scale Supply
Harbors use floating units to bunker vessels and to load small carriers that serve islands and remote power plants. The segment remains modest in absolute terms, although it is expanding faster than the other applications.
Safety requirements for fuel transfer and the high unit cost of small cargo handling constrain the pace of growth. Operators that already run large units can add this service at modest incremental cost.
Buyer Needs and Decision Criteria
| Buyer Need | Decision Criteria | Why It Matters |
| Vessel availability | Delivery date and charter length | A late vessel leaves a power plant without fuel |
| Send out capacity | Regasification rate and pipeline fit | Gas that cannot leave the terminal has no value |
| Total cost | Day rate, port fees, and supply terms | Buyers compare charter offers across several owners |
| Site compatibility | Tank size, draft, and mooring type | The vessel must fit the berth and local sea conditions |
| Regulatory approval | Environmental permits and safety review | Permits can delay projects by a year or more |
Source: Polaris Market Research Analysis
Entry barriers are substantial, since a new owner must raise capital, establish an operating record, and obtain port approvals, and lenders consistently favor companies with proven fleets. Offers are difficult to compare as regasification output, tank sizes, and supply terms differ; as a result, buyers lean toward owners with whom they have previously contracted.
Premium Insights and Forward Outlook
Newbuild Units Will Gain Share From Conversions
Scarce conversion slots and a limited pool of aging carriers will direct a growing share of procurement toward new vessels with larger tanks. Shipyards with available berths benefit, while the availability of lender financing sets the pace of the transition.
Charters of fifteen years and above back these orders, and owners able to demonstrate contracted income at the time of ordering will secure the most favorable borrowing terms. Customers weighing the two routes should model total cost over the full contract term and include residual value alongside the day rate.
Short Charters Will Change Pricing
First time importers prefer shorter commitments, and owners with spare vessels will price for flexibility, which pushes long charter rates to incorporate additional provisions on early exit and vessel substitution.
Customers that sign short contracts should anticipate rate increases when supply tightens, because an available vessel is uncommon in a constrained market. Owners can protect themselves with option periods and early exit fees, and customers can negotiate rate caps on extensions.
Asia Pacific Growth Depends on Power Plant Delivery
Gas power programs in Southeast Asia are running behind schedule, and demand for FSRUs follows the timing of plant completion. Buyers will seek charters with flexible start dates, and owners willing to accept that risk will secure contracts.
The gap between planned and delivered capacity deserves close monitoring: if projects arrive on time, demand could exceed the forecast, and if they do not, vessels may remain idle. Scenario planning helps, for example by pairing a firm vessel booking with a flexible start window.
Floating Units Will Link Gas and Ship Fuel
Ports are evaluating floating terminals as bunkering hubs, which could add a second revenue stream to each unit, and early movers that already hold the necessary permits will have a considerable advantage.
Regulators set the pace through safety rules for fuel transfer; as a result, owners should engage port authorities early. The business case improves when one vessel serves several uses, such as grid supply by day and bunkering on request, since utilization rises without a second vessel.
Key Players in the Floating Storage and Regasification Unit Market
- Excelerate Energy, Inc.
- Höegh Evi
- Golar LNG Limited
- BW LNG Pte. Ltd.
- Energos Infrastructure
- New Fortress Energy Inc.
- Mitsui O.S.K. Lines, Ltd.
- Karpowership (Karadeniz Holding)
- Samsung Heavy Industries Co., Ltd.
- HD Korea Shipbuilding & Offshore Engineering Co., Ltd.
- Hanwha Ocean Co., Ltd.
- Seatrium Limited
- Gaztransport & Technigaz (GTT)
Industry Developments
- November 2026: Excelerate Energy posted USD 297.2 million of revenue for the third quarter and a five year extension of its Petrobras charter for the vessel Sequoia.
- October 2026: Karpowership awarded Seatrium its ninth FSRU conversion, for LNGT Akdeniz, with work starting in the first quarter of 2027 (Source: Offshore magazine).
- September 2026: The vessel LNGT Türkiye left Seatrium's Admiralty Yard in Singapore, finishing the seven ship Karpowership conversion program.
- July 2026: HD Korea Shipbuilding & Offshore Engineering secured an FSRU contract valued at 492.8 billion won, due for delivery by the first half of 2029.
- June 2026: Poland's gas grid operator announced plans for a third LNG terminal, after the second FSRU planned for the Bay of Gdansk.
- February 2026: Energos Infrastructure marketed FSRUs for charter periods starting in 2027 and 2028.
- December 2025: Germany's Brunsbuettel FSRU, the Hoegh Gannet, returned to service on 24 November after upgrades, while Wilhelmshaven 2 had run since 29 August.
- May 2025: Höegh Evi signed a ten year deal with EGAS to place Hoegh Gandria at Port of Sumed.
Floating Storage and Regasification Unit Market Report Segmentation
By Construction Outlook (Revenue, USD Billion, 2021 to 2034)
-
Converted FSRU
-
Newbuild FSRU
By Storage Capacity Outlook (Revenue, USD Billion, 2021 to 2034)
-
Up to 140,000 Cubic Meters
-
140,000 to 170,000 Cubic Meters
-
Above 170,000 Cubic Meters
By Contract Model Outlook (Revenue, USD Billion, 2021 to 2034)
-
Long Term Charter
-
Short Term Charter
-
Owned and Operated
By Application Outlook (Revenue, USD Billion, 2021 to 2034)
-
Power Generation
-
Industrial
-
Gas Grid and City Gas Supply
-
LNG Bunkering and Other Uses
By Deployment Outlook (Revenue, USD Billion, 2021 to 2034)
-
Jetty Moored
-
Offshore Moored
-
Others
By Regional Outlook (Revenue, USD Billion, 2021 to 2034)
- North America
- United States
- Canada
- Mexico
- Europe
- Germany
- Italy
- Netherlands
- Greece
- Poland
- Turkey
- Rest of Europe
- Asia Pacific
- China
- India
- Pakistan
- Bangladesh
- Vietnam
- Philippines
- Indonesia
- Japan
- Rest of Asia Pacific
- Latin America
- Brazil
- Colombia
- Argentina
- Chile
- Rest of Latin America
- Middle East & Africa
- Egypt
- Kuwait
- United Arab Emirates
- Iraq
- Ghana
- South Africa
- Rest of Middle East & Africa
Floating Storage and Regasification Unit Market Report Scope
| Report Attribute | Details |
| Market Size in 2025 | USD 5.60 Billion |
| Market Size in 2026 | USD 6.18 Billion |
| Revenue Forecast by 2034 | USD 11.77 Billion |
| CAGR | 8.4% (2026 to 2034) |
| Base Year | 2025 |
| Historical Data | 2021 to 2024 |
| Forecast Period | 2026 to 2034 |
| Quantitative Units | Revenue in USD Million and USD Billion, and CAGR in percent |
| Report Coverage | Revenue Forecast, Growth Factors, Competitive Landscape, Industry Trends, and Strategic Analysis of the floating storage and regasification unit market |
| Segments Covered | By Construction, Storage Capacity, Contract Model, Application, Deployment, and Region |
| Regional Scope | North America, Europe, Asia Pacific, Latin America, Middle East & Africa |
| Competitive Landscape | Company Profiling, Product Benchmarking, Financial Analysis, Market Developments, and Strategic Initiatives |
| Report Format | PDF and Excel |
| Customization | Available by Country, Region, and Segment |
| Research Team | Polaris Market Research & Consulting, Inc. research team |
| Last Updated | 9 November 2026 |
Source: Polaris Market Research Analysis
Why Choose Polaris Market Research
One country level model sits behind every table in this report. Starting from 31 markets, the figures roll up into regions; as a result, any regional total can be broken back into the vessels, charters, and segments that produced it.
Beyond the usual cuts, the study reads revenue by contract model and by mooring type. That view demonstrates how spending moves between long charters, short charters, and owned units, and between jetty berths and offshore sites.
Facts from outside sources carry the name of their publisher and a date wherever one exists. Planners can tell at a glance whether a point comes from a company release, a public agency, or a trade publication.
Polaris can rebuild the study around one country, one segment, or a chosen group of vessel owners. To buy this report or request customization, contact Polaris Market Research & Consulting, Inc.
Research Methodology
Research Approach
Sizing starts with supply: FSRU vessels, rebuilt LNG carriers, regasification equipment, and the charter and operating revenue earned with them. Land terminals, floating liquefaction plants, and floating storage with no regasification unit fall outside the boundary. The model covers 2021 to 2034 with 2025 as the base, is stated in USD Million and USD Billion, and splits revenue five ways across 31 markets grouped into five regions. Readers who want the broader Polaris framework can open the research methodology page.
Secondary Research
Desk research produced 10 dated facts. Of these, 1 came from a public agency, 1 from a company release, and 8 from trade publications. Most were published within the past eighteen months, and the register lists the date of each one next to its publisher.
Primary Research
Polaris follows its standard process of primary interviews. These interviews cover vessel owners, shipyards and equipment makers, and industry experts and consultants. They are used to validate secondary estimates, segment shares, regional trends, and growth drivers.
Data Structuring
Inputs were converted to USD for every year before any segment work began, and the edges of each segment were fixed in advance. A vessel that serves more than one use is assigned to its principal use to avoid counting it twice, while revenue from land terminals was stripped out so that totals stay within scope.
Market Size Estimation
Bottom up sizing begins at country level. Fleet counts, charter day rates, and conversion and operating revenue combine into segment values, and these then accumulate into regions and finally the global figure.
As a top down cross check, the 2025 base of USD 5.60 Billion is compared with three published third party estimates ranging from USD 1.0 Billion to USD 8.7 Billion. The spread exists since each research firm draws its own boundary. The Polaris figure lands inside that range because its scope includes conversion work and operating services sold alongside each vessel.
Forecasting
The forecast follows fleet additions, charter renewals, and announced import capacity. A single growth curve that loses speed each year produces the stated CAGR, and the mix of segments and regions drifts gradually toward newbuild units and Asia Pacific over the period.
Data Triangulation and Validation
The finished model was put through four tests. Every segment set totals 100% each year, countries sum to their regions, regions sum to the global figure, and one easing growth path links history to forecast. The base year was also checked against the published range of comparable estimates.
Limitations
FSRU revenue overlaps at its edges with LNG terminal, shipping, and shipbuilding revenue, and this is one reason published sizes vary. Charter terms are frequently private; as a result, contract model shares for each region are estimates rather than reported numbers. Market figures in this report are Polaris estimates.
Research Methodology Phases
| Phase | Focus | Evidence / Output |
| Scope and Setup | Market boundary, segments, and regions | Fixed scope and segment list |
| Secondary Data Collection | Company releases, agency data, and trade reports | 10 sourced facts with dates |
| Primary Research | Talks with owners, yards, and domain experts | Checked shares, trends, and drivers |
| Data Structuring | Yearly USD values within fixed boundaries | Inputs without double counting |
| Bottom Up Estimate | Country and segment estimates | Regional and global totals |
| Top Down Estimate | Global base for 2025 and its segment mix | Base compared with public estimates |
| Forecasting | Annual growth path to 2034 | Stated CAGR |
| Triangulation and Validation | Share, total, and range checks | Four passed checks |
| Output | Report tables and text | One data set feeding every table |
Source: Polaris Market Research Analysis
Data Sources by Type
| Type of Source | Named Examples | Role in the Estimates |
| Public agencies (1) | US Energy Information Administration | Import capacity by country |
| Company releases (1) | Excelerate Energy | Contracts, results, and fleet positioning |
| Trade press (8) | Baird Maritime, Offshore magazine, Notes from Poland | Charters, orders, terminals, and gas power plans |
Source: Polaris Market Research Analysis
Floating Storage and Regasification Unit Market FAQ's
An FSRU receives liquefied natural gas, stores it, and turns it back into gas that feeds pipelines and power stations. Importers pick them when they want gas sooner than a land terminal allows.
The floating storage and regasification unit market size was valued at USD 5.60 Billion in 2025, according to Polaris Market Research analysis. Revenue then climbed to USD 6.18 Billion in 2026 on energy security programs and gas power projects.
The floating storage and regasification unit market is projected to reach USD 11.77 Billion by 2034, growing at a CAGR of 8.4% from 2026 to 2034, according to Polaris Market Research analysis.
Europe is the leading market, with 32.4% of revenue in 2026. Revenue is concentrated in terminals across Germany, Italy, the Netherlands, Greece, and Poland that replaced pipeline gas.
Asia Pacific is the fastest growing region, at 11.9% a year from 2026 to 2034. Among its countries, the Philippines grows quickest.
Converted FSRU holds the largest share, at 54.3% of 2026 revenue, though Newbuild FSRU follows at 45.7%. Newbuild FSRU is the faster riser, expanding 10.5% a year.
The key players include Excelerate Energy, Inc., Höegh Evi, Golar LNG Limited, BW LNG Pte. Ltd., Energos Infrastructure, New Fortress Energy Inc., Karpowership, and Samsung Heavy Industries Co., Ltd. Leadership is split, since owners, shipyards, and tank designers each control a different layer.
Owners are ordering larger newbuild vessels at Korean yards, signing longer charters to back them, and converting more LNG carriers. First time importers are also renting units on short terms.
Delayed gas power plants, high charter costs, and long permitting hold back some projects. Buyers also face a thin supply of free vessels and limited conversion slots at yards.
An FSRU is a ship that can be deployed in months and paid for through a charter. A land terminal takes several years to build and costs more upfront, although it can be expanded and lasts for decades.
The mid size class of 140,000 to 170,000 cubic meters earns the most, at USD 3,375 Million in 2026, as it fits most jetties and cargo schedules. The largest tank class is the quickest growing, at a CAGR of 13.0% from 2026 to 2034.
Bunkering and other uses grow fastest, at a CAGR of 14.3% from 2026 to 2034. Power Generation remains the largest application.
The contract model decides who carries cost and risk. Long Term Charter is the largest model, with 61.9% of 2026 revenue, while Short Term Charter is gaining share at 12.3% a year, since first time importers prefer shorter commitments.
Country revenue is highest in Brazil, at USD 600 Million in 2026, ahead of Germany in Europe and China in Asia Pacific.
Demand is driven by energy security programs, gas for power in emerging economies, and the short time a floating terminal requires to start work. Brazil more than doubled its LNG import capacity between 2020 and August 2025, and floating units supplied much of the addition.

Download Sample Report of Floating Storage and Regasification Unit Market
Please fill out the form to request a customized copy of the research report.


