
Location Analytics Market Research Report, Size, Share & Forecast, 2026 – 2034
REPORT DETAILS
Location Analytics Market Summary
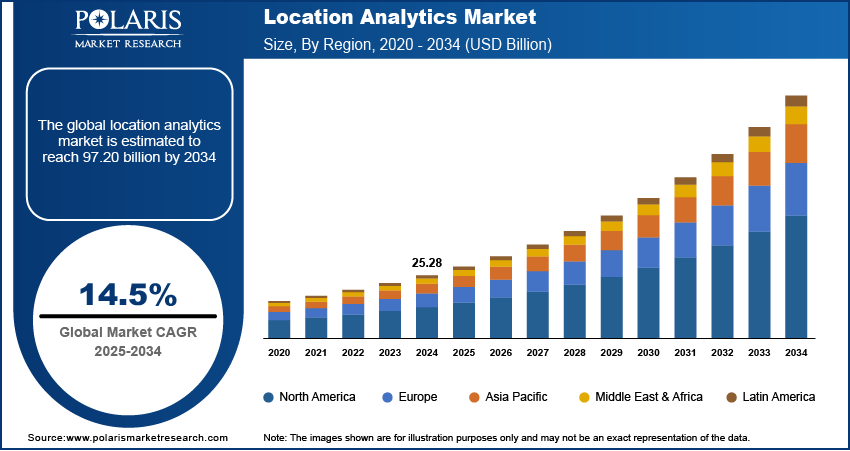
The location analytics market size was valued at USD 28.84 billion in 2025. The market is projected to register a CAGR of 14.5% from 2026 to 2034. The rising preference for data-driven strategies by the retail industry players drives the demand for location analysis solutions. The growing adoption of mobile and IoT devices, along with the vast amount of data they generate, fuels the industry development.
Market Statistics
Key Takeaways
- North America led the market with a 37.50% revenue share in 2025. The region's advanced technological infrastructure and early adoption of data-driven solutions contribute to its leading position.
- The Asia Pacific industry is experiencing significant growth at a 18.21% CAGR. The regional growth is driven by rapid infrastructure development and rising adoption of mobile and IoT technologies.
- The services segment held the largest share of 45.10% in 2025. It is due to the increasing demand for managed services and support to help businesses implement and optimize location analytics solutions.
- The indoor segment is expected to register a significant CAGR of 25.30%. The growth is driven by the increasing use of technology to track and analyze customer behavior inside stores, malls, and other indoor spaces.
- The sales and marketing optimization segment led with a 32.05% market share in 2025. This is owing to companies leveraging geospatial data for precise customer targeting and personalized marketing strategies.
Note: Figures and projections outlined in this report are the result of Polaris Market Research’s proprietary analytical processes, grounded in the latest available datasets and market observations.
Industry Dynamics
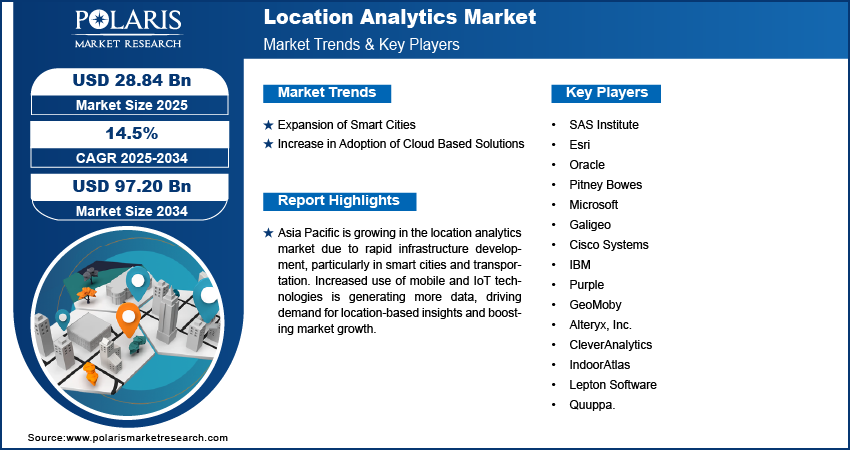
- The rapid expansion of smart cities and their reliance on data for decision-making propels the demand for location analytics software. The software is used to enhance urban development and daily operations.
- The rising adoption of cloud-based solutions and analysis tools across various end-use industries is driving the location analytics market growth.
- High initial investments and rising concerns regarding data privacy are hindering the adoption of location analytics solutions.
- Increasing adoption of technologies such as Internet of Things (IoT), along with artificial intelligence and machine learning, is expected to offer lucrative opportunities during the forecast period.
AI Impact on Location Analytics Market
- Artificial intelligence (AI) technology automates pattern recognition, anomaly detection, and predictive modeling. The adoption of this technology enhances geospatial analytics.
- Retailers use AI-enabled location analysis systems to optimize store locations, personalize marketing campaigns, and segment customers.
- Governments adopt AI tools for urban planning, resource allocation, and traffic control in smart cities.
- High deployment costs and data privacy concerns restrict the adoption of AI-based location analysis tools.
Source: Polaris Market Research Analysis
To Understand More About this Research: Download Sample Report
Location analytics software helps businesses analyze geographic and movement data to make informed decisions about locations, customer behavior, and operational strategies. The software combines data from various sources to provide insights that support site selection, marketing, and overall business optimization.
Businesses today are focusing more on data to make important decisions, such as where to open new stores or how to improve customer service. Location analytics software provides valuable insights by analyzing geographic and movement data, which helps businesses optimize operations. This rise of data-driven strategies has enabled companies to make smarter decisions about targeting the right customers, selecting the best locations, and understanding market trends. This growing reliance on data is driving the location analytics market demand.
The rising usage of mobile devices and IoT sensors worldwide is driving the location analytics market adoption. The widespread use of mobile devices and IoT sensors has created a vast amount of location-based data. For instance, according to IoT Analytics, the number of IoT-connected devices reached 16.6 billion in 2023, showcasing a large volume of IoT devices. People now carry smartphones that continuously track their movements, and IoT devices can monitor traffic flow, customer behavior, and product usage in real time. This data provides businesses with the ability to understand customer habits, improve operational efficiency, and optimize services. The explosion of mobile and IoT devices, along with the data they generate, is driving the adoption of location analytics solutions, thereby fueling the location analytics market value.
Location Analytics vs Traditional Business Analytics
Aspects | Location Analytics | Traditional Analytics |
| Type of Data | Geographical and spatial data | Numerical and business data |
| Visualization | Mapped visualizations | Graphs and dashboard |
| Information Derived | Location-specific information | General business information |
| Application | Routing and site selection | Financial management and operations |
| Real-time Visibility | High | Moderate/Low |
Source: Polaris Market Research Analysis
Market Dynamics
Expansion of Smart Cities
Smart cities are transforming how urban areas operate by integrating technology and data to improve the quality of life for residents. In these cities, location analytics is crucial for managing everything from traffic flow to public transportation and infrastructure planning. For instance, according to the Indian Government Press Information Bureau, India alone has an extensive network of 110 smart cities, showcasing an expansion of smart cities. By collecting and analyzing location-based data, city planners and government agencies can optimize services, reduce congestion, and improve resource allocation. The rapid expansion of smart cities and their reliance on data for decision-making is creating a significant demand for location analytics software to enhance urban development and daily operations.
Increase in Adoption of Cloud Based Solutions
Cloud computing has made location analytics more accessible for businesses of all sizes. Cloud-based location analytics platforms offer businesses the flexibility to analyze data in real time without needing extensive on-site IT infrastructure. These solutions are scalable, cost-effective, and easy to implement, making them attractive to small, medium, and large companies alike. Cloud technology enables businesses to access and analyze location data from anywhere, anytime, supporting faster decision-making and greater collaboration. The rise in cloud adoption is a major factor driving the location analytics market growth.
Applications in Retail and Consumer Analytics
Location intelligence is becoming more prevalent among retailers to analyze customer behavior and movements in physical retail spaces and online. The analysis of foot traffic patterns and geographical information allows organizations to make smarter decisions regarding the placement, design, and expansion of retail outlets. Location intelligence can be used for optimizing locations for retail outlets that experience high foot traffic and demand. In addition, location-based customer segmentation enables retailers to tailor their marketing efforts according to location-based consumer interests and behaviors. As a result, retail businesses can utilize location intelligence to provide targeted promotions and deals in real time.
Source: Polaris Market Research Analysis
Segment Analysis
Market Assessment by Location Type Outlook
The location analytics market segmentation, based on location type, includes indoor and outdoor. The indoor segment is expected to experience a significant CAGR of 25.30% in the global market during the forecast period. This growth is driven by the increasing use of technology to track and analyze customer behavior inside stores, malls, and other indoor spaces. Businesses are adopting indoor location analytics to better understand customer movement, optimize store layouts, and improve the overall shopping experience, due to which the demand for indoor location analytics software is rising, leading to segmental growth.
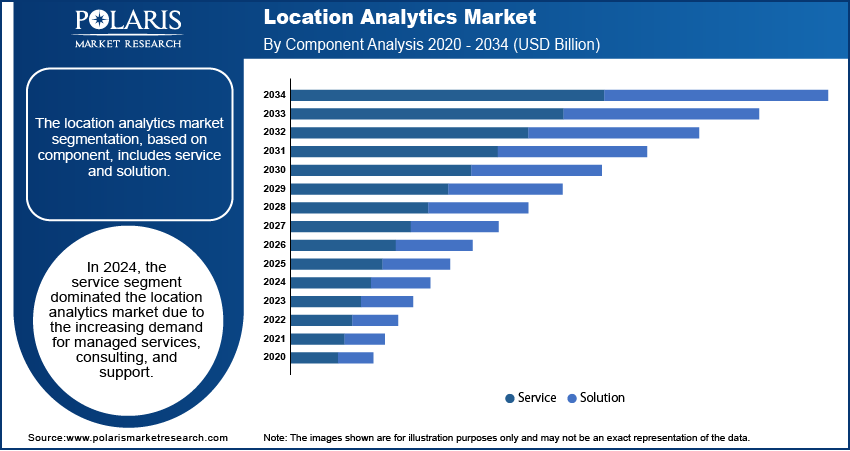
Market Evaluation by Component Outlook
The location analytics market segmentation, based on component, includes services and solution. The service segment dominated the market in 2025 with 45.10% share. This growth is due to the increasing demand for managed services, consulting, and support to help businesses implement and optimize location analytics solutions. Many organizations prefer outsourcing the complexity of setting up and maintaining location analytics tools to experts, ensuring they get the most accurate insights. Service providers offer end-to-end solutions, from data integration to customized analytics and reporting, which makes it easier for businesses to use location data effectively, leading to segment growth in the global location analytics market.
Source: Polaris Market Research Analysis
Regional Insights
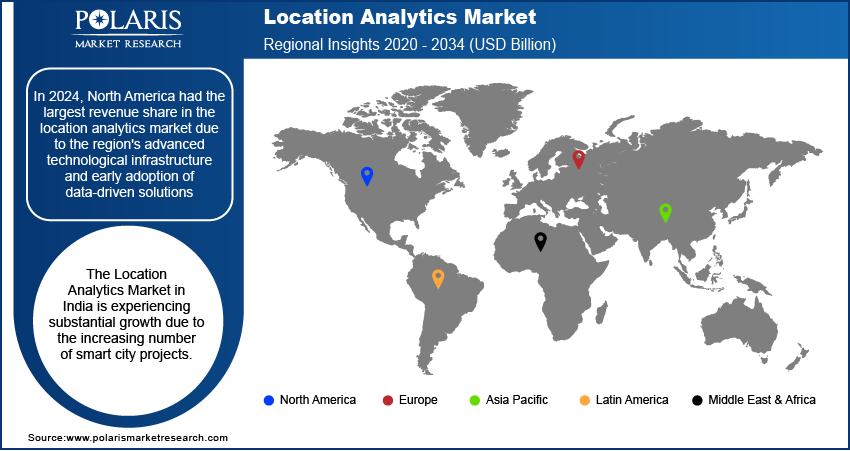
By region, the study provides location analytics market insights into North America, Europe, Asia Pacific, Latin America, and the Middle East & Africa. In 2025, North America had the largest location analytics market revenue share of 37.50% due to the region's advanced technological infrastructure and early adoption of data-driven solutions. The US, in particular, is a key driver, with businesses across industries such as retail and transportation utilizing location data for better decision-making. The growing use of mobile devices, IoT technology, and cloud-based solutions has further boosted the demand for location analytics in North America. Additionally, the region's focus on improving customer experiences, optimizing supply chains, and improving operational efficiency is fueling the market in North America.
Asia Pacific is experiencing significant growth with CAGR 18.21% in the global market, driven by rapid infrastructure development. Countries such as China, India, and Japan are investing heavily in transportation, urban planning, and smart city projects, which rely on accurate location data to optimize operations. Continuous infrastructure expansion has led businesses to use location analytics to improve logistics, manage traffic, and improve customer experiences. Additionally, the rise of mobile and IoT technologies in the region is generating vast amounts of data, further boosting demand for location-based insights and leading to market growth in Asia Pacific.
Source: Polaris Market Research Analysis
The location analytics market in India is experiencing substantial growth due to the increasing number of smart city projects. The government is focusing on developing smart cities across the country, which has created a growing need for advanced location data to optimize urban planning, improve public services, and enhance transportation systems. These developments have enabled businesses to adopt location analytics to make data-driven decisions in real time.
Key Players & Competitive Analysis Report
The location analytics market is constantly evolving, with numerous companies striving to innovate and distinguish themselves. Leading global corporations dominate the market by leveraging extensive research and development and advanced techniques. These companies pursue strategic initiatives such as mergers, acquisitions, partnerships, and collaborations to enhance their product offerings and expand into new markets.
New companies are impacting the industry by introducing innovative products to meet the demand of specific market sectors. Continuous progress in product offerings amplifies this competitive environment. Major players in the location analytics industry include SAS Institute; Esri; Oracle; Pitney Bowes; Microsoft; Galigeo; Cisco Systems; IBM; Purple; GeoMoby; Alteryx, Inc.; CleverAnalytics; IndoorAtlas; Lepton Software; and Quuppa.
Oracle Corporation provides products and services that address enterprise information technology environments globally. Oracle Fusion cloud enterprise performance management, Oracle Fusion cloud supply chain, as well as manufacturing management, enterprise resource planning (ERP), Oracle Advertising, NetSuite applications suite, Oracle Fusion cloud human capital management, and Oracle Fusion Sales, Service, and Marketing, are few of the cloud software programs included in the company's Oracle software as a service. It also provides licensed cloud-based business infrastructure solutions, middleware (which contains tools for development and other purposes), and enterprise databases such as Oracle and Java. Also, the company provides Generative AI powered by state-of-the-art LLMs from Cohere, ensuring unparalleled data security, trusted performance, and versatile deployment options for text generation. Oracle Corporation offers oracle spatial and graph, oracle analytics cloud, and oracle database with location intelligence, enabling geospatial data analysis, mapping, and real-time insights for businesses in retail, logistics, and smart city applications.
Microsoft is a multinational technology company headquartered in Redmond, Washington. Microsoft offers various products and services, including operating systems, productivity software, gaming consoles, and cloud-based solutions. Its flagship product, Microsoft Windows, is the world's most widely used operating system. Other popular products include Microsoft Office, Skype, and the Xbox gaming console. Microsoft has invested heavily in artificial intelligence (AI) and machine learning technologies in recent years. The company has been using AI to improve its products and services and developing new AI-based applications. For Instance, Microsoft's Cortana virtual assistant uses machine learning to provide personalized recommendations and insights to users. Microsoft offers Azure Maps, Power BI with geospatial analytics, and AI-driven location intelligence, enabling real-time mapping, spatial analysis, and data visualization for industries like retail, logistics, smart cities, and transportation.
Key Companies in Location Analytics Market
- SAS Institute
- Esri
- Oracle
- Pitney Bowes
- Microsoft
- Galigeo
- Cisco Systems
- IBM
- Purple
- GeoMoby
- Alteryx, Inc.
- CleverAnalytics
- IndoorAtlas
- Lepton Software
- Quuppa.
Location Analytics Industry Developments
-
February 2026: Esri made an announcement about the creation of a terrestrial mapping workflow in partnership with Pix4D. As per Esri, this workflow would enable field crews to collect high-resolution spatial information on-site and process within the ArcGIS platform. (source: esri.com)
-
October 2025: TomTom announced the expansion of its partnership with Hyundai AutoEver (HAE). The collaboration will leverage TomTom Real-Time Traffic and Speed Camera Service to improve HMG drivers’ in-dash navigation experience. (source: tomtom.com)
Location Analytics Market Segmentation
By Component Outlook (Revenue USD Billion, 2021–2034)
- Services
- Solution
- Geocoding and Reverse Geocoding
- Data Integration and ETL
- Reporting and Visualization
- Thematic Mapping and Spatial Analysis
- Others
By Location Type Outlook (Revenue USD Billion, 2021–2034)
- Indoor
- Outdoor
By Application Outlook (Revenue USD Billion, 2021–2034)
- Risk Management
- Emergency Response Management
- Customer Experience Management
- Remote Monitoring
- Supply Chain Planning and Optimization
- Sales and Marketing Optimization
- Predictive Assets Management
- Inventory Management
- Other
By Verticals Outlook (Revenue USD Billion, 2021–2034)
- Retail
- Manufacturing
- Govt & Defense
- Media & Entertainment
- Transportation
- Energy & Utilities
- Others
By Regional Outlook (Revenue USD Billion, 2021–2034)
- North America
- US
- Canada
- Europe
- Germany
- France
- UK
- Italy
- Spain
- Netherlands
- Russia
- Rest of Europe
- Asia Pacific
- China
- Japan
- India
- Malaysia
- South Korea
- Indonesia
- Australia
- Rest of Asia Pacific
- Middle East & Africa
- Saudi Arabia
- UAE
- Israel
- South Africa
- Rest of Middle East & Africa
- Latin America
- Mexico
- Brazil
- Argentina
- Rest of Latin America
Location Analytics Market Report Scope
| Report Attributes | Details |
| Market Size Value in 2025 | USD 28.84 billion |
| Market Size Value in 2026 | USD 31.21 billion |
| Revenue Forecast in 2034 | USD 97.20 billion |
| CAGR | 14.5% from 2026–2034 |
| Base year | 2025 |
| Historical Data | 2021–2024 |
| Forecast Period | 2026–2034 |
| Quantitative Units | Revenue in USD billion and CAGR from 2026 to 2034 |
| Report Coverage | Revenue Forecast, Market Competitive Landscape, Growth Factors, and Industry Trends |
| Segments Covered |
|
| Regional Scope |
|
| Competitive Landscape |
|
| Report Format |
|
| Customization | Report customization as per your requirements with respect to countries, regions, and segmentation. |
Source: Polaris Market Research Analysis
Location Analytics Market FAQ's
• The location analytics market size was valued at USD 28.84 billion in 2025 and is projected to grow to USD 97.20 billion by 2034.
• The global market is projected to register a CAGR of 14.5% during the forecast period, 2026-2034.
• North America had the largest share of 37.50% in 2025.
• The key players in the market are SAS Institute; Esri; Oracle; Pitney Bowes; Microsoft; Galigeo; Cisco Systems; IBM; Purple; GeoMoby; Alteryx, Inc.; CleverAnalytics; IndoorAtlas; Lepton Software; and Quuppa.
• The indoor segment is expected to experience a significant CAGR of 25.30% in the global market during the forecast period due to the increasing use of technology to track and analyze customer behavior inside stores, malls, and other indoor spaces.
• The service segment dominated the location analytics market in 2025 with 45.10% due to the increasing demand for managed services, consulting, and support.
Download Sample Report of Location Analytics Market
Please fill out the form to request a customized copy of the research report.
