
Permanent Magnets Market Size & Share Global Analysis Report, 2024-2032
REPORT DETAILS
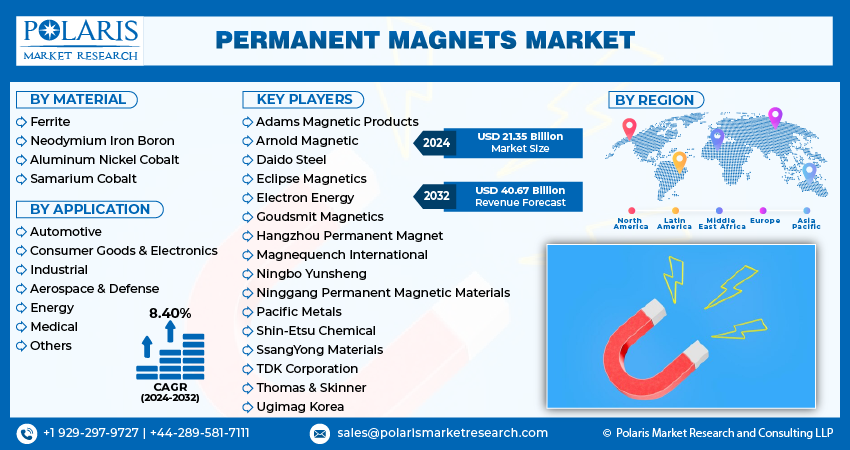
The global permanent magnets market was valued at USD 19.73 billion in 2023 and is expected to grow at a CAGR of 8.40% during the forecast period.
The increasing significance of renewable energy sources like wind and solar power is predicted to positively impact market expansion in the coming years. Currently, wind turbine generators utilize permanent magnets to enhance their efficiency. Particularly, rare earth magnets like Neodymium Ferrite Boron (NdFeB) are predominantly employed in wind turbines due to their advantages, including enhanced reliability and reduced maintenance expenses. In the United States, the demand for rare earth magnets is projected to grow more rapidly than ferrite magnets during the forecast period. This growth is attributed to their extensive use in advanced applications like robotics, wearable devices, electric vehicles, and wind energy.
Source: Polaris Market Research Analysis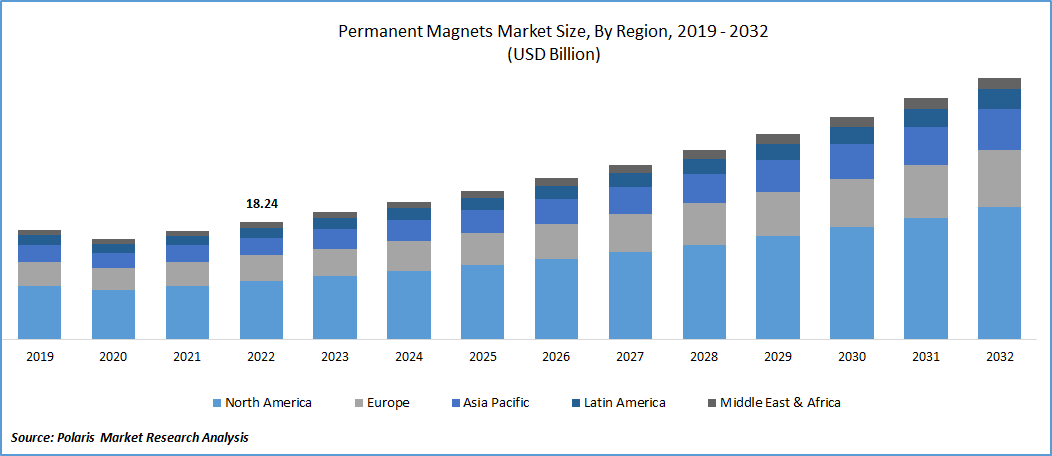
To Understand More About this Research : Download Sample Report
The U.S. is not self-sufficient in the production of permanent magnets. In line with this, certain steps are designed to bolster the resilience of the U.S. economy by fostering a more self-reliant approach to critical raw materials. By supporting the development of domestic sources for rare earth materials, the U.S. government seeks to mitigate the potential negative impacts of supply chain disruptions caused by trade disputes and geopolitical tensions. Through these initiatives, the country intends to ensure a stable supply of essential materials for its industries, thereby reducing vulnerability to external disruptions and maintaining technological and economic competitiveness.
The onset of the COVID-19 pandemic directly influenced the functioning of critical manufacturing and industrial segments within the nation. This, in turn, led to a contraction of approximately 3.5% in the GDP during the fiscal year 2020. The recuperation process began in the final quarter of FY 2020, as the manufacturing sector gradually recommenced its operations. Due to the substantial fiscal aid packages introduced by the U.S. government to support industrial output, there has been a consistent rebound in the domestic permanent magnets market throughout the year 2021.
Source: Polaris Market Research Analysis
Industry Dynamics
Rising demand for permanent magnets from oil and gas sector
The oil and gas sector has witnessed a growing demand for permanent magnets in recent years, and this trend appears to be on a path to permanence. Permanent magnets play a crucial role in this industry due to their exceptional properties, which include maintaining a strong magnetic field without the need for an external power source. One of the primary drivers for their increased use is in the realm of drilling technologies. Advanced drilling equipment relies heavily on permanent magnets to provide efficient and precise control over drilling operations.
These magnets are utilized in various components, such as downhole motors and sensors, helping to improve drilling accuracy and reduce downtime. Additionally, permanent magnets find extensive applications in the seismic exploration phase, where they aid in generating and detecting seismic waves for mapping subsurface oil and gas reserves. Moreover, they are employed in pipeline inspection tools and equipment, enhancing the efficiency of maintenance and ensuring the integrity of critical infrastructure. As the oil and gas sector continues to seek ways to maximize production efficiency and reduce operational costs, the demand for permanent magnets is expected to remain a permanent fixture in its technological landscape.
Report Segmentation
The market is primarily segmented based on material, application, and region.
| By Material | By Application | By Region |
|
|
|
Source: Polaris Market Research Analysis
To Understand the Scope of this Report : Request Customization
By Material Analysis
Ferrite material segment held the largest share in 2022
Ferrite material garnered the largest share in 2022. Ferrite magnets find their primary application in motor-related uses. A significant portion, specifically around 65% of the overall volume of ferrite magnets, is employed in various motor applications. This allocation is further broken down into different sectors, with approximately 18% in automotive motors, 14% in appliance motors, 13% in HVAC motors, and 12% in industrial and commercial motors. These magnets also find utilization in various other areas, such as loudspeakers, separation equipment, Magnetic Resonance Imaging, switches, and lifting applications.
Neodymium Iron Boron (NdFeB) will grow at a rapid pace. Over the last half-decade, there has been a significant expansion in the range of applications for NdFeB magnets. Beyond their traditional uses, these magnets are now experiencing notable adoption in electric and hybrid electric vehicle motors, wind power generators, AC compressors and fans, and storage systems. Alnico-based permanent magnets were regarded as the strongest magnets available. According to Magnet Applications, Inc., alnico magnets exhibit an average Energy Density (BHmax) of 7 MGOe, which is higher than ferrite magnets but notably lower than NdFeB magnets.
By Application Analysis
Consumer electronics segment accounted for the largest market share in 2022
The consumer electronics segment held the largest market share in 2022. It finds utilization in a wide range of applications, including air conditioning compressors, fans, recorders, computer cables, DVDs, cameras, watches, ear-buds, loudspeakers, mobile phones, printers, fax stepper motors, printing machines, Hard disk drives, power tool motors. The expansion in production within these specified product categories is projected to play a direct role in supporting the segment’s growth.
The automotive segment will grow at a rapid pace. As per the Arnold Magnetic Technologies estimates, a typical car incorporates approximately 100 permanent magnet devices. While ferrite magnets remain the preference for most car manufacturers, changing consumer preferences towards lighter vehicles have generated a demand for compact and high-performance magnetic components. The push towards enhancing vehicle energy efficiency is expected to contribute positively to the growth of this automotive segment throughout the projected timeline.
Within the oil and gas sector, there exists a notable demand from industry participants to optimize the utilization of energy-intensive technological procedures, such as electronic submersible pumps, while simultaneously minimizing power consumption. This scenario offers a promising avenue for market vendors dealing in permanent magnets. In contrast to asynchronous electric motors commonly employed to drive electrical submersible pumps, permanent magnet motors (PMM) possess several distinctive attributes that render them economically appealing within the oil and gas industry.
The rising demand for the product within the medical sector is predominantly propelled by its growing incorporation into various medical devices. These devices encompass critical technologies like Magnetic Resonance Imaging (MRI), body scanners, and heart pacemakers. In Magnetic Resonance Imaging (MRI) machines, permanent magnets generate the magnetic fields required for imaging procedures. Similarly, in body scanners, these magnets aid in producing the necessary magnetic fields to capture detailed internal images of the human body.
Source: Polaris Market Research Analysis
By Regional Analysis
APAC registered the highest growth rate in the study period in 2022
APAC is projected to witness a higher growth rate for the market. This region is a global hub for manufacturing activities, particularly in automotive and electronic production. China, Japan, and South Korea have emerged as key focal points for producing computer hardware components, encompassing hard disks, chips, and microprocessors. This robust manufacturing landscape has directly fueled an increased demand for permanent magnets. Electronics and hardware manufacturers rely heavily on these magnets, leading to widespread consumption within the region.
Source: Polaris Market Research Analysis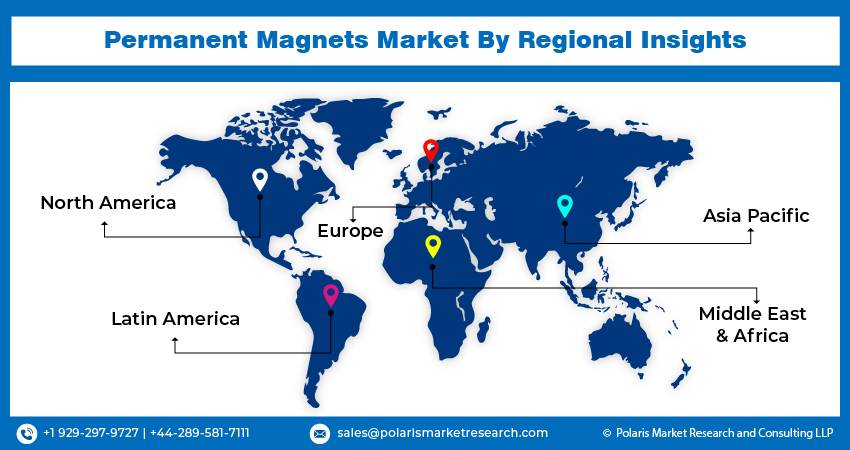
Competitive Insight
The permanent magnets market is fragmented and is anticipated to witness competition due to several players' presence. Major key players in the market are constantly upgrading their technologies to stay ahead of the competition and to ensure efficiency, integrity, and safety. These players focus on partnership, product upgrades, and collaboration to gain a competitive edge over their peers and capture a significant market share.
Some of the major players operating in the global market include:
- Adams Magnetic Products
- Arnold Magnetic
- Daido Steel
- Eclipse Magnetics
- Electron Energy
- Goudsmit Magnetics
- Hangzhou Permanent Magnet
- Magnequench International
- Ningbo Yunsheng
- Ninggang Permanent Magnetic Materials
- Pacific Metals
- Shin-Etsu Chemical
- SsangYong Materials
- TDK Corporation
- Thomas & Skinner
- Ugimag Korea
Recent Developments
- In June 2025, TDK Corporation signed an MoU with Siemens Gamesa Renewable Energy to supply permanent magnets for wind turbines, under the oversight of Japan’s Ministry of Economy, Trade and Industry (METI), supporting the development of a wind turbine supply chain.
- In June 2025, Electron Energy Corporation, together with Dexter Magnetic Technologies and Magnetic Component Engineering, rebranded as Permag to strengthen global leadership in rare earth magnet procurement, design, and manufacturing, while continuing operations under their existing names.
- In May 2025, Bunting Magnetics Co. opened a new advanced manufacturing facility in Newton, Kansas, to expand global production of magnetic cylinders used in aluminum beverage can printing.
- In July 2023, Eclipse Magnetics introduced the Ultralift E, a new solution designed for efficient and reliable lifting and handling tasks that require high performance. It utilizes permanent magnetic technology and incorporates an integrated locking mechanism on its handle.
- In June 2023, Goudsmit Magnetics Group introduced the E-gripper, an innovative magnetic gripper that operates through electrical switching.
- In May 2023, Goudsmit Magnetics Group unveiled a hygienic magnetic filter meticulously designed to meet the rigorous requirements of the food industry. This specialized filter incorporates strong Neodymium magnets to efficiently extract extremely small ferrous particles and iron dust from challenging substances like pastes, powders, cocoa, and fruit juices.
- In July 2022, TDK Corporation broadened its range of tunnel-magnetoresistance (TMR) angle sensors by introducing the TAS4240 angle sensor. This new addition is tailored for utilization in both automotive and industrial settings. TMR technology, an innovative magnetic sensor technology, relies on the characteristics of permanent magnets and the magneto-resistive effect to achieve precise measurements of angles and positions.
Permanent Magnets Market Report Scope
| Report Attributes | Details |
| Market size value in 2024 | USD 21.35 billion |
| Revenue forecast in 2032 | USD 40.67 billion |
| CAGR | 8.40% from 2024 - 2032 |
| Base year | 2023 |
| Historical data | 2019 - 2022 |
| Forecast period | 2024 - 2032 |
| Quantitative units | Revenue in USD billion and CAGR from 2024 to 2032 |
| Segments covered | By Material, By Application, By Region |
| Regional scope | North America, Europe, Asia Pacific, Latin America, Middle East & Africa |
| Customization | Report customization as per your requirements with respect to countries, region and segmentation |
Source: Polaris Market Research Analysis
Permanent Magnets Market FAQ's
The global permanent magnets market size is expected to reach USD 40.67 billion by 2032
Adams Magnetic Products,Arnold Magnetic,Daido Steel,Eclipse Magnetics,Electron Energy,Goudsmit Magnetics are top market players in the market
Asia Pacific region contribute notably towards the global Permanent Magnets Market.
The global permanent magnets market is expected to grow at a CAGR of 8.4% during the forecast period.
based on material, application, and region key segments in the Permanent Magnets Market.
Download Sample Report of Permanent Magnets Market
Please fill out the form to request a customized copy of the research report.


