
RAN Intelligent Controller Market Size, Growth Analysis, 2024-2032
REPORT DETAILS
REPORT DETAILS
ABOUT THIS REPORT
RAN Intelligent Controller Market Summery
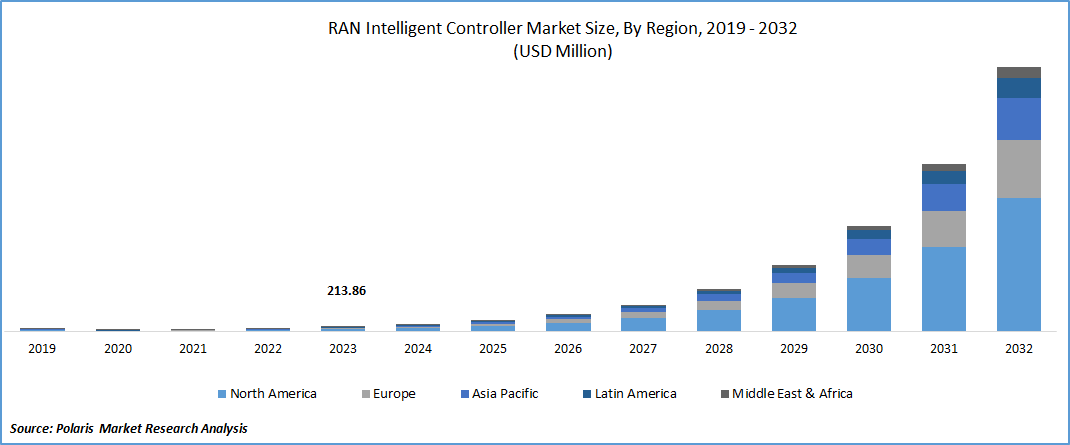
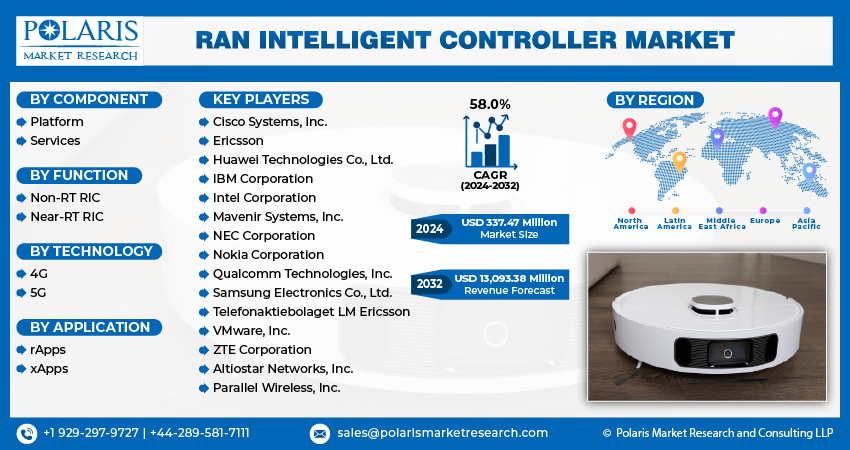
RAN Intelligent Controller Market size was valued at USD 213.86 million in 2023. The market is anticipated to grow from USD 337.47 million in 2024 to USD 13,093.38 million by 2032, exhibiting the CAGR of 58.0% during the forecast period.
Market Statistics
The RAN intelligent controller is a software solution designed to optimize baseband communication functions within the Radio Access Network (RAN). Its significance lies in efficiently managing key 5G network functions, including low-latency applications and network slicing.
The RAN intelligent controller industry is currently in a high-growth stage, and the pace of market expansion is accelerating. The market is characterized by consolidation, anticipating moderate competition among key players. Major industry participants are making substantial investments in Research & Development (R&D) to drive innovation. In a notable development, in March 2021, Nokia, based in Finland, unveiled the Service Enablement Platform (SEP). This marked the first commercial solution integrating Artificial Intelligence (AI), Machine Learning (ML), and radio network programmability. The objective behind this launch was to offer innovative use cases and unique value to the market, showcasing the commitment to advancing technology in the RAN intelligent controller sector.
To Understand More About this Research: Download Sample Report
- For instance, in November 2023, Ericsson unveiled the newest generation of processors within the company’s portfolio. This development aims to assist communications service providers (CSPs) in optimizing their utilization of both current and future radio access technology advancements.
The growth of the RAN intelligent controller market share is primarily propelled by factors such as increased demand for network enhancement, collaborative efforts across ecosystems, and the adoption of open interfaces. However, challenges related to implementation and integration pose hurdles to market growth. Furthermore, the escalating demand for advanced network management presents promising opportunities for market expansion in the forecast period.
Industry Growth Drivers
Increasing demand for network enhancement is projected to spur the product demand.
The surge in the desire for network enhancement stands out as a key driver propelling the RAN intelligent controller market trends. As mobile networks advance into the realm of 5G and beyond, the necessity for intelligent controllers becomes paramount. These controllers play a critical role in optimizing network performance, ensuring efficient resource management, and delivering heightened user experiences. Their orchestration and control functions within the RAN are crucial for achieving optimal connectivity and expansive coverage.
Enhanced collaboration across ecosystems is expected to drive RAN intelligent controller market growth.
Collaborative efforts across diverse ecosystems significantly fuel the growth of the RAN intelligent controller market forecast. In the face of escalating complexity within telecom networks and the integration of various technologies, collaboration among stakeholders emerges as a crucial factor. Intelligent controllers, in this context, play a pivotal role by facilitating seamless coordination among different components of the RAN. This fosters collaboration among key players in the ecosystem, including network equipment providers, service providers, and other industry stakeholders.
Industry Challenges
Difficulties in implementation and integration is likely to impede the RAN intelligent controller market growth opportunities.
Despite the positive momentum, the market faces challenges related to the difficulties in implementation and integration. Implementing intelligent controllers into existing network architectures can be complex, requiring seamless integration with legacy systems. Additionally, ensuring compatibility with diverse equipment and technologies poses challenges, leading to potential delays and complexities in deployment.
Report Segmentation
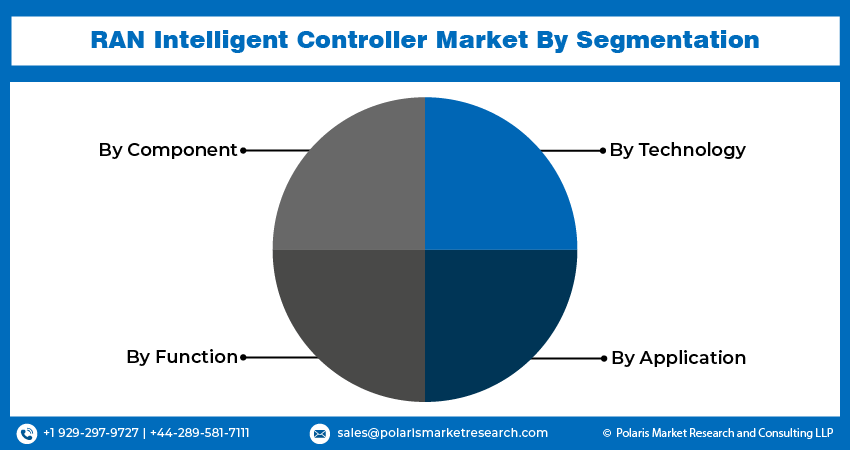
The market is primarily segmented based on component, function, technology, application, and region.
| By Component | By Function | By Technology | By Application | By Region |
|
|
|
|
|
To Understand the Scope of this Report: Request Customization
By Component Analysis
Services segment is expected to witness highest growth during forecast period
The services segment is projected to grow at a CAGR during the projected period in the RAN intelligent controller market opportunities. Various significant factors propel this. The range of services for the RAN intelligent controller encompasses integration, deployment, support, and consulting. Deploying a RAN can present challenges, including integration with legacy systems, high complexity, and technological immaturity. Therefore, availing support, integration, and deployment services becomes crucial for mobile network operators, aiding them in the efficient and cost-effective implementation of the platform.
By Function Analysis
Non-Real-Time-RAN Intelligent Controller (Non-RT RIC) segment is expected to dominate the market during forecast period
In 2023, the market share was predominantly influenced by Non-Real-Time-RAN Intelligent Controllers (Non-RT RIC), commanding a significant market share. Non-real-time RIC functionalities encompass device management, fault management, and performance management, among others. Its role in optimizing the intelligent Radio Access Network (RAN) involves providing model management, information, and policy-based guidance to the Near-Real-Time RIC. Leveraging artificial intelligence (AI), machine learning (ML), and data analytics, the Non-RT RIC can discern actions for RAN optimization, contributing to the overall efficiency of the network.
By Technology Analysis
5G segment is expected to witness highest growth during forecast period
5G emerged as the dominant player in the technology segment. The rapid adoption of 5G is attributed to the increasing sales of 5G-enabled handsets and the expanding coverage of 5G networks. Moreover, government initiatives are likely to boost the growth of this segment.
By Application Analysis
rApps segment is expected to dominate the opportunties during forecast period
In 2023, the RAN intelligent controller market share was predominantly influenced by rApps, commanding a significant market share. The growth of reps (RAN intelligent controller applications) in the market is propelled by their pivotal role in optimizing network functions. These applications contribute to enhanced performance, efficient resource management, and improved user experiences, driving their adoption and prominence within the evolving landscape of intelligent radio access networks.
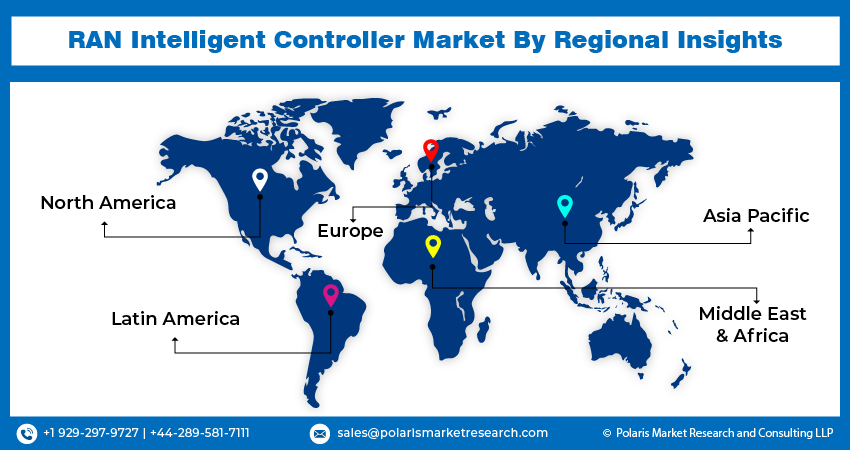
Regional Insights
Asia-Pacific region dominated the global market in 2023
Asia-Pacific dominated the global market in 2023 and is expected to continue to do so. The substantial market share of the area is driven by the adoption of smart technologies like AI and ML in developing countries like China and India. The surge in smartphones, IoT devices, and digital services has led to a significant rise in data traffic, further fueling the demand for RAN intelligent controllers in the Asia-Pacific region.
However, in North America, the market is lucrative, driven by robust technological advancements and widespread adoption of 5G networks. The region's focus on innovation, coupled with increasing demand for seamless connectivity and network optimization, contributes to the accelerated growth and prominence of RAN intelligent controllers.
Key Market Players & Competitive Insights
The RAN intelligent controller market companies is fragmented and is anticipated to witness competition due to several players' presence. Major service providers in the market are constantly upgrading their technologies to stay ahead of the competition and to ensure efficiency, integrity, and safety. These players focus on partnership, product upgrades, and collaboration to gain a competitive edge over their peers and capture a significant market share.
Some of the major players operating in the global market include:
- Cisco Systems, Inc.
- Ericsson
- Huawei Technologies Co., Ltd.
- IBM Corporation
- Intel Corporation
- Mavenir Systems, Inc.
- NEC Corporation
- Nokia Corporation
- Qualcomm Technologies, Inc.
- Samsung Electronics Co., Ltd.
- Telefonaktiebolaget LM Ericsson
- VMware, Inc.
- ZTE Corporation
- Altiostar Networks, Inc.
- Parallel Wireless, Inc.
Recent Developments
- In January 2025: VIAVI Solutions launched the TeraVM AI RAN Scenario Generator, an upgrade to its RAN Intelligent Controller Test platform. It simulates real-world RAN behavior for system testing and supports NTIA Public Wireless Supply Chain Innovation Fund applicants. Using AI and machine learning, it optimizes network performance and energy use, supporting simulations with up to 10,000 users and thousands of cells, deployable in the cloud or on dedicated servers.
- In November 2024: EchoStar’s Hughes Network Systems won a USD 6.5 million contract to deploy a 5G Open RAN prototype with a RAN Intelligent Controller at Fort Bliss, Texas. The project will test military network applications and later connect to Hughes' commercial network. Hughes and the U.S. Army will assess features like rapid spectrum changes for resilient communications.
- In September 2024: Fujitsu introduced Virtuora® Intelligent Control, a RAN Intelligent Controller platform to simplify 5G Open RAN lifecycle management. Using AI and machine learning, it enables real-time decision-making, optimizes network performance, and supports monetization options like RAN slicing. It also integrates with Virtuora SMO for better RAN optimization and service quality.
Report Coverage
The RAN intelligent controller market report emphasizes on key regions across the globe to provide better understanding of the product to the users. Also, the report provides market insights into recent developments, trends and analyzes the technologies that are gaining traction around the globe. Furthermore, the report covers in-depth qualitative analysis pertaining to various paradigm shifts associated with the transformation of these solutions.
The report provides detailed analysis of the market while focusing on various key aspects such as competitive analysis, component, function, technology, application, and their futuristic growth opportunities.
RAN Intelligent Controller Market Report Scope
| Report Attributes | Details |
| Market size value in 2024 | USD 337.47 million |
| Revenue forecast in 2032 | USD 13,093.38 million |
| CAGR | 58.0% from 2024 – 2032 |
| Base year | 2023 |
| Historical data | 2019 – 2022 |
| Forecast period | 2024 – 2032 |
| Quantitative units | Revenue in USD million and CAGR from 2024 to 2032 |
| Segments covered |
|
| Regional scope |
|
| Competitive Landscape |
|
| Report Format |
|
| Customization | Report customization as per your requirements with respect to countries, region and segmentation. |
Delve into the intricacies of RAN Intelligent Controller Market in 2024 through the meticulously compiled market share, size, and revenue growth rate statistics by Polaris Market Research Industry Reports. Uncover a comprehensive analysis that not only projects market trends up to 2032 but also provides valuable insights into the historical landscape. Immerse yourself in the depth of this industry analysis by acquiring a complimentary Download Sample Report.
FAQ's
Cisco Systems, Inc., Ericsson, Huawei Technologies Co., Ltd., IBM Corporation, Intel Corporation, Mavenir Systems, Inc,are the key companies in RAN Intelligent Controller Market.
RAN Intelligent Controller Market exhibiting the CAGR of 58.0% during the forecast period
The RAN Intelligent Controller Market report covering key segments are component, function, technology, application, and region.
Increasing demand for network enhancement is projected to spur the product demand.
The global RAN intelligent controller market size is expected to reach USD 13,093.38 Million by 2032
Download Sample Report of RAN Intelligent Controller Market
Please fill out the form to request a customized copy of the research report.
