
Rapid Oral Fluid Screening Device Market Share, Size, Trends, Industry Analysis Report, 2020-2027
REPORT DETAILS
REPORT DETAILS
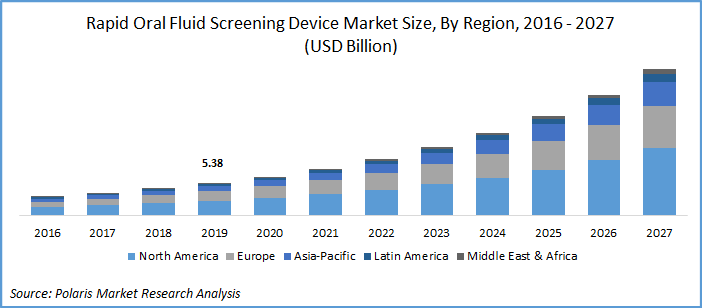
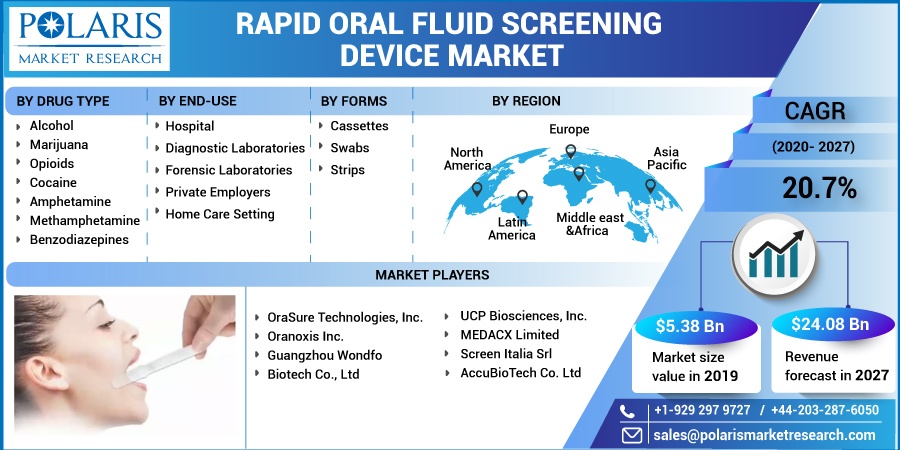
Global rapid oral fluid screening device market was valued at USD 5.38 billion in 2019 and is expected to grow at a CAGR of 20.7% during the forecast period. The lucrative growth of the market can be attributed to the increasing alcohol & drug consumption. Additionally, stringent regulations imposed by government cross the regions pertaining to consumption of illegal narcotics is driving the demand for rapid oral fluid screening devices over the forecast period.
The factors for growth of global rapid oral fluid screening device market include increasing alcohol & drug consumption. For instance, as per the, the National Survey on Drug Use and Health (NSDUH) report in 2018, 14.4 million adults have alcohol addiction in U.S. With the rising number of addicts, the requirement for drug and alcohol testing is growing, thus creating ample opportunities for device manufacturers.
Know more about this report: Download Sample Report
Industry Dynamics
Growth Drivers
The market is drive by rising consumption of drugs and alcohol among youths and adults. Alcohol and drug abuse are rising at a rapid rate in across the nations worldwide which result into adoption of more drug and alcohol testing and hence creating endless opportunities in the market. The product is recognized as trustworthy medium for detecting the harmful effects of drugs. These samples are feasible with respect to collection and have less or no risk of adulteration, thereby propelling the growth in the global market. Moreover, increasing research & development activities to develop oral fluid screening devices and rising product launches is expected to fuel market growth.
Know more about this report: Download Sample Report
For instance, in September 2018, Premier Biotech, Inc., a player in the market received FDA approval for two additional fluid assays OralTox, named Methadone and Oxycodone which helps in reducing the symptoms caused by stopping the consumption of drugs and alcohol.
Rapid Oral Fluid Screening Device Market Report Scope
The rapid oral fluid screening device market is primarily segmented on the basis of drug type, forms, end-use, and region.
| By Drug Type | By End-Use | By Forms | By Region |
|
|
|
|
Know more about this report: Download Sample Report
Insight by Drug Type
On basis of drug type, the rapid oral fluid screening device market is divided into alcohol, marijuana, opioids, cocaine, amphetamine, methamphetamine, benzodiazepines, and others. Alcohol segment accounted for the highest revenue share in 2019. This growth is due to easy availability of alcohol worldwide and is cost effective. Moreover, some people consume it as medicine due to its associated benefits including relief in severe cold.
Insight by Form
Based on form, the rapid oral fluid screening device market is bifurcated into cassettes, strips, and swabs. Among these three, the strips segment dominated the market in 2019, globally. Some of the advantages are, portability, with the maximum convenience involved, this makes strip a viable option as comparing with other forms. Moreover, strips are witnessed to be highly cost-effective as comparing with swabs and cassettes, which renders them favorable to use.
Insight by End-Use
The end-use segment is divided into hospital, diagnostic laboratories, forensic laboratories, private employers, and home care setting. Hospitals segment is estimated for the highest global revenue share in 2019 owing to the increasing drug addiction cases and rising dependency on hospitals and rehabilitation centers for the treatment of alcohol or drug addiction. Increasing authenticity of hospitals and government legal support to the hospitals increases their demand and efficacy in the global market. Moreover, increasing infrastructure facilities in hospitals makes them leading segment as compared to other end-use segments.
Geographic Overview
North America is predicted to hold dominant share during the forecast period. The market growth can be attributed to factors such as increasing prevalence of drug abuse and rigid regulations and mandates for drug and alcohol testing by the regulatory authorities. For instance, as per the National Institute on Drug Abuse, in 2018, 21% to 29% of patients were prescribed opioids for chronic pain, and in same year, 46,802 Americans demised due to opioid overdose. Such statistical data prove that there is an extreme need for the screening of drug abuse mainly in-home care settings, roadside testing, and workplaces.
Moreover, after North America, Europe and Asia Pacific hold a significant portion in the global market and is expected to grow at an effective rate throughout the forecast period. This growth is attributed to rising alcohol and drugs consumption and increasing healthcare awareness amongst the population. Moreover, increasing new product innovations by the key market players and government support surges the market growth in the region. Additionally, in June 2020, as per the Times of India, India will roll out its action plan to set up fight against drug abuse and alcohol consumption in the year 2020-21. This action plan will focus on developing the treatment and de-addiction facilities in several vulnerable districts.
Competitive Insights
Some of the major market players in the global market include OraSure Technologies, Inc., Oranoxis Inc., Guangzhou Wondfo Biotech Co., Ltd, UCP Biosciences, Inc., MEDACX Limited, Screen Italia Srl, and AccuBioTech Co. Ltd., among others.
Research Methodology
A robust system of research, verification, and forecasting designed to ensure reliable and actionable market insights.
Polaris Market Research & Consulting, Inc. uses a clear and structured approach to deliver insights that clients can rely on. The process combines detailed primary and secondary research, including direct communication with industry experts. The detailed information helps build a complete picture of market trends and developments. Secondary data is gathered from credible sources such as industry reports, company filings, government source links, and trusted organization databases. It is then cross-checked through discussions with key stakeholders across the value chain. Market size and forecasts are developed using both bottom-up and top-down methods to ensure accuracy and consistency in the final results.
1. Project Setup
Step 1 & 2:
- We start every project by clearly understanding the client’s objective or goal, then defining the market scope, and aligning regions, segments, and timelines.
- Once the foundation is set, we collect data from all-around of sources, including company reports, government databases, and paid industry platforms.
- Our research is based on secondary data, which helps us build a strong understanding of the market across regions and industries. Then we validate this information through primary research by speaking directly with industry experts, companies, and stakeholders.
- By combining secondary and primary research, we ensure that our market insights are accurate, practical, and closely aligned with real market conditions.
2. Data Collection
We gather information from both public and verified sources:
3. Data Structuring
Step 3:
- All collected data is organized into a consistent format to ensure accurate analysis. Since inputs come from multiple sources, they are standardized and aligned before use.
- The data is segmented by product, application, and region, and mapped across a defined historical period (2020–2024). All values are converted into common units (USD Mn/Bn), and volume and pricing are aligned where required to estimate revenue.
- Any overlaps or inconsistencies are reviewed and adjusted to maintain accuracy (<5% variance threshold).
- The result is a structured dataset that allows for clear comparison across regions and supports reliable analysis and forecasting.
Structured Market Dataset, USD Mn/Bn
| Region | Segment | VolumeUnits | Avg PriceUSD | RevenueUSD Mn | Share % |
|---|---|---|---|---|---|
| North America | Product A | 250 | 2.5 | 500 | 15% |
| Product A | XX | XX | XX | XX | |
| Product A | XX | XX | XX | XX | |
| Consistent methodology applied across regions | |||||
4. Market Estimation
Step 4: TOP-DOWN APPROACH
- We start with the overall market size at a global or macro level.
- The market is then narrowed down based on scope and industry relevance.
- We apply penetration rates and split the data by region and segment.
- This helps us estimate the market size for specific segments.
- The numbers are validated through cross-checks to ensure accuracy.
Step 5: BOTTOM-UP APPROACH
- We begin by analyzing data from leading companies in the market.
- Revenue data is collected and mapped across different segments.
- The data is then aggregated to estimate the total market size.
- To fill in any gaps, adjustments are made based on industry standards.
- Validation checks make sure that the results are correct.
5. Forecasting
Step 6:
At Polaris Market Research & Consulting, Inc., we employ a methodical forecasting strategy. This approach blends the analysis of historical data with real-time market validation. To forecast future trends with precision, we examine past patterns, pricing fluctuations, and the interplay of supply and demand. To ensure our conclusions reflect the present market landscape, we actively seek input from industry experts and key stakeholders.
To refine our predictions, we carefully consider critical elements such as market drivers and restraints, fluctuations in raw material costs, emerging technologies, and the production capabilities of various regions. Furthermore, we assess regulatory frameworks and potential policy shifts to gauge their potential impact on market expansion.
All this information is synthesized to generate precise forecasts for each segment and region. These forecasts illuminate the current state of the market and highlight forthcoming opportunities.
6. Validation & Triangulation
Step 7:
In the final stage, we validate all our estimates using a triangulation method, where data is cross-checked from multiple reliable sources, like company data, primary interviews, and secondary research. This helps us make sure that our numbers are correct and fit with the rest of the market.
This process involves verifying data consistency across various segments and geographic areas. It also requires comparing historical trends with the assumptions support the forecast. Any discrepancies involve adjustments to ensure everything remains aligned and dependable.
Once the data is finalized, we prepare the final outputs, including market size estimates, segment-wise breakdowns, and growth metrics. These are delivered in structured formats such as tables, charts, and data files for easy analysis and use.
We collaborate closely with clients, ensuring the final products align with their requirements. This includes offering tailored adjustments, supplementary data analyses, and continuous assistance. Furthermore, we monitor market trends post-delivery, providing updates and refinements to maintain the insights' relevance as time passes.
Triangulation Framework
Estimates are cross-verified across three sources:
Company-level data
• Primary inputs from industry participants
• Secondary benchmarks and published data
Variance maintained within +5-10%
Adjustments applied to align estimates
Segment values validated against overall market structure
Data Consistency & Integrity
Segment totals validated to 100%
Regional estimates aligned with global market size
Historical trends compared against forecast outputs
Assumptions reviewed for cross-segment and regional alignment
Final Outputs
Deliverables
Client Alignment & Support
- Deliverables are aligned with defined client requirements and scope
- Custom data cuts and segment splits are incorporated as required
- Post-delivery queries are addressed through analyst interactions
- Additional clarifications and data support are provided upon request
Client Continuity & Updates
- Market developments are tracked post-delivery to capture changes in key trends
- Updated data and revisions are provided based on new market inputs
- Additional refinements and data cuts are shared as required
- Continued analyst engagement supports evolving client requirements
Download Sample Report of Rapid Oral Fluid Screening Device Market Share, Size, Trends, Industry Analysis Report, 2020-2027
Please fill out the form to request a customized copy of the research report.
