Release Liners Market Share, Size, Trends, Industry Analysis Report, 2022 - 2030

Release Liners Market Share, Size, Trends, Industry Analysis Report, 2022 - 2030

REPORT DETAILS

Report Code: PM2868
No. of Pages: 117
Format: PDF
Published Date:
Base Year: 2021
Author: Pranshu Trivedi
Historical Data: 2018-2020

REPORT DETAILS

Report Code: PM2868
Published Date:
No. of Pages: 117
Historical Data: 2018-2020
Format: PDF
Author: Pranshu Trivedi
Base Year: 2021
Release Liners Market Share, Size, Trends, Industry Analysis Report, By Material Type (Silicone, and Non-Silicone); By Substrate Type; By Labelling Technology; By Application; By Region; Segment Forecast, 2022 - 2030

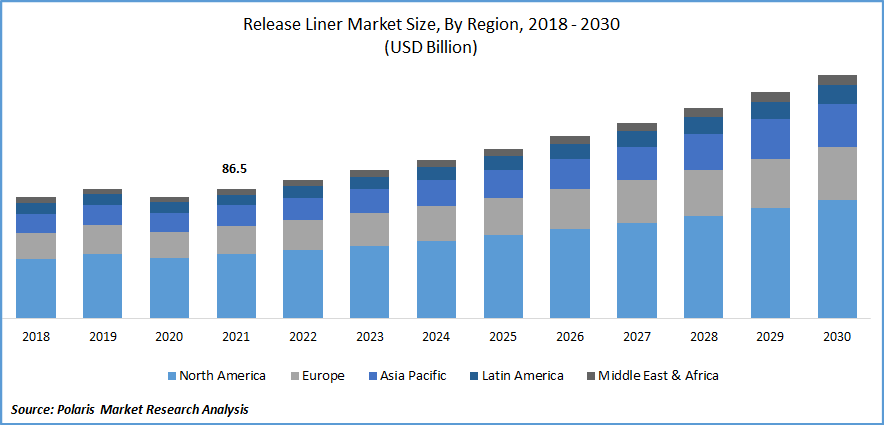
The global release liners market was valued at USD 86.5 billion in 2021 and is expected to grow at a CAGR of 7.3% during the forecast period.

The release liner is often referred to as backing paper or a container. Until it is ready to release, it is employed to move or hold onto the sticky substrate. It may be composed of paper, films, poly-coated paper, or some other unusual substrate including metalized films. The silicone coating on the release liner substrate, which covers the majority of the substrate, enables whatever the liner is transporting to release at the right moment. They are extensively employed in medical applications, using metalized sheets or films. Weatherproofing, roof shingles, and insulating products are all covered under the industrial use of liners.

Release Liners Market Size
Know more about this report: Download Sample Report

The global market is expected to increase because of the growing demand for release liners from a variety of industries, including graphic, medical, and packaging. The main manufacturers are altering their strategies to be more sustainable, which involves coming up with environmentally friendly solutions. For instance, In May 2021, Loparex, a manufacturer of release liners, enhanced its line of sustainable products when it received ISCC PLUS-Certified Solutions certification for its Forchheim, Germany, manufacturing facility.

The market is fueled by the significant effects of digital printing in several nations. This arrangement is incredibly affordable, takes little time to set up, and appeals to a variety of industrial verticals.

However, release liners' market expansion is expected to be hampered by stringent government rules and regulations about environmental sustainability. The majority of release liners are constructed from polyvinyl chloride and HDPE materials, both of which pose risks to human and environmental health. The use of dangerous chemicals, such as PVC, is prohibited by strict European Union rules and FDA regulations, which is anticipated to hinder the market expansion of release liners.

Due to travel restrictions and the suspension of production operations, the COVID-19 epidemic reduced sales expectations. Due to sluggish demand from the food and beverage, electrical and electronic industries, sales of release liners have dramatically decreased. However, due to its numerous uses in the healthcare sector for the packaging of pharmaceutical and medical device products, demand for release liners has since recovered. The whole packaging business is showing signs of a quick revival with accelerated vaccination drives and the restart of production.

Release Liners MarketKnow more about this report: Download Sample Report

Industry Dynamics

Growth Drivers
The release liners market is expanding primarily due to the growing demand for industrial labels, which are crucial components of the packaging industry as a whole and the product supply chain. The major players are also focusing on the launches for the release liners for the packaging industry. For instance, in September 2022, EasiLiner expands Essentra Tapes' product line to help e-commerce packaging manufacturers. These paper-based silicon releases liners shield pressure-sensitive adhesive lines. When a glue line is employed in production, EasiLiner permits the preservation of adhesive characteristics on packing types. It offers sheet plant converters a comprehensive opening and closing solution when used in conjunction with the SF-AS DH1 applicator and the widely utilized RippaTape collection.

Furthermore, the need for release liners in the food & beverage industry is supporting growing packaged food consumption as a result of its benefits, such as ready-to-eat options, rapid cooking, and ease of eating, which is likely to propel market expansion. Due to the rising demand for packaging items worldwide as a result of an expanding population, there is a significant demand for these liners because labels and tapes are also in great demand.  

In October 2019, the Modern retort beverage line for the manufacture of ready-to-drink ("RTD") coffee and latte beverages was introduced by Berner Food & Beverage, Inc. The new funding increases Berner's beverage production capacity by more than double. It is the company's fastest, most technologically sophisticated, and most versatile beverage reaction line. Therefore, the demand for release liners is also rising as a result of fast urbanization and rising disposable income, as well as the rising demand for packaged food and beverage goods.

Report Segmentation

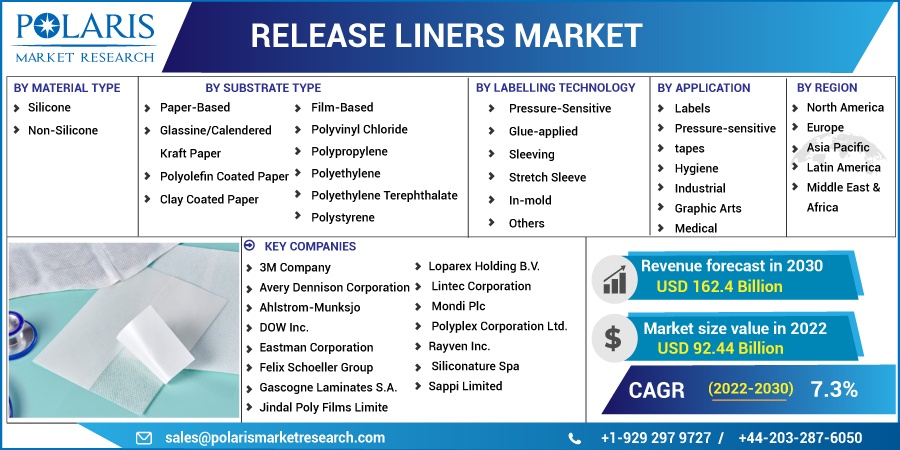
The market is primarily segmented based on substrate type, material type, labeling technology, application, and region.

By Material Type

By Substrate Type

By Labelling Technology

By Application

By Region

  • Silicone
  • Non-Silicone
  • Paper-Based
    • Glassine/Calendered Kraft Paper
    • Polyolefin Coated Paper
    • Clay Coated Paper
    • Others
  • Film-Based
    • Polyvinyl Chloride
    • Polypropylene
    • Polyethylene
    • Polyethylene Terephthalate
    • Polystyrene
  • Pressure-Sensitive
  • Glue-applied
  • Sleeving
  • Stretch Sleeve
  • In-mold
  • Others


  • Labels
  • Pressure-sensitive tapes
  • Hygiene
  • Industrial
  • Graphic Arts
  • Medical
  • Others
  • North America (U.S., Canada)
  • Europe (France, Germany, UK, Italy, Netherlands, Spain, Russia)
  • Asia Pacific (Japan, China, India, Malaysia, Indonesia, South Korea)
  • Latin America (Brazil, Mexico, Argentina)
  • Middle East & Africa (Saudi Arabia, UAE, Israel, South Africa)

Know more about this report: Download Sample Report

Paper-based release liners segment is expected to witness the fastest growth

Food items are frequently packaged with release linear paper, a form of packaging film. It is useful for the packaging of ready-to-eat foods such as sandwiches, wrappers, and burgers due to its high tensile strength and barrier properties. The product can also be used in the food service sector to wrap around hot and cold foods and to shield them from sunlight so they stay fresh until they are consumed by customers. Manufacturers are becoming more and more enamored with paper-based liners as they aid in achieving their environmental goals. End-users are increasingly using paper-based liners because they offer higher strength under strain and dependability on high-speed packing processes.

The silicone release liners segment industry accounted for the highest market share in 2021

With the booming demand for labeling in the packaging business, silicone-covered release liners are rapidly gaining traction. Only major manufacturers who needed bulk pressure-sensitive labeling procedures employed silicone-based release liners. However, due to the advancement of silicone release liners, they are being utilized in even more minor procedures and uses. This is mostly because several small-scale manufacturers have entered the market for silicone-coated release liners.

The demand in North America  is expected to witness significant growth

The need for pharmaceutical drugs and medical product packaging and labeling has expanded as the healthcare industry in the U.S. has grown. The region's dominance is anticipated to remain unchallenged during the forecast period due to growing product usage in industrial, medicinal, and hygiene applications. It is projected that factors including rising healthcare spending and consumer knowledge of safe products will support the expansion of the healthcare sector, hence increasing the demand for release liners in the nation.

Further, the Asia-Pacific region led the fastest growth in the market, largely because of the expanding packaging industry. In China, the automobile and healthcare industries are the two main sources of demand for release liners. The rising demand from the medical industry in the region such as for female hygiene, and sanitary pads must also include release liners driving the growth. Due to increased consumer spending on personal care, China's consumption of hygiene products is expected to rise. Due to the government's continued support for these industries, the need for release liners is predicted to rise throughout the projection period, hence supporting market growth in developing countries like China and India.

Competitive Insight

Key players include the market include 3M Company, Avery Dennison Corporation, Ahlstrom-Munksjo, DOW Inc., Eastman Corporation, Felix Schoeller, Gascogne Laminates, Jindal Poly Films, Loparex Holding, Lintec Corporation, Mondi, Mitsubishi Chemical America, Polyplex Corporation, Rayven Inc., Siliconature, Sappi Limited, and Wausau Paper.

Recent Developments

In December 2021, Rayven, a manufacturer of coated functional films, specialty tapes, and specialized release liners, was acquired by Duraco Specialty Tapes.

In July 2020, to lessen the impact of poly-coated kraft (PCK) paper release liners on the environment, Mondi introduced "the first-to-market solution." The NextLiner solution makes use of polymers derived from renewable resources and recycled base paper.

Release Liners Market Report Scope

Report Attributes

Details

Market size value in 2022

USD 92.44 billion

Revenue forecast in 2030

USD 162.4 billion

CAGR

7.3% from 2022 - 2030

Base year

2021

Historical data

2018 - 2020

Forecast period

2022 - 2030

Quantitative units

Revenue in USD billion and CAGR from 2022 to 2030

Segments Covered

By Material Type, By Substrate Type, By Labelling Technology, By Application, By Region

Regional scope

North America, Europe, Asia Pacific, Latin America; Middle East & Africa

Key Companies

3M Company, Avery Dennison Corporation, Ahlstrom-Munksjo, DOW Inc., Eastman Corporation, Felix Schoeller Group, Gascogne Laminates S.A., Jindal Poly Films Limited, Loparex Holding B.V., Lintec Corporation, Mondi Plc, Mitsubishi Chemical America, Inc., Polyplex Corporation Ltd., Rayven Inc., Siliconature Spa, Sappi Limited, and Wausau Paper Inc

Page last updated on: Jan-2023

Research Methodology

A robust system of research, verification, and forecasting designed to ensure reliable and actionable market insights.

Polaris Market Research & Consulting, Inc. uses a clear and structured approach to deliver insights that clients can rely on. The process combines detailed primary and secondary research, including direct communication with industry experts. The detailed information helps build a complete picture of market trends and developments. Secondary data is gathered from credible sources such as industry reports, company filings, government source links, and trusted organization databases. It is then cross-checked through discussions with key stakeholders across the value chain. Market size and forecasts are developed using both bottom-up and top-down methods to ensure accuracy and consistency in the final results.

Data
Collection Project
Setup Market
Estimation Data
Structuring Quality
Check Output Forecasting Data
Validation Our Methodological
Approach Source: Polaris Market Research

1. Project Setup

Step 1 & 2:

  • We start every project by clearly understanding the client’s objective or goal, then defining the market scope, and aligning regions, segments, and timelines.
  • Once the foundation is set, we collect data from all-around of sources, including company reports, government databases, and paid industry platforms.
  • Our research is based on secondary data, which helps us build a strong understanding of the market across regions and industries. Then we validate this information through primary research by speaking directly with industry experts, companies, and stakeholders.
  • By combining secondary and primary research, we ensure that our market insights are accurate, practical, and closely aligned with real market conditions.

2. Data Collection

We gather information from both public and verified sources:

Secondary Research 50-100+ sources reviewed Company filings (10-K, annual reports) Government databases (trade, production, import/export) Paid databases (Bloomberg, Factiva, Statista) Coverage:
60-80% of total data inputs Primary Research 25-40 interviews conducted Manufacturers Distributors / channel partners Industry experts / consultants Coverage:
30-40% validation weight Source: Polaris Market Research

3. Data Structuring

Step 3:

  • All collected data is organized into a consistent format to ensure accurate analysis. Since inputs come from multiple sources, they are standardized and aligned before use.
  • The data is segmented by product, application, and region, and mapped across a defined historical period (2020–2024). All values are converted into common units (USD Mn/Bn), and volume and pricing are aligned where required to estimate revenue.
  • Any overlaps or inconsistencies are reviewed and adjusted to maintain accuracy (<5% variance threshold).
  • The result is a structured dataset that allows for clear comparison across regions and supports reliable analysis and forecasting.

Structured Market Dataset, USD Mn/Bn

Region Segment VolumeUnits Avg PriceUSD RevenueUSD Mn Share %
North America Product A 250 2.5 500 15%
Product AXXXXXXXX
Product AXXXXXXXX

4. Market Estimation

Step 4: TOP-DOWN APPROACH

  • We start with the overall market size at a global or macro level.
  • The market is then narrowed down based on scope and industry relevance.
  • We apply penetration rates and split the data by region and segment.
  • This helps us estimate the market size for specific segments.
  • The numbers are validated through cross-checks to ensure accuracy.
Top-down Approach Macro market base Value / Volume Parent market USD-based Volume-based Units X price Market scope alignment Penetration rate 5-50% Segment & regional split Geographic breakdown Estimated market size Market size reconciliation ±5-10% variance check Final market size USD Mn / Bn Market forecasting Source: Polaris Market Research

Step 5: BOTTOM-UP APPROACH

  • We begin by analyzing data from leading companies in the market.
  • Revenue data is collected and mapped across different segments.
  • The data is then aggregated to estimate the total market size.
  • To fill in any gaps, adjustments are made based on industry standards.
  • Validation checks make sure that the results are correct.
Bottom-up Approach Company-level data 20-25 comapnies Parent market Financials Segmental analysis Segment-level aggregation 60-80% coverage Gap adjustment Benchmarks Estimated market size Market size reconciliation ±5-10% variance check Final market size USD Mn / Bn Market forecasting Source: Polaris Market Research

5. Forecasting

Step 6:

At Polaris Market Research & Consulting, Inc., we employ a methodical forecasting strategy. This approach blends the analysis of historical data with real-time market validation. To forecast future trends with precision, we examine past patterns, pricing fluctuations, and the interplay of supply and demand. To ensure our conclusions reflect the present market landscape, we actively seek input from industry experts and key stakeholders.

To refine our predictions, we carefully consider critical elements such as market drivers and restraints, fluctuations in raw material costs, emerging technologies, and the production capabilities of various regions. Furthermore, we assess regulatory frameworks and potential policy shifts to gauge their potential impact on market expansion.

All this information is synthesized to generate precise forecasts for each segment and region. These forecasts illuminate the current state of the market and highlight forthcoming opportunities.

Data - Based Assessment Growth rates are derived from multi-year performance  Pricing movement is evaluated to align value projections  Volume and value relationships are assessed across segments Historical market data is analyzed to establish baseline trends  Market - Validated Assessment Supply-side insights are incorporated to account for production and capacity trends Forecast assumptions are aligned with current market conditions Industry inputs are used to validate growth assumptions Inputs from demand-side participants are considered to reflect consumption patterns  Source: Polaris Market Research

6. Validation & Triangulation

Step 7:

In the final stage, we validate all our estimates using a triangulation method, where data is cross-checked from multiple reliable sources, like company data, primary interviews, and secondary research. This helps us make sure that our numbers are correct and fit with the rest of the market.

This process involves verifying data consistency across various segments and geographic areas. It also requires comparing historical trends with the assumptions support the forecast. Any discrepancies involve adjustments to ensure everything remains aligned and dependable.

Once the data is finalized, we prepare the final outputs, including market size estimates, segment-wise breakdowns, and growth metrics. These are delivered in structured formats such as tables, charts, and data files for easy analysis and use.

We collaborate closely with clients, ensuring the final products align with their requirements. This includes offering tailored adjustments, supplementary data analyses, and continuous assistance. Furthermore, we monitor market trends post-delivery, providing updates and refinements to maintain the insights' relevance as time passes.

Validation

Triangulation Framework

Estimates are cross-verified across three sources:

Company-level data

• Primary inputs from industry participants

• Secondary benchmarks and published data

Variance maintained within +5-10%

Adjustments applied to align estimates

Segment values validated against overall market structure

Quality Check

Data Consistency & Integrity

Segment totals validated to 100%

Regional estimates aligned with global market size

Historical trends compared against forecast outputs

Assumptions reviewed for cross-segment and regional alignment

Output & Delivery

Final Outputs

Market size estimates (USD Mn/Bn)
Segment-wise distribution (%)
Growth metrics (CAGR %)

Deliverables

Structured tables and charts
Segment-level datasets
Excel-based data files for further analysis

Client Alignment & Support

  • Deliverables are aligned with defined client requirements and scope
  • Custom data cuts and segment splits are incorporated as required
  • Post-delivery queries are addressed through analyst interactions
  • Additional clarifications and data support are provided upon request

Client Continuity & Updates

  • Market developments are tracked post-delivery to capture changes in key trends
  • Updated data and revisions are provided based on new market inputs
  • Additional refinements and data cuts are shared as required
  • Continued analyst engagement supports evolving client requirements

Secure Your Competitive Edge With Our Expert-Driven Market Insights

Gain exclusive insights and strengthen your competitive position with our tailored research solutions. Connect with our research analysts and industry experts to elevate your decision-making.

Talk To Our Analyst
Download Sample