
Smart Factory Market Share, Size, Trends, Industry Analysis Report, 2022 - 2030
REPORT DETAILS
REPORT DETAILS
ABOUT THIS REPORT
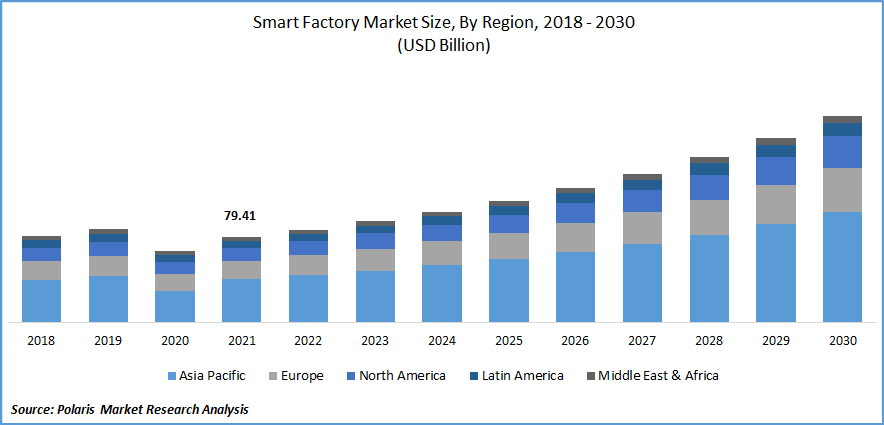
The smart factory market was valued at USD 79.41 billion in 2021 and is expected to grow at a CAGR of 10.46 % during the forecast period. Growing emphasis on energy efficiency, resource optimization, and cost reduction in production operations is the primary factor driving the smart factory market's growth. Additionally, increasing demand for industrial robots is also the reason propelling the market's growth.
Know more about this report: Download Sample Report
The smart factory is a metaphor for what manufacturing digitization aims to achieve. A fully digitalized factory floor, known as a "Smart Factory," uses networked devices, gadgets, and production systems to collect and share real-time data. Self-optimizing equipment or the entire organization might use the data to manage problems beforehand, improve manufacturing methods, and satisfy new requests.
Smart factories increasing benefits, such as improved data insights, faster issue resolution, maximized plant efficiency, better safety & quality control, seamless data exchange, on-time delivery, and continual product improvement, are supposed to influence the market's growth over the forecast timeline.
Smart factory owners can employ cellular technologies more securely and customize them for specific use cases with the help of 5G technology. Removing data from manufacturing networks without connecting to the machines is possible by installing sensors on 5G-enabled equipment, enabling seamless real-time optimization. For reliable and robust connections, several firms are implementing 5G networks.
Furthermore, wired connectivity is no longer required by installing a 5G network in factories, allowing for high-speed manufacturing with maximum flexibility and minimal downtime. Having a network that can support in terms of speed, coverage, and reliability becomes essential for industries. The development of the 5G network will offer factories a one-stop shop and open up considerable prospects for smart factories. For instance, in July 2021, Qualcomm started using its advanced 5G technology to enable smart manufacturing by accessing the potential of IoT.
The Covid-19 pandemic negatively impacted the smart factory market as lockdown orders were issued worldwide, which hindered production activities and made it harder to maintain industries. Also, there was a decline in growth due to a barrier to adopting smart manufacturing technology. Industry 4.0 adoption was severely hindered by the pandemic, which ultimately harmed smart industries. However, to avoid infection during a pandemic, the market has mixed impacts during the lockdown. It showed a positive impact from the demand side and quite a negative impact from the supply side.
Moreover, In the post-pandemic era, it is likely to gain large demand for services related to smart factories.
 Know more about this report: Download Sample Report
Industry Dynamics
Growth Drivers
Industrial robot usage has increased dramatically in the last ten years due to its advantages, including high production, consistency in speed and quality, improved workplace safety, and greater floor space utilization. For instance, according to the International Federation of Robotics (IFR), In 2021, 3 million industrial robots were operating in factories around the world.
Additionally, the new robots are simple to use and more energy-efficient than before in many industries. Navigation systems on mobile robots enable them to communicate with other robots and systems. Additionally, robots are making their way into new industries, including plastic, wood, and textiles. As a result, the market for smart factories is expanding due to the growing usage of robots in the manufacturing industry.
Moreover, technological trend such as augmented reality is supposed to boost the smart factory market. The perception and presentation of a real-time scenario are improved through augmented reality. A compatible device, such as a smartphone camera, HMI, or any smart eyewear, is used to make it by superimposing digital information on an image of something. These gadgets are typically voice-activated, enabling hands-free use by the user.
Additionally, engineers can produce a whole augmented reality (AR) experience demonstrating to manufacturing technicians how to maintain the machinery on the factory floor due to the convergence of machine learning and physics-based modeling. Augmented reality (AR) is being used by businesses to increase production activity and enhance production procedures on the factory floor. Augmented reality implementation into industrial processes has increased employee productivity and has driven the market’s growth.
Report Segmentation
The market is primarily segmented based on component, solution, industry, and region.
| By Component | By Solution | By Industry | By Region |
|
|
|
|
Know more about this report: Download Sample Report
Industrial sensors accounted the largest market share in 2021
Industrial sensors acquired the largest market share in 2021 due to their growing advantages, including improved sensitivity during data capture, almost lossless transmission, and continuous, real-time analysis. Level, temperature, flow, pressure, force, image, gas, and other sensors are commonly used by different industries.
Moreover, industrial 3D printing components are supposed to grow fastest over the forecast period due to increased adoption in sectors like automotive, aerospace & defense, food & beverage, and semiconductors & electronics. The creation of mold for different types of food, such as chocolates, hard candies, and cakes, is a significant application of 3D printing technology in the food and beverage industry. This encourages the growth of the industrial 3D printing market in the food and beverage sector.
PAM segment accounted for a significant market share in 2021
The PAM segment accounted for the most considerable market share in 2021 and is supposed to grow the fastest over the forecast period. PAM systems support timely information gathering and decision-making for manufacturing organizations to maximize competitiveness.
Production, organizational design, distribution, strategic, and commercial activities are all integrated to achieve this. It emphasizes risk mitigation while also assisting manufacturers in spotting issues early enough. So, the main factors boosting the segment's growth are decreased unplanned downtime, lower operational costs, best-possible asset utilization, and higher investment returns.
Process industry segment acquired the largest market share
During the forecast period, the process industry segment dominated the smart factory market, and the sub-segment oil & gas acquired the largest market revenue in 2021. Smart factory solutions have several advantages, including increased energy efficiency, improved product quality, and faster decision-making processes that produce more precise results for large-scale manufacturing in the oil and gas industries.
Many gases and oil corporations are setting up their drilling operations in far-flung offshore regions. The industry's emphasis on efficiency and safety drives the need for smart industrial solutions. The crucial tasks can be completed more easily with the IoT device used in smart industrial solutions in the oil and gas industry.
Additionally, adopting smart manufacturing technologies has improved employee safety in the oil and gas sector. The primary producers in the oil and gas sector are concentrating on digitalizing their facilities in order to increase process visibility, guarantee safety, boost production, boost efficiency, and lower operational costs. These factors are responsible for the segment's growth.
Asia-Pacific dominated the regional market
Asia-Pacific dominated the smart factory regional market as developing countries like China and India are pursuing complete automation in smart manufacturing due to the numerous untapped prospects in these markets. Additionally, these countries spend extensively on industry 4.0 to be autonomous in manufacturing and output.
Moreover, North America is supposed to grow fastest over the forecast timeline due to an increase in government support for the development of IoT technology and an increasing focus on improving manufacturing output in the emerging economy, including the US and Canada are the factors supposed to drive the market in this region.
Competitive Insight
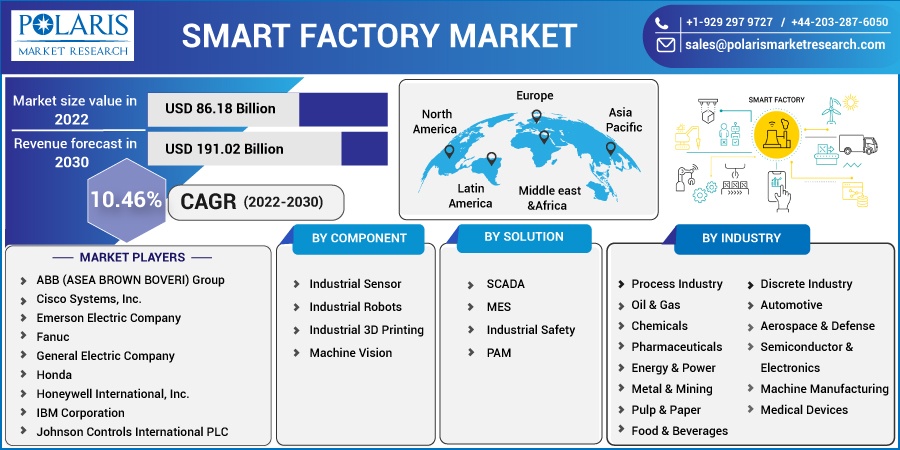
Some of the major players operating in the global market include ABB (ASEA BROWN BOVERI) Group, Cisco Systems, Inc., Emerson Electric Company, Fanuc, General Electric Company, Honda, Honeywell International, Inc., IBM Corporation, Johnson Controls International PLC, Mitsubishi Electric, Omron, Oracle Corporation, Robert Bosch GmbH, Rockwell Automation Inc., SAP SE, Schneider Electric SE, Siemens AG, Suzuki, Toyota, Wipro Limited, and Yokogawa Electric Corporation.
Recent developments
In March 2022, Emerson Electric Company launched MT Connect for Movicon.NExT 4.1.33 industrial control platform, which has potential to improve efficiency, reduce downtime and increase productivity.
In March 2021, ABB Group collaborated with ETH Zurich for advanced research into the future of robotics. Also, ABB has directed over CHF 2.5 million to support RobotX initiatives.
Smart Factory Market Report Scope
| Report Attributes | Details |
| Market size value in 2022 | USD 86.18 billion |
| Revenue forecast in 2030 | USD 191.02 billion |
| CAGR | 10.46 % from 2022 - 2030 |
| Base year | 2021 |
| Historical data | 2018 - 2020 |
| Forecast period | 2022 - 2030 |
| Quantitative units | Revenue in USD billion and CAGR from 2022 to 2030 |
| Segments Covered | By Component, By Solution, By Industry, By Region |
| Regional scope | North America, Europe, Asia Pacific, Latin America; Middle East & Africa |
| Key Companies | ABB (ASEA BROWN BOVERI) Group, Cisco Systems, Inc., Emerson Electric Company, Fanuc, General Electric Company, Honda, Honeywell International, Inc., IBM Corporation, Johnson Controls International PLC, Mitsubishi Electric, Omron, Oracle Corporation, Robert Bosch GmbH, Rockwell Automation Inc., SAP SE, Schneider Electric SE, Siemens AG, Suzuki, Toyota, Wipro Limited, and Yokogawa Electric Corporation |
Download Sample Report of Smart Factory Market Share, Size, Trends, Industry Analysis Report, 2022 - 2030
Please fill out the form to request a customized copy of the research report.
