
Visual Analytics Market Share, Development & Regional Presence, 2023-2032
REPORT DETAILS
REPORT DETAILS
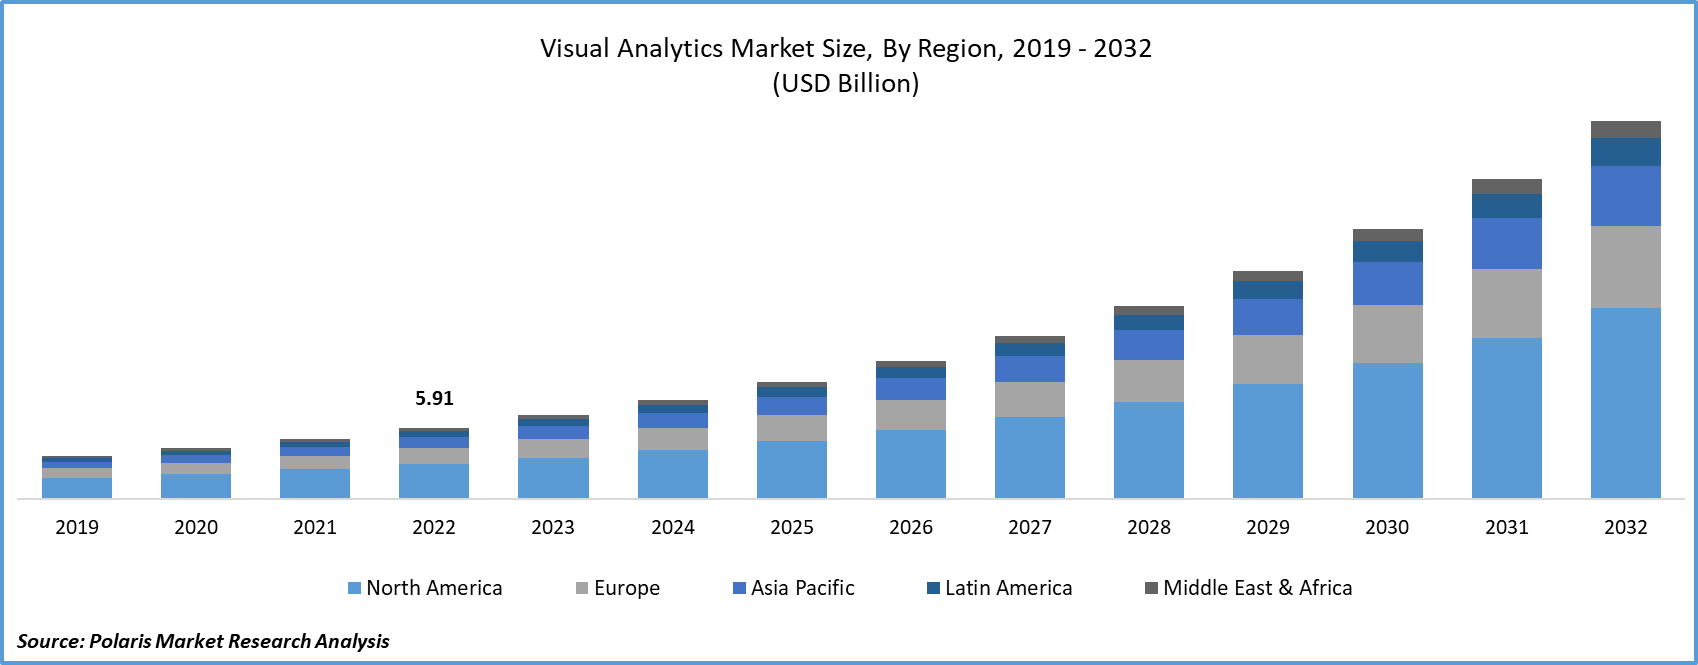
The global visual analytics market was valued at USD 5.91 billion in 2022 and is expected to grow at a CAGR of 18.2% during the forecast period.
Visual Analytics is a rapidly evolving sector within the broader field of data analytics. It involves the use of interactive, visual representations of data to help individuals and organizations gain insights, make data-driven decisions, and communicate complex information effectively. Visual Analytics combines data visualization techniques with advanced analytics and interactive interfaces, enabling users to explore and understand data more intuitively and insightfully.
Product innovations, technological advancements, and the introduction of regulatory policies have been detailed in the report to enable businesses to make more informed decisions. Furthermore, the impact of the COVID-19 pandemic on the visual analytics market demand has been examined in the study. The report is a must-read for anyone looking to develop effective strategies and stay ahead of the curve.
To Understand More About this Research: Download Sample Report
In today's data-rich world, businesses and organizations across various industries are generating and collecting vast amounts of data. This data can include customer information, sales data, operational metrics, and much more. Visual Analytics solutions provide a powerful means to unlock the value of this data by translating it into visual forms that are easier to comprehend and act upon.
With the proliferation of digital technology and the internet, organizations are collecting more data than ever before. There is a pressing need to make sense of this data, and visual analytics provides a way to do so efficiently.
Many data sets are complex and multidimensional. Visual representations help in simplifying complex data structures and relationships, making it easier for users to understand and make informed decisions. Businesses increasingly require real-time insights into their operations and customer behavior. Visual Analytics tools can provide dashboards and interactive reports that update in real time, enabling timely decision-making.
For Specific Research Requirements: Request for Customized Report
With rising data generation from various sources, such as social media and the IoT, enterprises are finding new ways to analyze complex data and make informed decisions based on the insights. Visual analytics makes it possible to understand data and interpret insights with the CEOs of the company. Furthermore, it enables clients to visualize trends, patterns, and outliers in their data. Nice Actimize detected complex financial crimes with advanced analytics integration in the ActOne Case Management Solution. It demonstrates the use of visual analytics by financial institutions. The application of visual analytics is growing more frequently with the rise of companies interested in making informed decisions based on their business data. It is creating new growth opportunities for the visual analytics market during the study period.
Industry Dynamics
Growth Drivers
Adoption of New Technology
Visual analytics companies are rigorously working on adopting new technologies to make visual platforms more convenient for users. VCC, a cloud software company, incorporated Looker Studio into its software to provide contact centers with visualization tools. It enables data-driven decision-making and enhances customer interaction. It implies a rising need for business intelligence tools like visual analytics. Visual analytics enhances business intelligence by facilitating interactive, visually appealing representations of data, empowering stakeholders to make informed choices. As more companies understand the benefits of data analytics in business operations, the demand for visual analytics tools will increase.
Also, the exponential growth of data generated by businesses, individuals, and IoT devices creates a pressing need for effective data analysis and visualization. Visual Analytics provides a means to make sense of this vast amount of data. Business Intelligence Adoption: Organizations are increasingly adopting business intelligence (BI) and analytics solutions to remain competitive. Visual Analytics is a critical component of BI tools, driving demand for its capabilities.
Report Segmentation
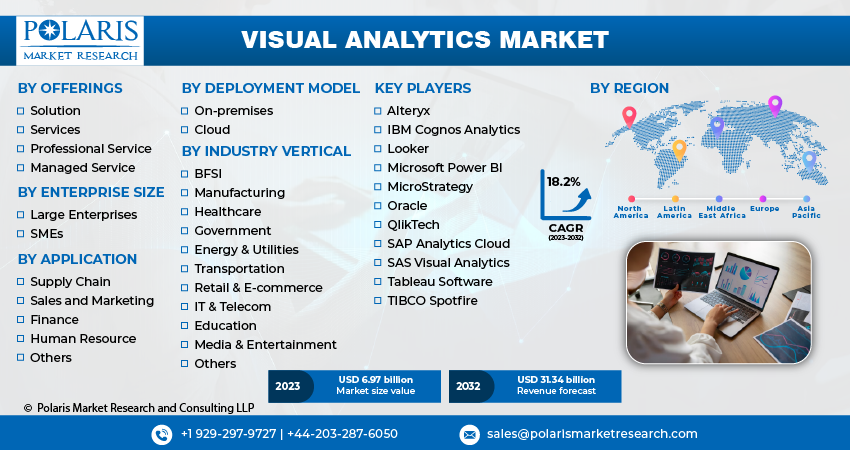
The market is primarily segmented based on offering, enterprise size, deployment model, application, industry vertical and region.
| By Offering | By Enterprise Size | By Deployment Model | By Application | By Industry Vertical | By Region |
|
|
|
|
|
|
To Understand the Scope of this Report: Request Customization
By Offering Analysis
Solution segment held the fastest market share in 2022
In 2022, the solution segment held the fastest market share. The solution provides tools and capabilities to analyze large amounts of data and extract visual analysis. Visual data analytics solutions provide pre-built features designed to help users transform raw data. These features assist users in building dashboards from large chunks of data, driving data-driven decisions in business operations. Direct users can use data visualization tools to extract insights from raw data rather than services, where, in the form of consulting, a solution is provided by experts after analysis of the organization’s data. Nowadays, organizations are showing interest in deriving insights from their data rather than professional services due to the confidentiality of the data. It is driving the growth of the solution segment in the visual analytics domain.
By Enterprise Size Analysis
Large Enterprises segment held the largest market share in 2022
In 2022, the large enterprises segment held the largest market share due to rising concerns over data-driven decision-making among businesses. Visual analytics companies encourage consumers to make data-driven decisions with user-friendly interfaces. The potential to analyze trends and patterns and identify outliers enables companies to mitigate risks in business operations, which is crucial to large enterprises. The growing trend towards data-driven decision-making among large enterprises is driving demand for the visual analytics market. Effective decision-making processes with insights derived from data enable companies to solve business problems.
By Deployment Model Analysis
The cloud segment is expected to witness significant revenue share during the forecast period.
The cloud segment is expected to witness significant revenue share during the forecast period. This segment enables scalability for business organizations, as it can handle various data volumes and user loads. It is driving businesses of all sizes to adopt cloud solutions. If there is an increase in data requirements, enterprises can expand their cloud resources without making huge investments in hardware equipment. This deployment mode offers users the ability to utilize cloud services from anywhere with a pleasant internet connection. It is meeting the ongoing trend of remote working by providing access to data and visual analytics features from anywhere in the world with a sufficient network. The convenience of this deployment model is driving the demand for visual analytics by businesses.
Regional Insights
North America dominated the largest revenue share during the forecast period.
North America dominated the largest revenue share during the forecast period. The growing emphasis on data-driven decision-making is driving the growth of the market in this region. According to the survey conducted by BARC (Business Application Research Centre) and Eckerson Group, 51% of the respondents saw a rise in BI/analytics usage among U.S. residents compared to 31% of Europeans. Additionally, respondents in the region are notably more inclined to have a significant portion of their employees (ranging from 51% to 75% of all employees) engage with embedded charts and tables, surpassing Europeans with a ratio of 23% to 15%. It represents a rising demand for embedded analytics, fueling the adoption of advanced visualization tools in the region.
APAC has registered the fastest growth rate in the global market. This region is witnessing the rapid application of visual analytics in the data analysis process. The sales and Marketing field is using data visualization tools effectively to make efficient marketing strategies based on consumer buying patterns. According to EY, 78% of marketers witnessed efficiency in marketing with the incorporation of data analytics in creating marketing strategies.
In 2022, 54% of marketers used consumer data, compared to 42% in 2021. This trend will showcase rising demand for data analysis and, in turn, visual analytics tools in the coming years. Personalization is the key trend driving product sales. Analyzing consumer history, buying patterns, and browsing history with visual tools represents consumer preferences. It helps the sales and marketing team in every organization make personalized marketing strategies for the customers, driving sales of the products. The wide application of visual analytics by the sales and marketing teams is driving the growth of the market in this region.
Key Market Players & Competitive Insights
The players offer a range of solutions and services designed to help organizations extract meaningful insights from their data through advanced visualizations. In the highly competitive Visual Analytics, staying innovative, responsive to user needs, and adaptable to emerging technologies are competitive for market players.
Some of the major players operating in the global market include:
- Alteryx
- IBM Cognos Analytics
- Looker
- Microsoft Power BI
- MicroStrategy
- Oracle
- QlikTech
- SAP Analytics Cloud
- SAS Visual Analytics
- Tableau Software
- TIBCO Spotfire
Recent Developments
- In June 2023, Qlik Sense, a modern analytics platform, introduced generative AI with Open AI connectors to its platform. This connector enables users to integrate the Large Language Model into their quick deployments.
- In May 2022, Tableau introduced its new software, Tableau Cloud, to equip users with advanced analytics and automated insights. It assists customers in making confident and faster data-driven decisions for better business outcomes.
Visual Analytics Market Report Scope
| Report Attributes | Details |
| Market size value in 2023 | USD 6.97 billion |
| Revenue forecast in 2032 | USD 31.34 billion |
| CAGR | 18.2% from 2023 - 2032 |
| Base year | 2022 |
| Historical data | 2019 - 2021 |
| Forecast period | 2023 - 2032 |
| Quantitative units | Revenue in USD billion and CAGR from 2023 to 2032 |
| Segments covered | By Offering, By Enterprise Size, By Deployment Model, By Application, By Industry Vertical, By Region |
| Regional scope | North America, Europe, Asia Pacific, Latin America, Middle East & Africa |
| Customization | Report customization as per your requirements with respect to countries, region and segmentation. |
We strive to offer our clients the finest in market research with the most reliable and accurate research findings. We use industry-standard methodologies to offer a comprehensive and authentic analysis of the visual analytics market. Besides, we have stringent data-quality checks in place to enable data-driven decision-making for you.
FAQ's
The visual analytics market reached USD 5.91 billion in 2022, projected to grow at 18.2% CAGR, reaching USD 31.34 billion by 2032, driven by data-driven decision-making adoption.
The solution segment holds the fastest market share in visual analytics, providing pre-built features that help users transform raw data and build dashboards for data-driven business decisions.
The cloud deployment segment witnesses significant revenue share, offering scalability, remote accessibility, convenient network access, and meeting remote working trends without major hardware investments for businesses.
North America dominates with largest revenue share during forecast period, driven by data-driven decision-making emphasis, with 51% U.S. respondents seeing rising BI/analytics usage versus 31% Europeans.
Large enterprises hold the largest segment share due to rising data-driven decision-making concerns, requiring visual analytics for trend analysis, pattern identification, outlier detection, and business risk mitigation.
The large enterprises segment held the largest market share in 2022, driven by growing demand for data-driven decision-making and the need to analyze trends, patterns, and outliers across complex business operations.
The cloud deployment model is expected to witness significant revenue share, owing to its scalability, remote accessibility, and ability to handle increasing data volumes without heavy upfront hardware investments.
Download Sample Report of visual analytics market
Please fill out the form to request a customized copy of the research report.
