
Avocado Market Share, Size, Trends, Industry Analysis Report, 2023 - 2032
REPORT DETAILS
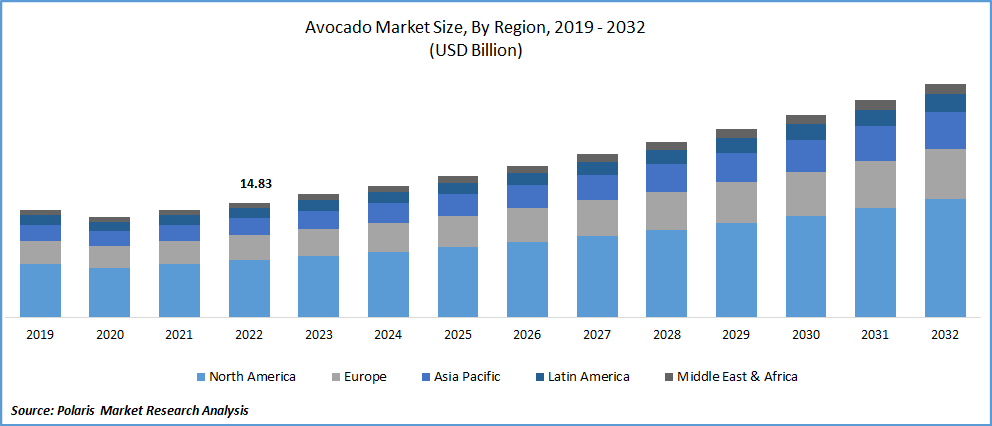
The global avocado market was valued at USD 14.83 billion in 2022 and is expected to grow at a CAGR of 7.4% during the forecast period.
The substantial change can always be attributed to increasing consumer health consciousness, an emphasis on living a healthy lifestyle that supports the consumption of nutrient-dense foods, increased use of avocados in various industrial applications, and an expanding sales channel for avocado distribution globally.
Source: Polaris Market Research Analysis
Know more about this report: Download Sample Report
A major factor in the market's growth is the increased demand for fruit worldwide due to its high nutritional content. Avocados are low in calories and offer many vitamins, minerals, and other nutrients. A medium-sized avocado has 50 calories and approximately 20 vitamins, minerals, and phytonutrients, including 81 micrograms of lutein and 19 micrograms of beta-carotene.
Furthermore, Avocado consumption is also rising due to the fruit’s advantages for health, which include bettering digestion, preventing heart disease, and enhancing vision. For instance, according to a Lorena S. Pacheco et., al research paper published in April 2022, higher avocado intake was related to a lower risk of CVD and coronary heart disease. Avocados could reduce the risk of CVD if certain foods containing fat were substituted for them.
The production has expanded due to the worldwide increase in demand. For instance, according to the World Population Review 2022 study, Mexico is the largest producer of avocados, followed by the Dominican Republic. Avocado production in the Dominican Republic reached 640,000 tons in 2018.
From a different but advantageous angle, avocado is becoming more and more well-liked in the pharmaceutical and cosmetics sectors. Drug companies and developers of therapeutic products believe that due to their medical benefits, it may be a crucial component in their products. Research is currently being done to produce goods using avocado concentrates and ingredients. This product is very well-liked in the global avocado industry.
COVID-19 has impacted the avocado market primarily due to the closure of the hospitality sector, which includes hotels, restaurants, and cafes. However, consumers' awareness and focus on healthy eating increased due to their decision to stay at home because of various government directives and lockdown scenarios.
Source: Polaris Market Research Analysis
Know more about this report: Download Sample Report
Industry Dynamics
Growth Drivers
Avocado demand is increasing due to seasonal demand and increased awareness of its health benefits. The global avocado market has grown due to its marketing as a healthy dietary option and a good source of healthful monounsaturated oil. The FDA recommends a daily saturated fat intake of around 15% of a medium avocado. Additionally, avocados have 60% more potassium than bananas. They also include high folate, vitamin K, E, and B vitamins. Avocados are advantageous to a diabetic diet as well. Avocados can be a nutritious option for people following a diabetic diet, as diabetes is rising in the United States.
The increasing food retail sector and the rising number of avocado-based product releases, such as sauces, by fast food retailing giants, have increased the demand for avocado use in continental meals and other foods by restaurant chains.
Report Segmentation
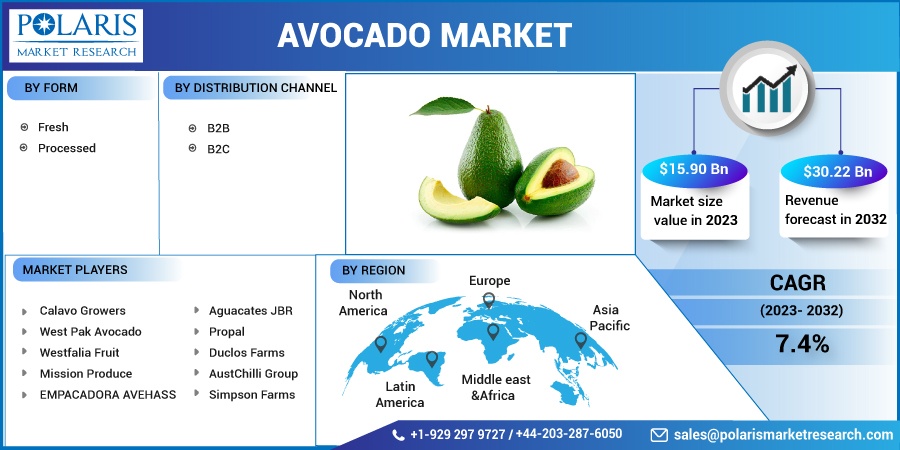
The market is primarily segmented based on form, distribution channel, and region.
| By Form | By Distribution Channel | By Region |
|
|
|
Source: Polaris Market Research Analysis
Know more about this report: Download Sample Report
The Fresh Form Segment is Predicted to Dominate the Industry’s Market Segment
The fresh form had the highest revenue share. Due to the rise in demand for raw fruit, multinational corporations are incorporating new technologies into their production procedures. The popularity of fresh meals and the ease of product accessibility can be linked to consumers' preference for fresh avocados.
Furthermore, the fresh market is developing new technologies due to avocados being favorable to the growth of bacteria because of their high lipid and moisture content, low carbohydrate content, and non-acidic pH level. Also, due to inadequate packaging and consumer ignorance, fresh avocados have not been effectively protected from physical injury.
For instance, according to a research paper from A I D Larasati et al. published in 2021, the features that customers want from products include fruit size, fullness of the information, perforation, design, shape, and packaging material. While the technical replies to be developed were homogenous fruit size, beautiful package design, packaging with avocado shapes, product detail, and eco-friendly packaging from physical harm.
Although processed avocados are becoming increasingly trendy. The expansion of this market is mainly driven by increased disposable income levels and shifting lifestyles. Consumers do not have to worry about wastage or unusable fruit with processed products.
B2B Segment will Account for a Higher Share of the Market
People are choosing more nutritional meals, including sandwiches, salads, and healthy chips like avocado chips, at cafés and restaurants due to greater health awareness, especially among the young generation.
Additionally, the opportunity has been seized by B2B marketplaces, which now provide premium services at competitive prices, with dependable delivery schedules and with essential standard credit standards. Furtherly, a few restaurants are profiting from the work-from-café trend. The number of professionals choosing to work in cafes and restaurants is increasing. Because they spend most of their time in the café, they would also place numerous food orders throughout the day.
The B2C market's dominance in 2022 was mostly due to the rising consumer demand for fresh avocados through multiple channels. As customer demand shifts from physical to online channels, direct-to-consumer e-commerce is crucial for B2C. It minimizes operational costs, increases the likelihood of attracting new customers, and enhances interaction with current ones. As a result of shifting dietary preferences, consumers are more willing to pay for a range of high-quality products that are practical, secure, and of a high caliber.
The Demand in North America is Expected to Witness Significant Growth
The key element driving regional growth and expansion was the high demand for goods in the United States and Canada. The increasing spending power of consumers in this area is another element promoting industrial development. The market is predicted to show profitable progress soon because the area offers enticing opportunities for the consumer products industry.
Furthermore, the United States of America is expected to remain the top manufacturer. According to the Food source information 2021 report, Over 5,000 growers in California produce about 90% of the avocados consumed in the United States. Approximately 13 acres are typically devoted to groves in California. Each avocado tree can produce between 200 and 500 avocados every year. Every year, California alone harvests almost 400 million pounds of avocados. The majority of the remaining 10% of American avocado production is grown in Florida.
The US has yearly variations in avocado production because of the weather. Avocados come in several varieties, with Hass being the most popular in the US. Some varieties of avocados are also grown in the winter. The consumption of avocados is expected to climb dramatically as the US population expands.
Competitive Insight
Some major global players operating in the global market include
- Calavo Growers
- West Pak Avocado
- Westfalia Fruit
- Mission Produce
- EMPACADORA AVEHASS
- Aguacates JBR
- Propal
- Duclos Farms
- AustChilli Group
- Simpson Farms.
Recent Developments
- In January 2025, Sainsbury’s began trialing avocado twin packs in 77 stores using kerbside-recyclable paper packaging with bamboo netting, aiming to reduce plastic waste and promote sustainable packaging solutions.
- In October 2022, Apeel revealed plans to deliver creative new technologies that would allow stakeholders at all stages of the fresh produce supply chain to determine the freshness of avocados instantaneously & non-destructively. Apeel has combined advanced imaging technology and machine learning to increase visibility into internal quality & ripe-ness. This has allowed producers & grocery retailers to make better sorting, & merchandising decisions, potentially reducing food waste and enhancing consumer access to consistently ripe and reliable avocados.
- On November 2022, Fruit France announced that its new plant would be operating by the end of the year. The cutting-edge facility will have avocado storage, ripening rooms, and packing capabilities to support Westfalia's pan-European operations. It is located in Graveson, in the Provence region of southern France.
Avocado Market Report Scope
| Report Attributes | Details |
| Market size value in 2023 | USD 15.90 billion |
| Revenue forecast in 2032 | USD 30.22 billion |
| CAGR | 7.4% from 2023 – 2032 |
| Base year | 2022 |
| Historical data | 2019 – 2021 |
| Forecast period | 2023 - 2032 |
| Quantitative units | Revenue in USD billion and CAGR from 2022 to 2030 |
| Segments Covered | By Form, By Distribution Channel, By Region |
| Regional scope | North America, Europe, Asia Pacific, Latin America, Middle East & Africa |
| Key Companies | Calavo Growers, West Pak Avocado, Westfalia Fruit, Mission Produce, EMPACADORA AVEHASS, Aguacates JBR, Propal, Duclos Farms, AustChilli Group, and Simpson Farms |
Source: Polaris Market Research Analysis
Avocado Market FAQ's
Key companies in the avocado market are Calavo Growers, West Pak Avocado, Westfalia Fruit, Mission Produce, EMPACADORA AVEHASS.
The global avocado market expected to grow at a CAGR of 7.4% during the forecast period.
The avocado market report covering key segments are form, distribution channel, and region.
Key driving factors in avocado market are increasing awareness of its health benefits.
The global avocado market size is expected to reach USD 30.22 billion by 2032.
Download Sample Report of Avocado Market
Please fill out the form to request a customized copy of the research report.
