
Dental Suction Systems Market Share, Size, Trends, Industry Analysis Report, 2022 - 2030
REPORT DETAILS
REPORT DETAILS
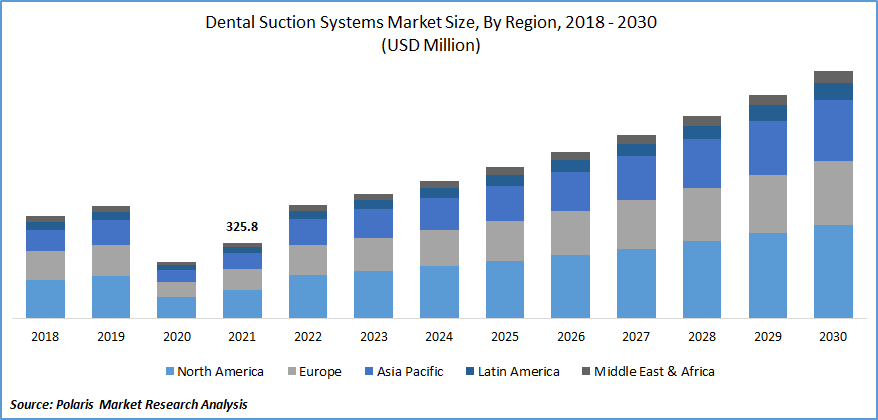
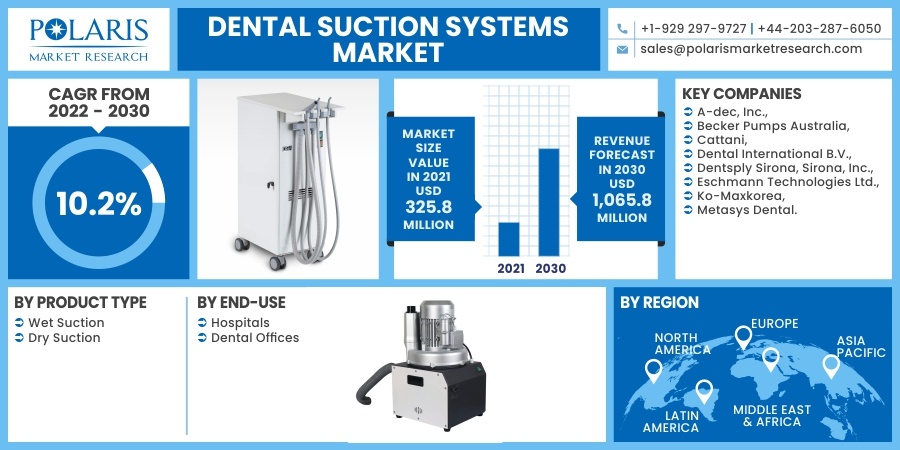
The global dental suction systems market was valued at USD 325.8 million in 2021 and is expected to grow at a CAGR of 10.2% during the forecast period. The constant product development is coupled with the growing awareness for dental problems, and the rise in cases of these problems is fueling the market growth across the globe.
 Know more about this report: Download Sample Report
Besides, increasing sedentary lifestyles and the emergence of next-generation technologies in the field of suction systems are projected to create new growth avenues for the dental suction systems market around the world. The arrival of the COVID-19 has drastically influenced every industry and affects the global economy's state. It leads to postponing non-emergency checkups because of the spreading of contracting the novel coronavirus infection which in turn has hampered the suction systems industry.
In addition, the government issued guidelines during that pandemic, which allows public endodontist practices and hospitals to treat merely at the urgent situation, a large number of private practices were bunged, particularly those dentists who carry out mainly non-emergency services. Therefore, the outbreak of the COVID-19 pandemic brings a significant downfall in the global dental suction systems market.
Know more about this report: Download Sample Report
Industry Dynamics
Growth Drivers
The growing demand for cosmetic dentistry has gained a huge acceptance over the last years, which may positively impact the global economy. Cosmetic dentistry focuses on enhancing the appearance and meets the demand of its end-users. In the present scenario, the overall focus is on appearance has led to the popularity of smile makeovers that propels the demand for cosmetic dentistry. In addition, rising consumer responsiveness is creating a major opportunity that augments the demand for cosmetic dentistry through social media platforms, improved media coverage of endodontist practices, and its promotion.
Besides, cosmetic dentistry is not only used by the female population but also a large population base of males using cosmetic dentistry. Thereby, the primary impelling factors of the cosmetic dentistry market are changes in lifestyle and the rising disposable income of individuals. Moreover, the youthful populations of business executives who want to look their best for better professions and substantial advancements in the industry itself have led to the growth of cosmetic dentistry. Hence, these factors may positively influence suction system market growth around the world.
Report Segmentation
The market is primarily segmented on the basis of product type, end-use, and region.
| By Product Type | By End-use | By Region |
|
|
|
Know more about this report: Download Sample Report
Insight by Product Type
The wet suction systems are expected to capture a major revenue share in 2021. These units are extremely reliable than dry systems because of their attribute of easier maintenance. The wet suction systems further featured a reverse flow valve and incorporation of central amalgam separation. These features make it a modern system and contribute towards its vast demands, which, in turn, reflect the dental suction systems market growth at a global scale.
The dry product segment is anticipated to register a significant CAGR from 2022 to 2029, owing to the benefits related to these systems. These systems are energy-efficient and have features, such as variable speed motor functionality that improves extraction power consistency. Moreover, these systems do not need a water connection for operation and can provisionally reconnect to the shop vacuum in case of a primary motor breakdown. These features are further expected to strengthen its demand, which, in turn, will become a key factor to augment the segment growth globally.
Insight by End-Use
The dental office segment is leading with the highest shares in the global market in 2021. This can be attributed to the rise in the number of treatment procedures associated with dental diseases across these healthcare settings. Due to the widespread of novel COVID-19 diseases, many people were frequently prevented from visiting hospitals and offices. Further, various clinics and associated facilities remain shut down during the pandemic.
According to the Agency for Healthcare Research and Quality, about 198,000 offices were closed in August 2020, intending to prevent the spread of diseases. Further, as the situation appears to be normal, endodontist offices have started and undertaken initiatives, such as implementing safety measures to provide improved safety to staff and patients alike.
Therefore, the use of extra-oral suction systems was begun to use for the protection of staff and patient by offices, particularly to prevent the spread of the virus. These factors are projected to accelerate the segment growth. The office segment is also projected to register the fastest CAGR, backed by the escalating demand for diagnosis & treatments. The presence of a large number of endodontist specialists across healthcare settings is expected to drive the segment growth.
Geographic Overview
Europe and North America are the two key regional markets for suction systems. This is due to the growing awareness of dental issues in Europe, followed by North America. In addition, the easy availability of quality medical facilities, early adoption of advanced treatment options, and the rise in government efforts into endodontist healthcare infrastructure. Therefore, these factors may fuel the market demand across North America in the forthcoming years.
Presently, the Asia Pacific, Middle East & Africa, and Latin America are becoming lucrative investments in healthcare settings. Factors such as the rising geriatric population coupled with rising diseases are likely to boost the market in the region. Growing health care infrastructure and increasing patient awareness levels regarding substitute treatment options are becoming the significant factors that are likely to support the market in the Asia Pacific.
Competitive Insight
Some of the major players operating the global market include A-dec, Inc., ADS Dental System, Inc., Becker Pumps Australia, Cattani, Dental International B.V., DentalEZ, Inc., Dentsply Sirona, Sirona, Inc., Eschmann Technologies Ltd., Ko-Maxkorea, and Metasys Dental.
Dental Suction Systems Market Report Scope
| Report Attributes | Details |
| Market size value in 2021 | USD 325.8 million |
| Revenue forecast in 2030 | USD 1,065.8 million |
| CAGR | 10.2% from 2022 - 2030 |
| Base year | 2021 |
| Historical data | 2018 - 2020 |
| Forecast period | 2022 - 2030 |
| Quantitative units | Revenue in USD million/billion and CAGR from 2022 to 2030 |
| Segments covered | By Product Type, By End-Use, By Region |
| Regional scope | North America, Europe, Asia Pacific, Latin America, Middle East & Africa |
| Key Companies | A-dec, Inc., Becker Pumps Australia, Cattani, Dental International B.V., Dentsply Sirona, Sirona, Inc., Eschmann Technologies Ltd., Ko-Maxkorea, and Metasys Dental. |
Research Methodology
A robust system of research, verification, and forecasting designed to ensure reliable and actionable market insights.
Polaris Market Research & Consulting, Inc. uses a clear and structured approach to deliver insights that clients can rely on. The process combines detailed primary and secondary research, including direct communication with industry experts. The detailed information helps build a complete picture of market trends and developments. Secondary data is gathered from credible sources such as industry reports, company filings, government source links, and trusted organization databases. It is then cross-checked through discussions with key stakeholders across the value chain. Market size and forecasts are developed using both bottom-up and top-down methods to ensure accuracy and consistency in the final results.
1. Project Setup
Step 1 & 2:
- We start every project by clearly understanding the client’s objective or goal, then defining the market scope, and aligning regions, segments, and timelines.
- Once the foundation is set, we collect data from all-around of sources, including company reports, government databases, and paid industry platforms.
- Our research is based on secondary data, which helps us build a strong understanding of the market across regions and industries. Then we validate this information through primary research by speaking directly with industry experts, companies, and stakeholders.
- By combining secondary and primary research, we ensure that our market insights are accurate, practical, and closely aligned with real market conditions.
2. Data Collection
We gather information from both public and verified sources:
3. Data Structuring
Step 3:
- All collected data is organized into a consistent format to ensure accurate analysis. Since inputs come from multiple sources, they are standardized and aligned before use.
- The data is segmented by product, application, and region, and mapped across a defined historical period (2020–2024). All values are converted into common units (USD Mn/Bn), and volume and pricing are aligned where required to estimate revenue.
- Any overlaps or inconsistencies are reviewed and adjusted to maintain accuracy (<5% variance threshold).
- The result is a structured dataset that allows for clear comparison across regions and supports reliable analysis and forecasting.
Structured Market Dataset, USD Mn/Bn
| Region | Segment | VolumeUnits | Avg PriceUSD | RevenueUSD Mn | Share % |
|---|---|---|---|---|---|
| North America | Product A | 250 | 2.5 | 500 | 15% |
| Product A | XX | XX | XX | XX | |
| Product A | XX | XX | XX | XX | |
| Consistent methodology applied across regions | |||||
4. Market Estimation
Step 4: TOP-DOWN APPROACH
- We start with the overall market size at a global or macro level.
- The market is then narrowed down based on scope and industry relevance.
- We apply penetration rates and split the data by region and segment.
- This helps us estimate the market size for specific segments.
- The numbers are validated through cross-checks to ensure accuracy.
Step 5: BOTTOM-UP APPROACH
- We begin by analyzing data from leading companies in the market.
- Revenue data is collected and mapped across different segments.
- The data is then aggregated to estimate the total market size.
- To fill in any gaps, adjustments are made based on industry standards.
- Validation checks make sure that the results are correct.
5. Forecasting
Step 6:
At Polaris Market Research & Consulting, Inc., we employ a methodical forecasting strategy. This approach blends the analysis of historical data with real-time market validation. To forecast future trends with precision, we examine past patterns, pricing fluctuations, and the interplay of supply and demand. To ensure our conclusions reflect the present market landscape, we actively seek input from industry experts and key stakeholders.
To refine our predictions, we carefully consider critical elements such as market drivers and restraints, fluctuations in raw material costs, emerging technologies, and the production capabilities of various regions. Furthermore, we assess regulatory frameworks and potential policy shifts to gauge their potential impact on market expansion.
All this information is synthesized to generate precise forecasts for each segment and region. These forecasts illuminate the current state of the market and highlight forthcoming opportunities.
6. Validation & Triangulation
Step 7:
In the final stage, we validate all our estimates using a triangulation method, where data is cross-checked from multiple reliable sources, like company data, primary interviews, and secondary research. This helps us make sure that our numbers are correct and fit with the rest of the market.
This process involves verifying data consistency across various segments and geographic areas. It also requires comparing historical trends with the assumptions support the forecast. Any discrepancies involve adjustments to ensure everything remains aligned and dependable.
Once the data is finalized, we prepare the final outputs, including market size estimates, segment-wise breakdowns, and growth metrics. These are delivered in structured formats such as tables, charts, and data files for easy analysis and use.
We collaborate closely with clients, ensuring the final products align with their requirements. This includes offering tailored adjustments, supplementary data analyses, and continuous assistance. Furthermore, we monitor market trends post-delivery, providing updates and refinements to maintain the insights' relevance as time passes.
Triangulation Framework
Estimates are cross-verified across three sources:
Company-level data
• Primary inputs from industry participants
• Secondary benchmarks and published data
Variance maintained within +5-10%
Adjustments applied to align estimates
Segment values validated against overall market structure
Data Consistency & Integrity
Segment totals validated to 100%
Regional estimates aligned with global market size
Historical trends compared against forecast outputs
Assumptions reviewed for cross-segment and regional alignment
Final Outputs
Deliverables
Client Alignment & Support
- Deliverables are aligned with defined client requirements and scope
- Custom data cuts and segment splits are incorporated as required
- Post-delivery queries are addressed through analyst interactions
- Additional clarifications and data support are provided upon request
Client Continuity & Updates
- Market developments are tracked post-delivery to capture changes in key trends
- Updated data and revisions are provided based on new market inputs
- Additional refinements and data cuts are shared as required
- Continued analyst engagement supports evolving client requirements
Download Sample Report of Dental Suction Systems Market Share, Size, Trends, Industry Analysis Report, 2022 - 2030
Please fill out the form to request a customized copy of the research report.
