
Europe Transcritical CO2 Market Industry Trends, Report 2024-2032
REPORT DETAILS
REPORT DETAILS
ABOUT THIS REPORT
Market Statistics
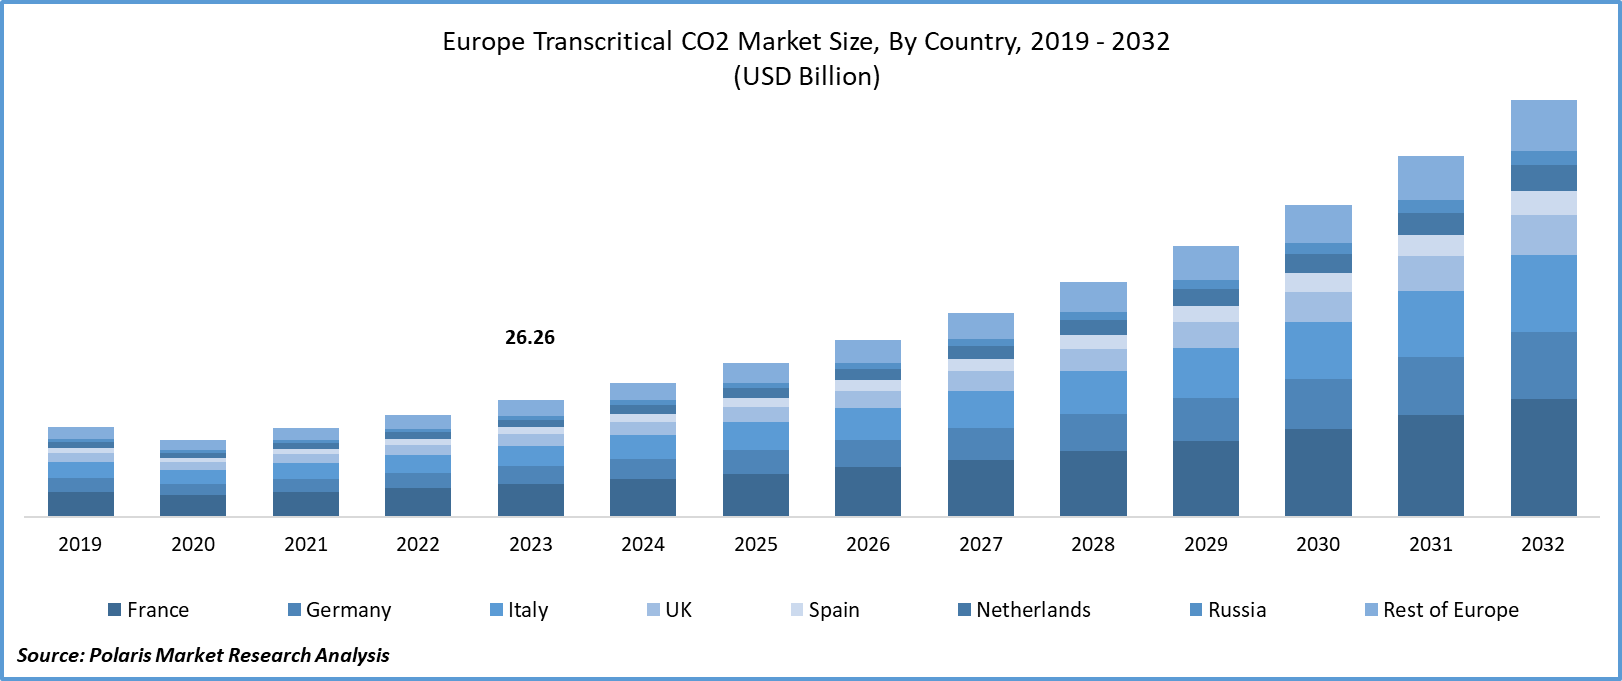
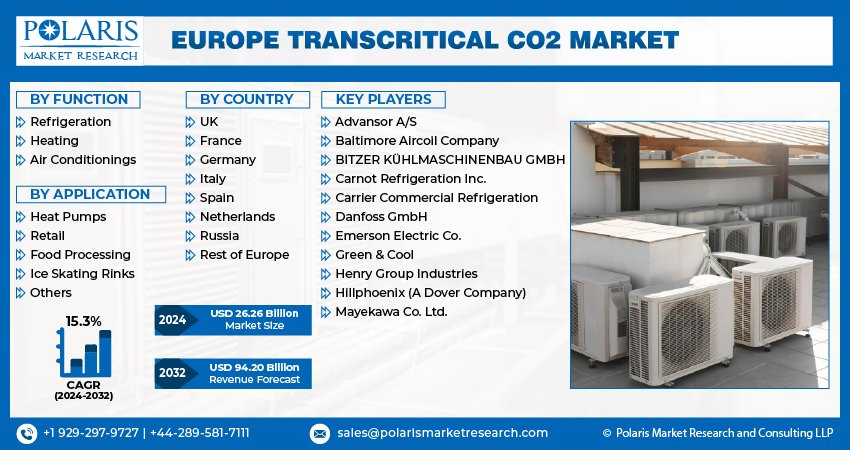
The europe transcritical CO2 market size was valued at USD 26.26 billion in 2023. The market is anticipated to grow from USD 30.17 billion in 2024 to USD 94.20 billion by 2032, exhibiting the CAGR of 15.3% during the forecast period.
Industry Trends
The European transcritical CO2 market is a dominating industry driven by increasing demand for natural refrigerants and energy-efficient solutions in the refrigeration sector. The market is primarily driven by the need to reduce greenhouse gas emissions and comply with environmental regulations, such as the EU's F-Gas Regulation 2014, which aims to phase down hydrofluorocarbons (HFCs) due to their high global warming potential. Transcritical CO2 systems offer an attractive alternative to HFCs, as they have a negligible impact on the ozone layer and climate change. Also, the market is driven by the increasing adoption of natural refrigerants in supermarket chains and other large commercial refrigeration applications.
- According to a recent survey by ATMOsphere, the publisher of R744.com, as of September 2022, Europe has adopted transcritical CO2 systems in 55,000 stores. Out of these, 50,000 stores are equipped with centralized systems (racks), while 5,000 stores use condensing units.
To Understand More About this Research: Download Sample Report
Many retailers are opting for transcritical CO2 systems due to their energy efficiency, cost-effectiveness, and lower environmental impact compared to traditional HFC systems. Additionally, some countries in Europe offer financial incentives and subsidies for businesses that adopt environmentally friendly technologies like transcritical CO2, further boosting demand for these systems.
However, there is a need for more trained personnel and technical expertise in installing and maintaining transcritical CO2 systems, particularly in smaller countries or regions where the technology is still relatively new, which is greatly affecting the growth and adoption of transcritical CO2 systems. This has led to higher installation costs and longer payback periods for end-users, making it more difficult for them to justify investments in transcritical CO2 systems.
Key Takeaways
- France dominated the market and contributed over 26% of the share in 2023
- By function category, the refrigeration segment accounted for the largest market share in 2023
- By application category, the retail segment held the dominating market share in 2023
What are the market drivers driving the demand for Europe transcritical CO2 market?
The growing awareness and adoption of transcritical CO2 refrigeration systems drive market growth.
Transcritical CO2 systems offer several advantages over traditional HFCs, including lower global warming potential (GWP) and higher energy efficiency. As concerns about climate change and environmental sustainability continue to grow, more businesses and organizations are looking for ways to reduce their carbon footprint and adopt environmentally friendly technologies. Additionally, the European Union's F-gas regulations, which aim to phase down HFCs, have created a demand for alternative refrigerants like CO2. This has led to an increase in the adoption of transcritical CO2 systems in various applications, such as supermarkets, convenience stores, and industrial refrigeration.
Furthermore, the development of new component technologies and system designs that improve the efficiency and cost-effectiveness of transcritical CO2 systems have made them more accessible to end-users. All these factors combined are contributing to the continued growth of the market.
Which factor is restraining the demand for transcritical CO2?
The need for more trained personnel and technical expertise in installing and maintaining transcritical CO2 systems hinders market growth.
The need for more skilled labor and technical know-how in installing and maintaining transcritical CO2 systems is a significant challenge for the widespread adoption of this technology in the European market. As these systems are relatively new, there is a need for more professionals with hands-on experience in their installation, maintenance, and repair. This absence need of more competent technicians makes it difficult for companies to find qualified personnel to work on these complex systems, leading to increased costs and longer installation times.
Moreover, the absence of standardized training programs and certifications for transcritical CO2 system installers and technicians further exacerbates the issue. Consequently, many businesses are hesitant to invest in such systems due to the perceived risks associated with their proper operation and maintenance. This limited availability of trained personnel and technical expertise acts as a restraining factor for the growth of the European transcritical CO2 market.
Report Segmentation
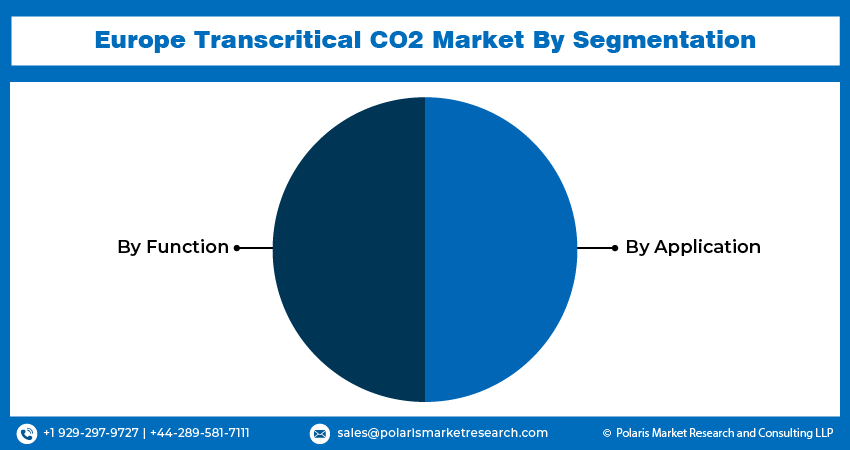
The market is primarily segmented based on function, application, and country.
| By Function | By Application | By Country |
|
|
|
To Understand the Scope of this Report: Request Customization
Category Wise Insights
By Function Insights
Based on function analysis, the market is segmented on the basis of refrigeration, heating, and air conditionings. The refrigeration segment accounted for the largest revenue share in the European transcritical CO2 market in 2023, owing to its extensive use of CO2 as a refrigerant in various applications such as supermarkets, convenience stores, and industrial refrigeration systems. Transcritical CO2 systems are gaining popularity in the region due to their high energy efficiency, environmental benefits, and cost-effectiveness compared to traditional HFCs.
In addition, the growing number of hypermarkets and supermarkets in countries like Germany, France, and the UK has created a significant need for advanced and efficient refrigeration systems, which has contributed to the dominant share of the refrigeration segment in the market.
By Application Insights
Based on application analysis, the market has been segmented on the basis of heat pumps, retail, food processing, ice skating rinks, and others. The retail sector's dominance in the market in 2023 is attributed to several factors, such as the increasing demand for natural refrigerants and the phasing down of hydrofluorocarbons (HFCs) due to environmental concerns that have led to a growing interest in CO2-based systems among retailers. Additionally, the high energy efficiency and cost-effectiveness of transcritical CO2 systems compared to traditional HFC systems have made them an attractive option for retailers looking to reduce their carbon footprint and operating costs.
Furthermore, the development of new component technologies, such as ejectors and parallel compressors, has improved the performance of transcritical CO2 systems in warmer climates, making them more viable for use in European countries with varying temperature conditions. As a result, the retail segment accounted for the largest share of the market in 2023.
Country-wise Insights
France
France held the dominant revenue share in the European market because the country is at the forefront of adopting environmentally friendly technologies and has set ambitious targets to reduce its carbon footprint. The country has implemented various policies and regulations that encourage the use of natural refrigerants like CO2, which have lower global warming potential compared to traditional HFCs.
Also, France has a large number of supermarkets and hypermarkets, which are among the biggest end-users of transcritical CO2 systems. The country's strong economy and high purchasing power also make it an attractive market for manufacturers of transcritical CO2 systems. Furthermore, France has a well-established supply chain and infrastructure, which enables easy access to raw materials and components, thereby reducing costs and increasing efficiency.
Competitive Landscape
The European transcritical CO2 market has seen significant growth in recent years, driven by increasing demand for natural refrigerants and energy-efficient solutions. Leading manufacturers such as Carrier, Danfoss, and Daikin have been at the forefront of this trend, investing heavily in research and development to improve the efficiency and performance of their systems. Furthermore, these manufacturers are also working closely with regulatory bodies and industry associations to promote the adoption of transcritical CO2 technology and contribute to the development of standards and regulations that support its use. Through their efforts, these leading manufacturers are helping to drive the transition towards more sustainable and efficient cooling solutions in Europe.
Some of the major players operating in the European market include:
- Advansor A/S
- Baltimore Aircoil Company
- BITZER KÜHLMASCHINENBAU GMBH
- Carnot Refrigeration Inc.
- Carrier Commercial Refrigeration
- Danfoss GmbH
- Emerson Electric Co.
- Green & Cool
- Henry Group Industries
- Hillphoenix (A Dover Company)
- Mayekawa Co. Ltd.
Recent Developments
In 2025, Air Liquide announced plans to expand its carbon capture capacity at its hydrogen production facility in Rotterdam, with the site expected to capture up to 800,000 tons of CO₂ per year under the Porthos CCS project in the Netherlands.
Also In 2025, Linde entered into a long-term agreement with OCI Global to supply clean hydrogen and implement CO₂ capture at OCI’s blue ammonia facility in the Netherlands, with the captured carbon set to be transported through the Dutch CCS network for offshore storage.
In June 2023, Dorin, an Italian compressor manufacturer, launched their new range of industrial transcritical CO2 compressors. The new compressors are part of Dorin's CD600 range, featuring six cylinders and covering up to 160hp and 100m3/h (3,531.5ft3/h).
Report Coverage
The Europe Transcritical CO2 market report emphasizes on key countries across the region to provide better understanding of the product to the users. Also, the report provides market insights into recent developments, trends and analyzes the technologies that are gaining traction around the globe. Furthermore, the report covers in-depth qualitative analysis pertaining to various paradigm shifts associated with the transformation of these solutions.
The report provides detailed analysis of the market while focusing on various key aspects such as competitive analysis, function, application, and their futuristic growth opportunities.
Transcritical CO2 Market Report Scope
| Report Attributes | Details |
| Market size value in 2023 | USD 26.26 billion |
| Revenue forecast in 2032 | USD 94.20 billion |
| CAGR | 15.3% from 2024 – 2032 |
| Base year | 2023 |
| Historical data | 2019 – 2022 |
| Forecast period | 2024 – 2032 |
| Quantitative units | Revenue in USD billion and CAGR from 2024 to 2032 |
| Segments covered | By Function, By Application, By Country |
| Regional scope | UK, France, Germany, Italy, Spain, Netherlands, Russia, Rest of Europe |
| Customization | Report customization as per your requirements with respect to countries, region and segmentation. |
FAQ's
The Europe transcritical CO2 market size is expected to reach USD 94.20 Billion by 2032
Key players in the market are Advansor A/S, Baltimore Aircoil Company, BITZER KÜHLMASCHINENBAU GMBH, Carnot Refrigeration Inc
Europe Transcritical CO2 Market exhibiting the CAGR of 15.3% during the forecast period.
The Europe Transcritical CO2 Market report covering key segments are function, application, and country.
Research Methodology
A robust system of research, verification, and forecasting designed to ensure reliable and actionable market insights.
Polaris Market Research & Consulting, Inc. uses a clear and structured approach to deliver insights that clients can rely on. The process combines detailed primary and secondary research, including direct communication with industry experts. The detailed information helps build a complete picture of market trends and developments. Secondary data is gathered from credible sources such as industry reports, company filings, government source links, and trusted organization databases. It is then cross-checked through discussions with key stakeholders across the value chain. Market size and forecasts are developed using both bottom-up and top-down methods to ensure accuracy and consistency in the final results.
1. Project Setup
Step 1 & 2:
- We start every project by clearly understanding the client’s objective or goal, then defining the market scope, and aligning regions, segments, and timelines.
- Once the foundation is set, we collect data from all-around of sources, including company reports, government databases, and paid industry platforms.
- Our research is based on secondary data, which helps us build a strong understanding of the market across regions and industries. Then we validate this information through primary research by speaking directly with industry experts, companies, and stakeholders.
- By combining secondary and primary research, we ensure that our market insights are accurate, practical, and closely aligned with real market conditions.
2. Data Collection
We gather information from both public and verified sources:
3. Data Structuring
Step 3:
- All collected data is organized into a consistent format to ensure accurate analysis. Since inputs come from multiple sources, they are standardized and aligned before use.
- The data is segmented by product, application, and region, and mapped across a defined historical period (2020–2024). All values are converted into common units (USD Mn/Bn), and volume and pricing are aligned where required to estimate revenue.
- Any overlaps or inconsistencies are reviewed and adjusted to maintain accuracy (<5% variance threshold).
- The result is a structured dataset that allows for clear comparison across regions and supports reliable analysis and forecasting.
Structured Market Dataset, USD Mn/Bn
| Region | Segment | VolumeUnits | Avg PriceUSD | RevenueUSD Mn | Share % |
|---|---|---|---|---|---|
| North America | Product A | 250 | 2.5 | 500 | 15% |
| Product A | XX | XX | XX | XX | |
| Product A | XX | XX | XX | XX | |
| Consistent methodology applied across regions | |||||
4. Market Estimation
Step 4: TOP-DOWN APPROACH
- We start with the overall market size at a global or macro level.
- The market is then narrowed down based on scope and industry relevance.
- We apply penetration rates and split the data by region and segment.
- This helps us estimate the market size for specific segments.
- The numbers are validated through cross-checks to ensure accuracy.
Step 5: BOTTOM-UP APPROACH
- We begin by analyzing data from leading companies in the market.
- Revenue data is collected and mapped across different segments.
- The data is then aggregated to estimate the total market size.
- To fill in any gaps, adjustments are made based on industry standards.
- Validation checks make sure that the results are correct.
5. Forecasting
Step 6:
At Polaris Market Research & Consulting, Inc., we employ a methodical forecasting strategy. This approach blends the analysis of historical data with real-time market validation. To forecast future trends with precision, we examine past patterns, pricing fluctuations, and the interplay of supply and demand. To ensure our conclusions reflect the present market landscape, we actively seek input from industry experts and key stakeholders.
To refine our predictions, we carefully consider critical elements such as market drivers and restraints, fluctuations in raw material costs, emerging technologies, and the production capabilities of various regions. Furthermore, we assess regulatory frameworks and potential policy shifts to gauge their potential impact on market expansion.
All this information is synthesized to generate precise forecasts for each segment and region. These forecasts illuminate the current state of the market and highlight forthcoming opportunities.
6. Validation & Triangulation
Step 7:
In the final stage, we validate all our estimates using a triangulation method, where data is cross-checked from multiple reliable sources, like company data, primary interviews, and secondary research. This helps us make sure that our numbers are correct and fit with the rest of the market.
This process involves verifying data consistency across various segments and geographic areas. It also requires comparing historical trends with the assumptions support the forecast. Any discrepancies involve adjustments to ensure everything remains aligned and dependable.
Once the data is finalized, we prepare the final outputs, including market size estimates, segment-wise breakdowns, and growth metrics. These are delivered in structured formats such as tables, charts, and data files for easy analysis and use.
We collaborate closely with clients, ensuring the final products align with their requirements. This includes offering tailored adjustments, supplementary data analyses, and continuous assistance. Furthermore, we monitor market trends post-delivery, providing updates and refinements to maintain the insights' relevance as time passes.
Triangulation Framework
Estimates are cross-verified across three sources:
Company-level data
• Primary inputs from industry participants
• Secondary benchmarks and published data
Variance maintained within +5-10%
Adjustments applied to align estimates
Segment values validated against overall market structure
Data Consistency & Integrity
Segment totals validated to 100%
Regional estimates aligned with global market size
Historical trends compared against forecast outputs
Assumptions reviewed for cross-segment and regional alignment
Final Outputs
Deliverables
Client Alignment & Support
- Deliverables are aligned with defined client requirements and scope
- Custom data cuts and segment splits are incorporated as required
- Post-delivery queries are addressed through analyst interactions
- Additional clarifications and data support are provided upon request
Client Continuity & Updates
- Market developments are tracked post-delivery to capture changes in key trends
- Updated data and revisions are provided based on new market inputs
- Additional refinements and data cuts are shared as required
- Continued analyst engagement supports evolving client requirements
Download Sample Report of Europe Transcritical CO2 Market
Please fill out the form to request a customized copy of the research report.
