Industry Dynamics
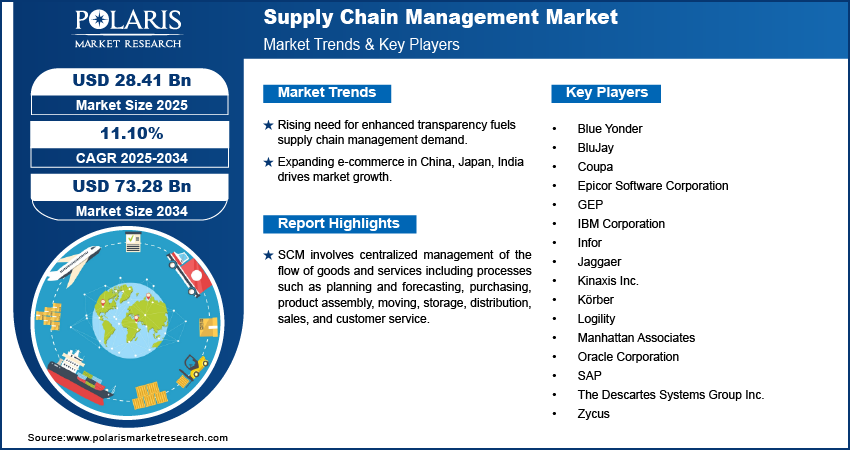
- The global supply chain management market is fueled by increasing demand for enhanced supply chain transparency.
- The growth in e-commerce across countries such as China, Japan, and India is also anticipated to increase demand for supply chain management.
- Growing industrialization, especially in emerging countries such as India, is creating a lucrative market opportunity.
- Growing security and privacy concerns among enterprises may hamper the market growth.
Source: Polaris Market Research Analysis
AI Impact on Supply Chain Management Market
- Streamlines repetitive tasks while optimizing routes and overall logistics efficiency.
- Provides real-time visibility coupled with actionable predictive insights.
- Flags potential disruptions early, supporting proactive risk management.
SCM involves centralized management of the flow of goods and services including processes such as planning and forecasting, purchasing, product assembly, moving, storage, distribution, sales, and customer service. Supply chain management focuses on the development and delivery of goods with higher efficiency and greater speed. Industry players are developing digital SCM systems to improve efficiency in material handling and delivery. The use of supply chain software enables suppliers, manufacturers, logistics providers, and retailers to efficiently manage product creation, order fulfillment, and information tracking.
Key Functions of Supply Chain Management Market
Logistics Management: This type of management involves managing the flow of goods from their source to their destination. It assists in enhancing delivery times and reducing the cost of transportation.
Warehouse Management System: The warehouse management system is used in managing inventory, storage, picking, packing, and distribution activities. It enhances the efficiency of warehousing activities.
Supply Chain Analytics: Supply chain analytics assists in analyzing demands, performance issues, and supply problems. They enable effective planning and decision making based on the analyses.
Procurement & Sourcing: The procurement and sourcing process is that of buying materials and selecting a suitable supplier for the business activities.
Integration of advanced technologies such as AI, machine learning, IoT, and automation into SCM enhances processes like manufacturing, maintenance, and distribution, resulting in greater efficiency. These technologies are capable of predicting failure before it happens to enable uninterrupted flow of the supply chain. These technologies are increasingly being adopted for enhanced transparency, visibility, connectivity, and SCM utilization. Supply chain management offers greater control over manufacturing processes for improved product quality, decreased risk of recalls, and stronger consumer brands. It also assists in maintaining control over shipping procedures to provide enhanced customer service and address shortages or inventory oversupply. Efficient supply chain management offers growth opportunities for companies to strengthen large and international operations.
Source: Polaris Market Research Analysis
Industry Dynamics
Growth Drivers
The global supply chain management market is fueled by increasing demand for enhanced supply chain transparency and greater demand for management solutions from large and medium-sized enterprises. The growth in e-commerce across countries such as China, Japan, and India, rising industrialization, and growing demand from the food and beverage sector supplement the market growth. Global players are expanding into these countries to tap supply chain management market potential. Technological advancements and increasing adoption of advanced technologies such as artificial intelligence and machine learning further support the supply chain management market growth. New product launches and acquisitions by leading players in the market, coupled with increasing use in the adoption of cloud-based SCM solutions, have resulted in greater demand for SCM across the globe.
Which Emerging Trends are Driving the Supply Chain Management Market?
The SCM market is evolving with sustainability, digital transformation, and resilience. Adoption of AI and predictive analytics for inventory and demand optimization is emerging as a key trend. Another trend is the demand for IoT and digital twins for real-time monitoring and simulation. Blockchain technology is being used for transparency and regulatory compliance. Industry players are increasingly focusing on agile networks through multi-sourcing, nearshoring, and supply chain diversification. Robotics, automation, and last-mile innovations improve logistics efficiency. Further, cloud-based platforms and supply-chain-as-a-service models provide flexibility and scalability. These trends are reshaping the global industry by enhancing efficiency and risk management. They provide a competitive advantage to the industry players. The following table provides information on emerging trends in the supply chain management industry.
| Trend | Description | Key Drivers/Technologies | Regions Leading Adoption |
| AI and Predictive Analytics | Use of AI for predictive maintenance, real-time decision-making, and demand forecasting. Enhances accuracy and reduces supply disruptions | AI/ML, Cloud Analytics, Big Data | North America, Europe, Asia Pacific |
| Digital Twins | Virtual replicas of supply networks for simulation and risk management. They help identify bottlenecks and optimize flows | IoT, Simulation, Cloud Computing | U.S., Germany, Japan, South Korea |
| Blockchain | Enhances transparency and traceability, secures transactions across multi-tier supply chains, and combats counterfeiting | Blockchain, Smart Contracts | Europe, Asia-Pacific |
| Sustainability and Circular Supply Chains | Focus on minimizing carbon footprints, recycling/reuse strategies, and green logistics | Renewable Energy Logistics, ESG Reporting Tools | Europe, North America |
| IoT & Edge Connectivity | Real-time asset monitoring and predictive alerts for perishable goods and logistics operations | IoT Sensors, Edge AI, 5G | China, Japan, South Korea, U.S. |
| Autonomous Logistics and Robotics | Use of AMRs, automated warehouses, and drones to boost efficiency and reduce labor dependency | Drones, Robotics, Computer Vision | North America, China, Singapore |
| Cross-Border E-commerce Optimization | SCM systems optimized for global e-commerce, customs automation, and last-mile delivery innovations | API Integrations, AI Logistics Platforms | Asia Pacific, North America |
Source: Polaris Market Research Analysis
Report Segmentation
The market is primarily segmented based on component, user type, deployment model, end use industry, and region.
| By Component | By User Type | By Deployment Model | By End Use Industry | By Region |
- Hardware
- Software
- Services
| | | - Retail and Consumer Goods
- Automotive
- Healthcare & Pharmaceuticals
- Food & Beverages
- Transportation & Logistics
- Manufacturing
- Others
| - North America (U.S., Canada)
- Europe (France, Germany, UK, Italy, Netherlands, Spain, Russia)
- Asia Pacific (Japan, China, India, Malaysia, Indonesia, South Korea)
- Latin America (Brazil, Mexico, Argentina)
- Middle East & Africa (Saudi Arabia, UAE, Israel, South Africa)
|
Source: Polaris Market Research Analysis
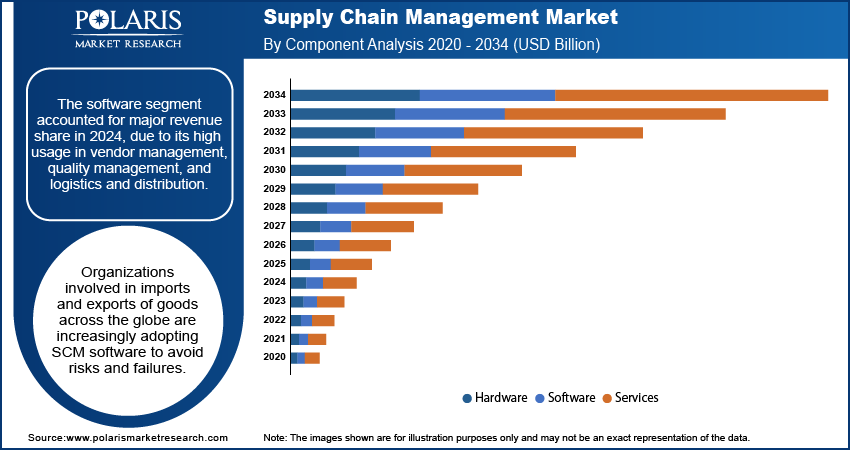
The Software Segment Accounted for a Revenue Share of 60.15% in 2025
The software segment accounted for major revenue share in 2025, due to its high usage in vendor management, quality management, and logistics and distribution. Organizations involved in imports and exports of goods across the globe are increasingly adopting SCM software to avoid risks and failures. SCM software further offers benefits such as enhanced visibility, increased efficiency, analytics, reduced costs, greater agility, and increased compliance, which contributed to its high adoption in large enterprises. Moreover, it assists in automating major processes such as order processing, invoicing, and shipment tracking. This propelled medium and large eneterprises to invest in supply chain management software.
| Component | Description | Benefits | Use Cases |
| Hardware | Physical elements that make up the computer or network hardware for executing and performing various functions within the system. | Effective functioning and control of operations. | Industrial machinery, networks |
| Software | Digital solutions that are utilized to conduct management, monitor, and control various automated processes. | Efficiency and effective management of data. | Analytics, management systems |
| Services | Service components include installation, training, consultancy, and maintenance services. | Flexibility, effectiveness and proper performance. | Technical support, maintenance services |
Source: Polaris Market Research Analysis
Source: Polaris Market Research Analysis
Small and Medium Size Enterprises is Expected Grow at a High CAGR During the Forecast Period
In 2025, the large enterprises segment accounted for the 55.21% market share, owing to the need of large enterprises to to handle complex global networks. SCM helps large enterprises by providing real-time visibility, cost reductions, improved efficiency. The strong network and brand identity of large enterprises also propelled these enterprises to adopt SCM software. These enterprises are further depended on SCM software for procurement, inventory, logistics, and demand planning.
Small and medium-size segment is projected to grow at a robust pace in the coming years. This is due to high investment by small and medium-size businesses in SCM for efficient and secure operations, improved customer experience, and higher productivity. Small and medium-sized enterprises are further turning toward cloud-based SCM solutions owing to their flexibility and cost-effectiveness.
Cloud-based Segment is Expected to Witness Fastest Growth During the Forecast Period
The cloud-based segment is expected to witness a significant growth rate of CAGR 10.9% during the forecast period owing to its greater flexibility and adaptability to change. Cloud-based software can be easily modified to address fluctuating circumstances. These software can also be easily integrated with advanced technologies to cater to specific business needs, eliminating the need for a full-scale migration. The decreasing the cost of data storage coupled with the growing adoption of cloud computing is accelerating the growth of the segment. Enterprises across the globe are increasingly shifting towards cloud-based SCM software owing to their greater processing capabilities, storage, cost-effective pricing models, and reduction in operational overhead.
North America Held the 32.4% Revenue Share in 2025
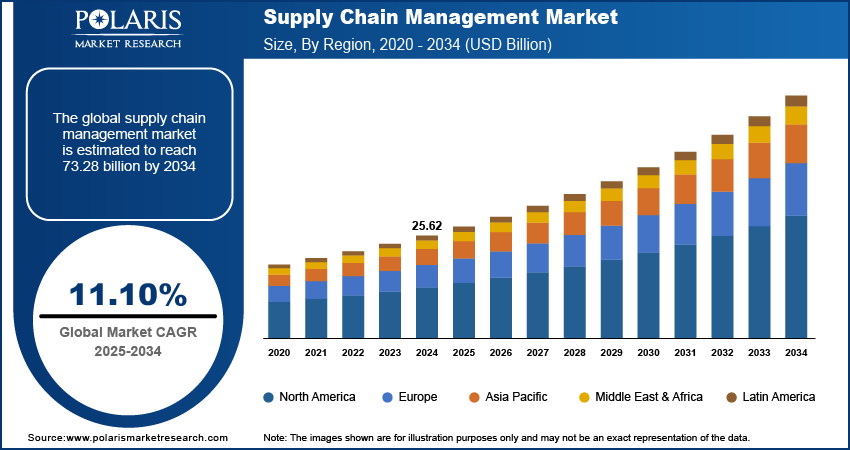
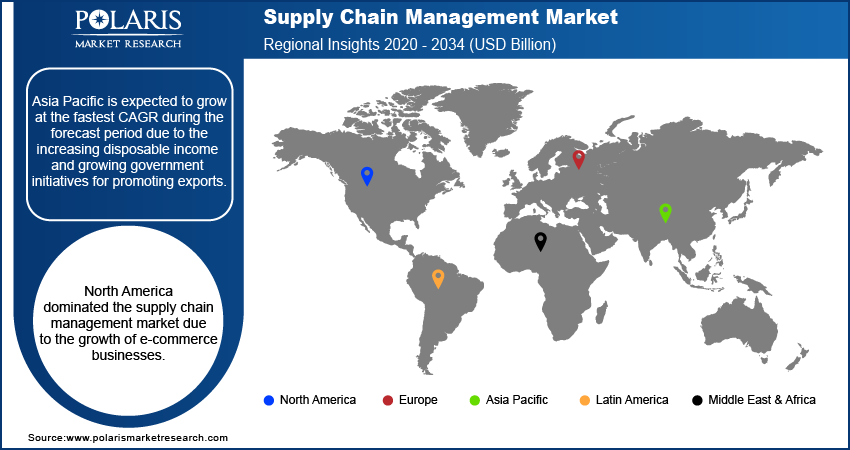
North America accounted for the largest revenue share in 2025, due to growth in e-commerce and an increase in demand for transparency in processes across the supply chain. Established technological infrastructure in the region combined with the high adoption of advanced technologies surther fueled the growth of the market in the region. The various mergers and acquisitions taking place between major vendors in the region also contributed to the market dominance. The industry leaders are expanded their presence in the region, leading to supply chain management market dominance.
The market in the Asia Pacific is projected to grow at a robust CAGR of 14.6% in the coming years, owing to growing e-commerce sector and rising disposable income. The growth of quick delivery services in countries like India and Vietnam are also driving the market growth in the region. The growing population coupled with increasing online shopping is further leading to an increase in market revenue. Moreover, the expansion of operation by major companies in the region are propelling the market growth.
Source: Polaris Market Research Analysis
Competitive Insight
Major players in the supply chain management market are Blue Yonder, BluJay, Epicor Software Corporation, Coupa, GEP, IBM Corporation, Infor, Jaggaer, Kinaxis Inc., Körber, Logility, Manhattan Associates, Oracle Corporation, SAP, The Descartes Systems Group Inc., and Zycus among others. These companies are taking initiatives to strengthen their market presence by introducing advanced solutions for its customers. These players are also collaborating with other market leaders to expand their offerings and acquire new customers.
Major players:
- Blue Yonder
- BluJay
- Epicor Software Corporation
- Coupa
- GEP
- IBM Corporation
- Infor
- Jaggaer
- Kinaxis Inc.
- Körber
- Logility
- Manhattan Associates
- Oracle Corporation
- SAP
- The Descartes Systems Group Inc.
- Zycus
Future of Supply Chain Management Market
Supply chain management is forecast to witness steady growth as AI-enabled software applications become more widely used. In addition to this, real-time visibility will become an indispensable part of all industries. The emphasis on sustainability and effective resource utilization is expected to be a key trend that will determine the future course of supply chains.
Recent Developments
April 2026: Logility announced the availability of its agentic AI layer, Orchestration Center. The company stated that the agentic AI layer is designed to unify planning, production, supplier management, and transportation management into a single, automated execution system. (source: businesswire.com)
February 2026: ScanTrust announced the acquisition of Trust Codes, an anti-counterfeiting and traceability technology provider. According to ScanTrust, the acquisition marks a move toward deeper blockchain integration. (source: scantrust.com)
Supply Chain Management Market Report Scope
| Report Attributes | Details |
| Market size value in 2025 | USD 28.41 billion |
| Market size value in 2026 | USD 31.27 billion |
| Revenue forecast in 2034 | USD 73.28 billion |
| CAGR | 11.10% from 2026 - 2034 |
| Base year | 2025 |
| Historical data | 2021 - 2024 |
| Forecast period | 2026 - 2034 |
| Quantitative units | Revenue in USD Billion and CAGR from 2026 to 2034 |
| Segments covered | - By Component
- By User Type
- By Deployment Model
- By End Use Industry
|
| Regional scope | - North America
- Europe
- Asia Pacific
- Latin America
- Middle East & Africa
|
| Key companies | Blue Yonder, BluJay, Epicor Software Corporation, Coupa, GEP, IBM Corporation, Infor, Jaggaer, Kinaxis Inc., Körber, Logility, Manhattan Associates, Oracle Corporation, SAP, The Descartes Systems Group Inc., and Zycus. |
Source: Polaris Market Research Analysis

