
Food Antioxidants Market Share, Size, Trends, Industry Analysis Report, 2026 - 2034
REPORT DETAILS
REPORT DETAILS
ABOUT THIS REPORT
Food Antioxidants Market Summary
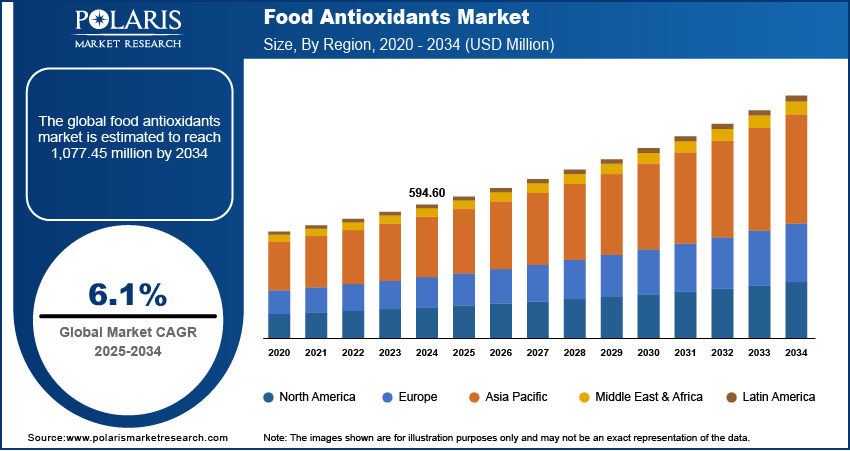
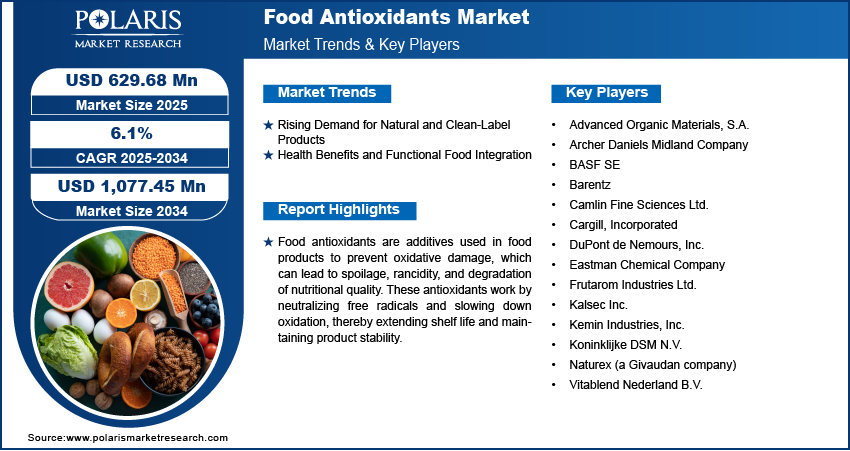
The food antioxidants market size was valued at USD 629.68 million in 2025, growing at a CAGR of 6.2% during 2026–2034. The market is driven by growing demand for natural, clean-label ingredients, rising processed food consumption, and increasing health-conscious consumer preferences.
Market Statistics
Key Takeaways
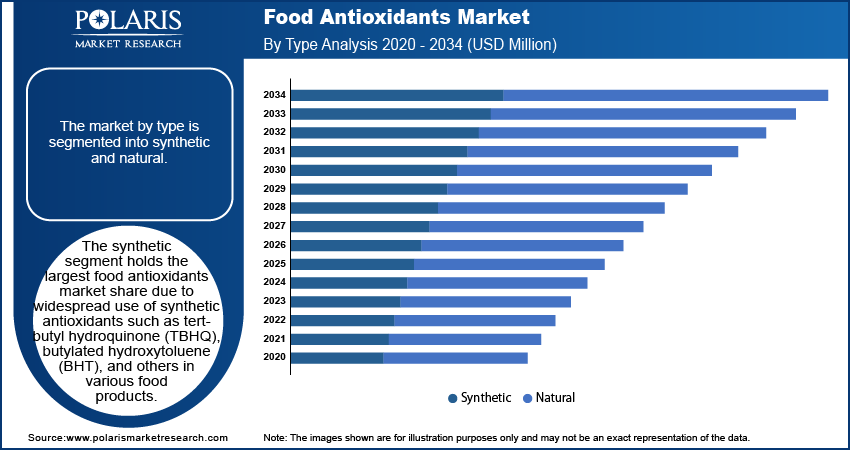
- The synthetic antioxidants segment held the largest share of around 58%. This was mainly because they are widely use in processed foods and have been shown to make food last longer.
- The meat and poultry segment led the market with about 34% share. Antioxidants are very important for keeping food fresh and keeping its nutritional value.
- Asia Pacific held the largest regional share of 44.65% in 2025. This dominance was fueled by increasing disposable incomes, a surge in processed food consumption, and easy access to natural antioxidants.
- Europe is expected to grow at a CAGR of 6.8%, driven by increasing consumer preference for antioxidant-rich and health-focused food products.
- Germany holds a substantial share of the European market, at approximately 25%. This is because there is a lot of demand for clean-label and functional foods and a well-developed food processing sector.
Industry Dynamics
- Rising consumption of processed and convenience foods increases demand for antioxidants to extend shelf life and maintain food quality.
- Growing preference for natural ingredients fuels the shift from synthetic to plant-based antioxidants in response to health-conscious consumer behavior.
- Expansion of the functional foods sector encourages manufacturers to add antioxidants for added health benefits, appealing to wellness-focused consumers globally.
- Stringent regulations and growing safety concerns over synthetic antioxidants may limit their use, prompting manufacturers to seek safer alternatives.
To Understand More About this Research: Download Sample Report
The food antioxidants market focuses on compounds that help prevent oxidative damage in food products. These antioxidants, including natural and synthetic variants, are widely used to enhance shelf life, maintain nutritional quality, and improve consumer appeal. The market is driven by increasing consumer awareness regarding food preservation, rising demand for natural ingredients, and stringent food safety regulations. Additionally, the growing trend of clean-label products and the expansion of the processed food industry further fuel market growth.
Key drivers of the food antioxidants market include the rising consumption of convenience and processed foods, which require extended shelf stability. The increasing focus on health and wellness is also prompting demand for natural antioxidants derived from plant-based sources such as rosemary extract, vitamin C, and vitamin E. Furthermore, regulatory initiatives promoting food safety and quality assurance contribute to market expansion. Qualitative analysis indicates a shift towards natural antioxidants due to consumer preferences and regulatory pressure on synthetic variants, shaping the competitive landscape and product innovation strategies within the industry.
Market Dynamics
Rising Demand for Natural and Clean-Label Products
The increasing consumer preference for natural and clean-label products is a significant food antioxidants market driver. Consumers are becoming more health-conscious and are actively seeking food products free from synthetic additives and preservatives. This shift has led manufacturers to incorporate natural antioxidants, such as tocopherols and rosemary extract, to meet consumer demand for transparency and simplicity in ingredient lists. According to a report by the American Heart Association (2024), diets rich in natural antioxidants from fruits and vegetables are associated with reduced risks of chronic diseases, reinforcing consumer inclination towards naturally preserved foods.
Health Benefits and Functional Food Integration
The recognition of antioxidants' health benefits has propelled their integration into functional foods, further driving food antioxidants market growth. Antioxidants are known to combat oxidative stress, thereby supporting overall health and reducing the risk of chronic conditions. A study published in the Journal of Nutrition and Health Sciences (2023) highlighted that polyphenols, a type of antioxidant found in various plant-based foods, play a crucial role in reducing inflammation and promoting cardiovascular health. This scientific backing has encouraged food manufacturers to fortify products with antioxidant-rich ingredients, catering to the growing consumer demand for functional foods that offer specific health benefits.
Segment Insights
Assessment by Type
The food antioxidants market segmentation, based on type, includes synthetic and natural. The synthetic segment holds the largest food antioxidants market share. This dominance is attributed to the widespread use of synthetic antioxidants such as tert-butyl hydroquinone (TBHQ), butylated hydroxytoluene (BHT), propyl gallate (PG), and butylated hydroxyanisole (BHA) in various food products. These compounds are favored for their effectiveness in extending shelf life and preserving the quality of processed foods. However, the utilization of synthetic antioxidants is subject to strict regulations due to potential health concerns, prompting manufacturers to adhere to established safety standards.
Evaluation by Application
The food antioxidants market is segmented by application into meats & poultry, bakery & confectionary, fats & oil, fish, pet food, and others. The meats & poultry segment is dominating the market. This dominance is primarily due to the high global consumption of meat products, which necessitates the use of antioxidants to prevent spoilage and extend shelf life. Antioxidants play a crucial role in maintaining the quality and safety of meat products by inhibiting oxidative rancidity and preserving nutritional value. The increasing demand for processed and convenience meat products further amplifies the need for effective antioxidant solutions in this segment.
Regional Insights
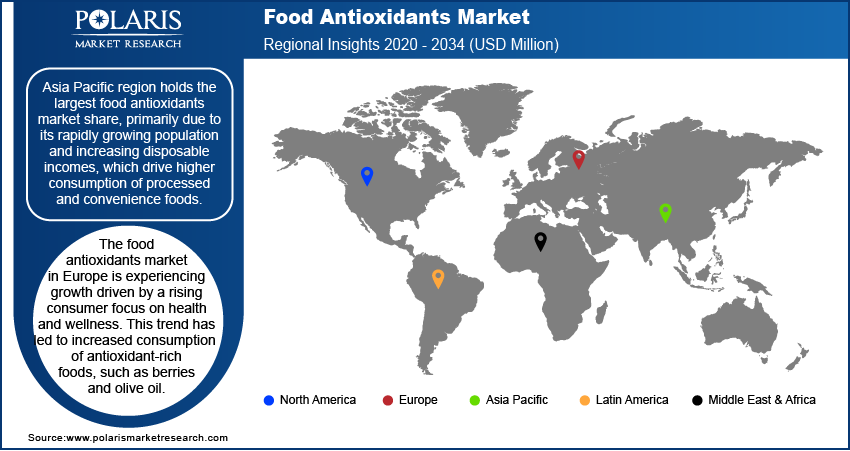
By region, the study provides food antioxidants market insights into North America, Europe, Asia Pacific, Latin America, and the Middle East & Africa. Asia Pacific holds the largest market share, primarily due to its rapidly growing population and increasing disposable incomes, which drive higher consumption of processed and convenience foods. This surge in demand necessitates the use of antioxidants to preserve food quality and extend shelf life. Additionally, the region's rich biodiversity offers abundant sources of natural antioxidants, aligning with the global trend towards clean-label and health-conscious products. Countries such as China and India are at the forefront, with expanding food processing industries and a growing awareness of the health benefits associated with antioxidants, further boosting the market in this region.
The food antioxidants market in Europe is experiencing growth driven by a rising consumer focus on health and wellness. This trend has led to increased consumption of antioxidant-rich foods, such as berries and olive oil. For instance, sales of British blueberries have surged by 13% as consumers seek healthier food options. Similarly, despite challenges such as extreme weather affecting production, olive oil remains a popular choice due to its health benefits, including high antioxidant content. These developments underscore a growing preference for natural sources of antioxidants among European consumers.
Key Players and Competitive Insights
The food antioxidants market features several prominent companies actively contributing to the industry's growth. These include BASF SE; Archer Daniels Midland Company; Koninklijke DSM N.V.; Eastman Chemical Company; Kemin Industries, Inc.; Kalsec Inc.; Camlin Fine Sciences Ltd.; Vitablend Nederland B.V.; Barentz; Frutarom Industries Ltd.; Advanced Organic Materials S.A.; Cargill Incorporated; DuPont de Nemours, Inc., and Naturex (a Givaudan Company).
These companies offer a diverse range of antioxidant products catering to various applications within the food industry. For instance, BASF SE and Eastman Chemical Company provide synthetic antioxidants known for their effectiveness in preserving processed foods. Conversely, companies like Kalsec Inc. and Naturex specialize in natural antioxidants derived from plant sources, aligning with the growing consumer preference for clean-label products. The presence of both multinational corporations and specialized firms fosters a competitive environment, encouraging continuous innovation and adaptation to evolving market trends.
Strategic initiatives such as mergers, acquisitions, and partnerships are common among these key players, aiming to expand product portfolios and global reach. For example, the merger between International Flavors & Fragrances Inc. and DuPont's Nutrition & Biosciences business in 2021 created a comprehensive ingredients and solutions provider, enhancing their market position. Additionally, companies are investing in research and development to create novel antioxidant solutions that meet the increasing demand for natural and sustainable food preservation methods. This dynamic landscape underscores the importance of innovation and strategic collaborations in maintaining competitiveness within the food antioxidants market.
BASF SE is a German multinational chemical company recognized for its extensive portfolio, which includes food antioxidants. The company offers both synthetic and natural antioxidants, serving various sectors within the food industry. BASF's commitment to innovation and sustainability has solidified its position as a key supplier of food antioxidants, addressing the industry's demand for effective preservation solutions.
Archer Daniels Midland Company (ADM) is a prominent American agribusiness that specializes in the processing of cereal grains and oilseeds. The company produces a range of food ingredients, including antioxidants, to meet the needs of the food processing industry. Its extensive global operations and focus on agricultural processing have established it as a significant player in the food antioxidants market.
List of Key Companies
- Advanced Organic Materials, S.A.
- Archer Daniels Midland Company
- BASF SE
- Barentz
- Camlin Fine Sciences Ltd.
- Cargill, Incorporated
- DuPont de Nemours, Inc.
- Eastman Chemical Company
- Frutarom Industries Ltd.
- Kalsec Inc.
- Kemin Industries, Inc.
- Koninklijke DSM N.V.
- Naturex (a Givaudan company)
- Vitablend Nederland B.V.
Food Antioxidants Industry Developments
-
May 2025: NYK Group, a Japan-based leader in chemical R&D and manufacturing, introduced BioxiGuard, a next-generation antioxidant formulated specifically for marine biodiesel fuel. The product is slated for market availability starting August.
Food Antioxidants Market Segmentation
By Type Outlook (Revenue-USD Million, 2021–2034)
- Synthetic
- Natural
By Form Outlook (Revenue-USD Million, 2021–2034)
- Dry
- Liquid
By Application Outlook (Revenue-USD Million, 2021–2034)
- Meats & Poultry
- Bakery & Confectionary
- Fats & Oil
- Fish
- Pet Food
- Others
By Regional Outlook (Revenue-USD Million, 2021–2034)
- North America
- US
- Canada
- Europe
- Germany
- France
- UK
- Italy
- Spain
- Netherlands
- Russia
- Rest f Europe
- Asia Pacific
- China
- Japan
- India
- Malaysia
- Suth Korea
- Indnesia
- Australia
- Vietnam
- Rest f Asia Pacific
- Middle East & Africa
- Saudi Arabia
- UAE
- Israel
- Suth Africa
- Rest f Middle East & Africa
- Latin America
- Mexic
- Brazil
- Argentina
- Rest f Latin America
Report Scope
| Report Attributes | Details |
| Market Size Value in 2025 | USD 629.68 million |
| Market Size Value in 2026 | USD 667.15 million |
| Revenue Forecast by 2034 | USD 1,077.45 million |
| CAGR | 6.2% from 2026 to 2034 |
| Base Year | 2025 |
| Historical Data | 2021–2024 |
| Forecast Period | 2026–2034 |
| Quantitative Units | Revenue in USD million and CAGR from 2026 to 2034 |
| Report Coverage | Revenue Forecast, Market Competitive Landscape, Growth Factors, and Industry Trends |
| Segments Covered |
|
| Regional Scope |
|
| Competitive Landscape |
|
| Report Format |
|
| Customization | Report customization as per your requirements with respect to countries, regions, and segmentation. |
How is Report Valuable for Organization?
Workflow/Innovation Strategy: The food antioxidants market has been segmented into detailed segments of type, form, and application. Moreover, the study provides the reader with a detailed understanding of the different segments at both the global and regional levels.
Growth/Marketing Strategy: Companies in the food antioxidants market focus on growth and marketing strategies that emphasize product innovation, clean-label solutions, and strategic partnerships. Increasing consumer demand for natural antioxidants has led businesses to invest in research and development to create plant-based and sustainable alternatives. Expansion into emerging markets, particularly in Asia Pacific and Latin America, is a key strategy to tap into rising processed food consumption. Companies also strengthen their market presence through acquisitions and collaborations to enhance production capacity and global reach. Additionally, digital marketing and consumer awareness campaigns play a crucial role in promoting the benefits of food antioxidants in extending shelf life and preserving nutritional value.
FAQ's
The food antioxidants market size was valued at USD 629.68 million in 2025 and is projected to grow to USD 1,077.45 million by 2034.
The market is projected to register a CAGR of 6.2% during the forecast period, 2025-2034.
North America had the largest share of the market.
The food antioxidants market key players include BASF SE; Archer Daniels Midland Company; Koninklijke DSM N.V.; Eastman Chemical Company; Kemin Industries, Inc.; Kalsec Inc.; Camlin Fine Sciences Ltd.; Vitablend Nederland B.V.; Barentz, Frutarom Industries Ltd.; Advanced Organic Materials, S.A.; Cargill Incorporated; DuPont de Nemours, Inc.; and Naturex (a Givaudan Company).
The synthetic segment accounted for the larger share of the market in 2025.
Food antioxidants are substances added to food products to prevent or slow down oxidation, a chemical process that leads to spoilage, rancidity, and loss of nutritional value.
Download Sample Report of Food Antioxidants Market
Please fill out the form to request a customized copy of the research report.
