
Global Geophysical Services Market Size, Share & Growth Analysis Report, 2024-2032
REPORT DETAILS
The global geophysical services market was valued at USD 14.09 billion in 2023 and is expected to grow at a CAGR of 6.4% during the forecast period. The physical characteristics of the Earth's subsurface are measured and mapped using geophysical services. This may entail calculating the density, resistivity, and porosity of rocks and soils, among other things. Numerous uses for geophysical services exist, such as mineral discovery, groundwater research, engineering surveys, and environmental evaluations.
Source: Polaris Market Research Analysis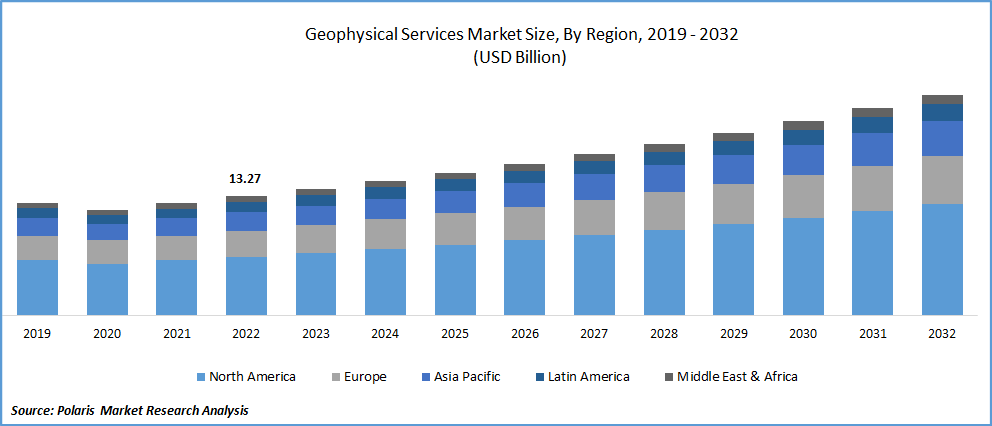
Know more about this report: Download Sample Report
It is anticipated that increased demand for precious metals including gold, platinum, & titanium, will boost demand for the geophysical services. The country has invested more money in geophysical services as a result of increased shale gas reserve exploration. For instance, in June 2022, To explore shale gas at its Raniganj South block in West Bengal, Great Eastern Energy Corporation aims to invest roughly USD 2 Bn.
Seismic services & analytical data providers are needed by the oil and gas industry. The market for geophysical services will advance over the forecast period as a result of factors such as the oil & gas industry's growing embrace of digital services & performance improvement through service integration.The market for geophysical services is being driven by the growth of exploration activity. Geophysical services may be used to find deposits of minerals and rocks that can be used to address society's resource needs through mineral exploration.
Due to the COVID-19 pandemic's global impact in 2020, the exploration and production (E&P) sector suffered deteriorating demand. Oil & gas prices significantly fell as a result of increasing production of oil & gas and market supply. Additionally, the efforts made by governments and businesses to stop the virus's spread have decreased economic activity, which has led to a decline in oil prices.
Industry Dynamics
Growth Drivers
The oil and gas sector has started implementing digital technology with an emphasis on enhancing health and safety, production potential, reservoir resource understanding, and oil field operational efficiency. Additionally, a lot of businesses are using business and digital technologies sparingly to improve their performance, which will probably support the geophysical services market expansion.
The development of new geophysical techniques, along with the capacity to process and analyze data quickly and assist decision-making and action in real-time, has caused a shift in major actors' priorities toward a future powered by sustainable energy sources. For instance June 2021, CGG released GeoSoftware 11.0. The software utilizes improved machine learning capabilities, such as WellGen, a new Hampson Russell application that enables deep learning marine combining geology and geophysical interpretations.
Moreover, the demand for fossil fuels surged as a result of both global urbanization and exponential economic growth. Geophysical services are widely used by both private and public organizations to identify the features of the underlying geology. Without drilling or tunneling, it measures the variation between rock types and physical discontinuities.
To fulfill the rising need for fuel and energy, numerous enormous corporations make investments in exploration and production. For instance, in August 2021, Two contracts from Kuwait Oil Company (KOC), including one for a 3D seismic survey and one for rig supplies, have been given to the Bureau of Geophysical Prospecting (BGP). The West Kuwait and Mutriba districts will see the completion of the 221 million USD deal.
In addition, in September 2022, Sercel stated that it had successfully acquired the software division of ION Geophysical Corporation ("ION"). Owing to the Marlin software, this acquisition allows Sercel to diversify its software and service offerings while also expanding its prospects for concurrent marine operations.
Therefore, the market is growing rapidly owing to mining activities, technology adoption, software launches, and coloration for expanding geophysical services across various verticals.
Source: Polaris Market Research Analysis
Report Segmentation
The market is primarily segmented based on survey type, technology, application, end-user, and region.
| By Survey Type | By Technology | By Application | By End User | By Region |
|
|
|
|
|
Source: Polaris Market Research Analysis
Know more about this report: Download Sample Report
The Aerial Segment Is Expected to Witness the Fastest Growth Over the Froeacst Period
The process of employing aerial surveys to gather geophysical data from a location is known as an aerial-based survey in the field of geophysical services. Environmental studies, mineral prospecting, and geological mapping are just a few of the uses for this data. With this kind of survey, measurements are taken from the air using a variety of tools, including cameras, lidar, and ground penetrating radar. The changes in the earth's surface, such as underlying structures and sedimentary layers, are then discovered using these observations.
The Land-Based Sector Is Expected to Hold the Significant Revenue Share
More than 85% of the survey was conducted on land. The investigation of diverse minerals, hydrocarbon sources, and oil and gas reserves relies heavily on land-based geophysical surveys. These surveys also aid in understanding the ground's surface and subsurface geophysical conditions. Using helicopters and fixed-wing aircraft, aerial-based surveys take pictures. The primary businesses that use geophysical data include water exploration, agriculture, and the environment, in addition to oil and gas, mining, and related industries. Agriculture and the water exploration industries have begun more targeted geophysical service exploration to achieve food and water security. The minimal amount of water a person needs each day for residential usage in poor nations like India is 200 liters, demonstrating the enormous potential for the geophysical service industry
Source: Polaris Market Research Analysis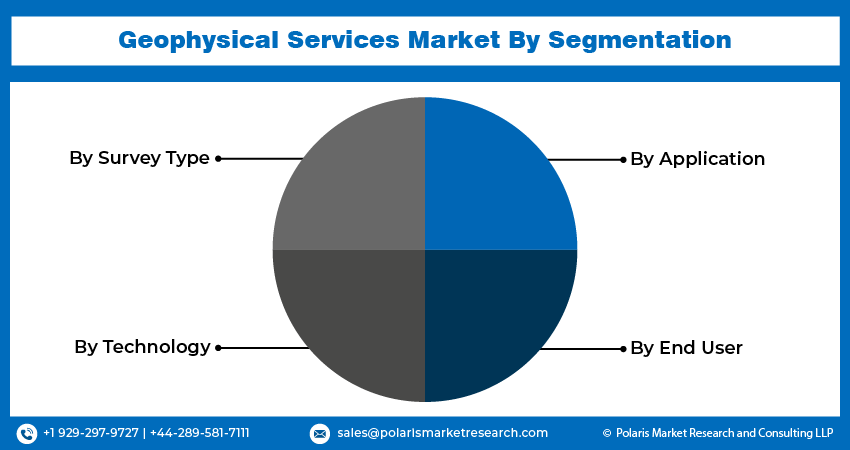
North America Dominated the Market in 2022
As substantial shale gas development takes place in the region, particularly in the US, North America will continue to be a very attractive market for geophysical service providers. Survey activity is anticipated to support the region's dominance in the worldwide geophysical services industry throughout the basins of New York, Oakland, Florida, & Philadelphia. The US market is growing rapidly as a result of extensive shale gas exploration, which increases demand for seismic services and analytical data.
Increased government and private sector investment have also significantly boosted market expansion. The market's volume has increased as a result of the mining industry's expansion. In the US, there are more geophysical surveys being conducted, which is helping the industry expand in this country. Over the past several years, several market participants have consistently carried out geophysical surveys in Canada and the United States, fueling the market's expansion.
In case of Asia Pacific, the need for geophysical services is anticipated to increase over the next few years due to increased mining site exploitation and increased spending. Due to the rise in mineral, oil, and gas exploration activities in the region, the market in Asia Pacific is expected to experience considerable expansion. The need for geophysical services in the Asia Pacific region is being driven by an increase in mining and oil and gas development in Australia and other ASEAN nations.
Source: Polaris Market Research Analysis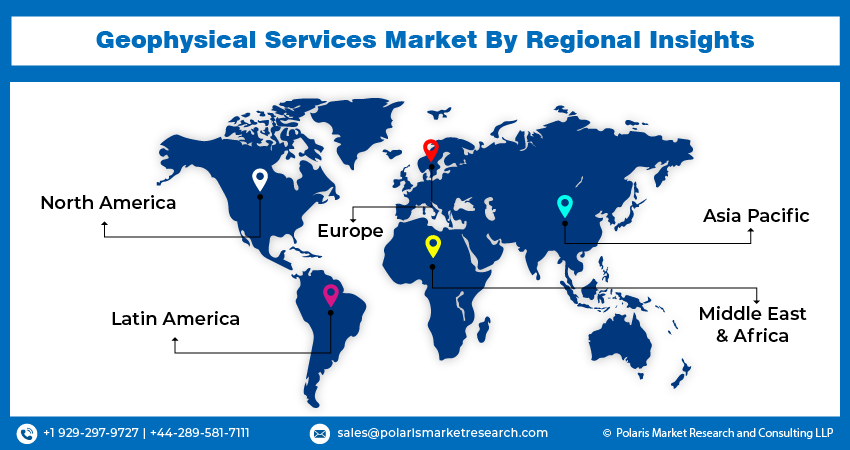
Competitive Insight
Some of the major players operating in the global market include BGP Inc., CGG Geoscience, COSL-China Oilfield Services, Dawson Geophysical Services, DMT Gmbh., EON Geosciences, Geophysical Survey Systems, Geotech Survey, Geospace Technologies, Halliburton Company, Ion Geophysical, IRIS Instruments, IG Seismic Services., New Resolution Geophysics, Petroleum Geo-Services, Polarcus, Phoenix Geophysics, Ramboll Group, Schlumberger, Sea Geo Surveys, and TGS Geophysical.
Recent Developments
- January 2025: Amazon Web Services (AWS) integrated MDIO seismic streaming from the OSDU Data Platform to strengthen AI and ML capabilities. This enables quicker seismic data processing and improves subsurface imaging essential for energy exploration. The solution boosts efficiency and scalability while delivering real-time analytics for geophysical applications within the oil and gas sector.
- September 2024: EGS and “K” Line Wind Service entered a partnership to advance offshore geophysical surveys in Japan through a new jointly owned company, EKGS. The collaboration introduced the Japanese-flagged geotechnical survey vessel EK HAYATE, supporting offshore wind energy development and enhancing marine data acquisition and infrastructure growth across the country.
- August 2024: China Oilfield Services Limited (COSL) launched three advanced technologies, including deepwater/high temperature/high pressure drilling, infilled adjustment well drilling, and carbon dioxide re-injection drilling. The initiative aims to boost operational efficiency while ensuring safety and lowering environmental impact in oil and gas exploration and production.
- January 2024: COSL marked a major milestone by securing its first geophysical surveying contract in North America. The framework agreement from Mexico represents a key step in its market entry and strengthens its regional presence. The partnership highlights COSL’s commitment to expanding global brand recognition and delivering value-added customized services.
- June 2021: the Cape Anguille 3D initiative acquired by the TGS in collaboration with PGS. Orphan Basin may include Cretaceous & Tertiary in-fill deposits and uses Geo-streamer technology for both Kirchhoff 3D PSTM volume & PGS's Reform Titan.
Geophysical Services Market Report Scope
| Report Attributes | Details |
| Market size value in 2024 | USD 14.96 billion |
| Revenue forecast in 2032 | USD 24.56 billion |
| CAGR | 6.4% from 2024 - 2032 |
| Base year | 2023 |
| Historical data | 2019 – 2022 |
| Forecast period | 2024 - 2032 |
| Quantitative units | Revenue in USD billion and CAGR from 2024 to 2032 |
| Segments Covered | By Survey Type, By Technology, By Application, By End User, By Region |
| Regional scope | North America, Europe, Asia Pacific, Latin America, Middle East & Africa |
| Key Companies | BGP Inc., CGG Geoscience company, COSL-China Oilfield Services Limited, Dawson Geophysical Services, DMT Gmbh, and Co.KG., EON Geosciences Inc., Geophysical Survey Systems Inc., Geotech Survey, Geospace Technologies, Halliburton Company, Ion Geophysical, IRIS Instruments, IG Seismic Services., New Resolution Geophysics, Petroleum Geo-Services, Polarcus Ltd., Phoenix Geophysics, Ramboll Group AS, Schlumberger, Sea Geo Surveys Pvt Ltd., and TGS Geophysical Company. |
Source: Polaris Market Research Analysis
Geophysical Services Market FAQ's
The global geophysical services market size is expected to reach USD 24.56 billion by 2032.
Key players in the market geophysical services market are BGP Inc., CGG Geoscience, COSL-China Oilfield Services, Dawson Geophysical Services, DMT Gmbh., EON Geosciences, Geophysical Survey Systems.
North America contribute notably towards the global geophysical services market.
The global geophysical services market expected to grow at a CAGR of 6.4% during the forecast period.
The geophysical services market report covering key segments are survey type, technology, application, end-user, and region.
Download Sample Report of Geophysical Services Market
Please fill out the form to request a customized copy of the research report.
