
Green Hydrogen Market Growth, Forecast Report, 2026-2034
REPORT DETAILS
What is the Green Hydrogen Market Size?
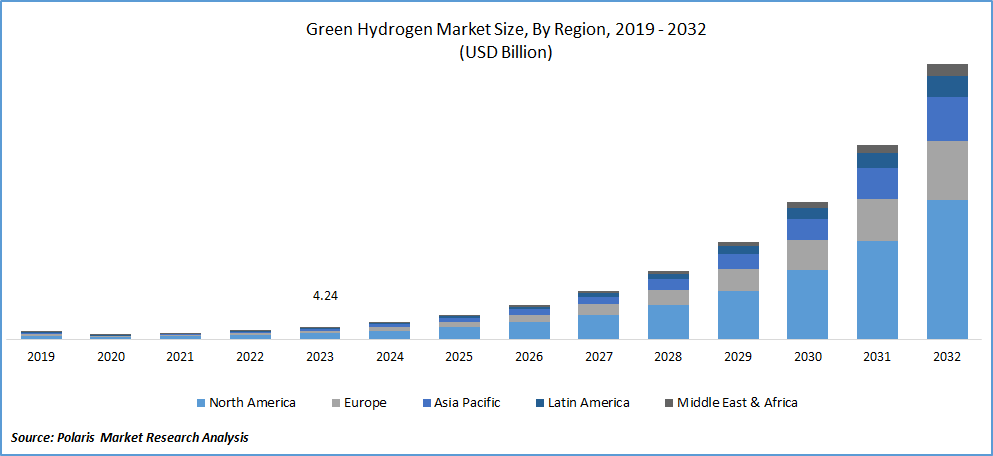
The global green hydrogen market was valued at USD 8.45 billion in 2025 and is forecasted to grow at a CAGR of 41.4% from 2026 to 2034. Global decarbonization goals and investment in clean energy infrastructure are accelerating the adoption of green hydrogen technologies. A few green hydrogen market trends are increasing integration of renewable energy and rising focus on industrial decarbonization.
Market Statistics
Key Takeways
- In 2025, Europe accounted for the largest revenue share of 48.1%. It is driven by significant investments made by European economies with the objective of transitioning toward a clean hydrogen-based economy.
- The North America market is anticipated to witness the highest CAGR of 43.2% during the forecast period. Rising adoption of clean energy legislation boosts the market growth.
- Alkaline electrolyzer accounted for the largest market share of 66.60% in 2025. Its extended lifespan ensures constant optimization for greater efficiency and lower costs. This makes it more favorable for producing green hydrogen on a massive scale.
- Pipeline was the dominant segment in the global market, holding the largest share of 61.30% in 2025. This is attributed to its economical and efficient mode of transport for large quantities over significant distances.
- The transportation segment is anticipated to grow quickly at a 41.2% CAGR. This is mainly due to the quick integration of fuel cell technologies in the transportation sector.
Industry Dynamics
- The rising shift toward sustainable energy sources drives the green hydrogen market growth.
- Supportive government policies, incentives, and subsidies promote green hydrogen projects. Such initiatives boost the adoption of green hydrogen across industries.
- High production costs of green hydrogen restrains the growth of the market.
- Investments in research and development and infrastructure development will drive the market development in the coming years.
- Rising demand for fuel cell electric vehicles (FCEVs) would offer lucrative market opportunities during the forecast period.
AI Impact on Green Hydrogen Market
- Artificial intelligence (AI) is used to optimize the performance of electrolyzers.
- AI helps adjust operational parameters in real time. AI adoption reduces energy consumption. It leads to improved sustainability and reduced operational costs.
- Green hydrogen firms adopt AI to scale hydrogen infrastructure. The technology helps them ensure reliable delivery across regions. This way, AI use enables efficient logistics and inventory management.
- AI-based predictive maintenance electrolyzer and digital twins for hydrogen help reduce electrolyzer downtime. It improves utilization rates and enhances asset performance. These factors impact the levelized cost of hydrogen (LCOH) and long-term project economics.
Source: Polaris Market Research Analysis
What is Green Hydrogen?
Green hydrogen is a form of clean hydrogen. Water electrolysis is used to produce green hydrogen. The process is powered by renewable electricity. The electricity is sourced from wind, solar, and hydro. The renewable hydrogen production does not generate greenhouse gas (GHG) emissions. It differentiates green hydrogen from blue hydrogen and gray hydrogen. Fossil fuels, usually natural gas, are used in the production of gray hydrogen. Gray hydrogen is produced via steam-methane reforming without carbon dioxide (CO₂) capture. Similar process is used to produce blue hydrogen. However, it consists of carbon capture and storage (CCS) to reduce CO₂ emissions.
Green Hydrogen vs Blue Hydrogen vs Gray Hydrogen
| Parameter | Green Hydrogen | Blue Hydrogen | Gray Hydrogen |
| Primary energy source | Renewable (solar, wind, and hydro) | Natural gas | Natural gas |
| Capex intensity | High (electrolyzers + renewables) | High (reformers + CCS) | Medium |
| Opex trend | Falling with declining renewable power costs | Stable to rising (gas + CCS costs) | Volatile (natural gas prices) |
| CO₂ emissions | Near-zero | Low to medium (dependent on CCS) | High |
| Green hydrogen cost per kg | High (declining) | Medium | Low |
| Cost trend | Rapidly declining | Moderately declining | Volatile/rising |
| Infrastructure needs | Green hydrogen storage, electrolyzers, and renewables | Reformers, CCS, and pipelines | Reformers and pipelines |
| Investor attractiveness (long term) | High. It is aligned with net-zero pathways and ESG mandates | Medium. Transitional returns. Policy-dependent | Low. Stranded asset risk |
| Revenue upside | Strong. Green premiums, carbon credits, and export masrkets | Moderate. Bridge fuel demand | Limited |
| Policy alignment | Strongly favored by climate policies and subsidies | Conditional support as transition fuel | Increasingly restricted |
| Regulatory risk | Low | Medium (CCS performance scrutiny) | High (carbon pricing, emission caps) |
| Carbon compliance cost | Minimal | Moderate | High |
| Industrial scalability (2030+) | High. Favored for steel, ammonia, and mobility | Medium. Dependent on CCS infrastructure | Low |
| Supply security | High (renewable-based and domestic potential) | Medium (relies on fossil fuel) | Medium to low |
| Buyer sustainability value | Very high. Zero-carbon credentials | Medium. Partial decarbonization | Low |
| Technology risk | Medium (scaling and efficiency improvements ongoing) | Medium (CCS reliability) | Low |
Source: Polaris Market Research Analysis
Green hydrogen holds significant potential as a renewable energy carrier. It is used as a solution for decarbonizing various sectors. Hydrogen fuel cells are used to produce electricity and power vehicles. Green hydrogen is versatile and poses zero-emission characteristics. Thus, it has become a promising alternative to conventional fossil fuels. It is a key component in transitioning to a low-carbon economy. Steel, oil & gas, fertilizers, utilities, and other sectors highly adopt green hydrogen. It helps them mitigate the intermittency of renewable energy sources.
Green Hydrogen Applications
- Green hydrogen in steel production enables low-carbon ironmaking. It replaces coal in direct reduced iron processes.
- Steelmakers focus on hydrogen-based DRI plants for net-zero targets. This propels the use of DRI steel green hydrogen.
- Green hydrogen for ammonia supports decarbonized fertilizer production.
- Green hydrogen for methanol facilitates low-carbon chemical feedstocks. They are used in synthetic fuel applications.
- E-fuels hydrogen is highly used to produce synthetic aviation and marine fuels from captured CO₂.
- Direct electrification is impractical in hard-to-abate sectors. Thus, heavy industry, shipping, and long-haul transport sectors rely on green hydrogen.
Electricity price, electrolyzer CAPEX, utilization/load factor, and downstream costs for compression, storage, and transport influence the green hydrogen production economics. Improvements in renewable power procurement, such as hybrid wind-solar, curtailment capture, and higher electrolyzer utilization lower green hydrogen cost per kg.
Source: Polaris Market Research Analysis
Market Dynamics
What are the Green Hydrogen Market Drivers?
Declining Costs of Renewable Energy
Declining solar and wind power prices reduce the cost of electrolysis. There is a rapid improvement in capacity factors, competitive auctions, and large-scale renewable deployment. Thus, green hydrogen is becoming more cost-competitive than fossil-based alternatives. Owing to lower cost, the industrial and energy sectors prefer green hydrogen. Producers sign long-term power purchase agreements for price stability. Continued efficiency gains in the electrolyzer boost the cost advantage. These factors support faster project scale-up. They also boost investment confidence. Therefore, declining costs of renewable energy drive the green hydrogen industry growth.
Increasing Shift Toward Sustainable Energy Sources
There is a rising integration of renewable energy sources, such as wind and solar power, in green hydrogen production. Electrolysis powered by renewables contributes to the green and sustainable nature of hydrogen production. Many governments and private organizations set ambitious net-zero emission targets for climate change mitigation. These strategies propel the production and use of clean fuels. Therefore, the global energy transition toward sustainable energy drives market growth.
Supportive Green Hydrogen Policies & Subsidy Frameworks
Governments are establishing various policies to promote green hydrogen projects. Many governments provide hydrogen incentives, subsidies, and regulatory support. These initiatives accelerate the development and adoption of green hydrogen. Europe is at the forefront of infrastructure development and national hydrogen strategies, followed by Asia. Expanding infrastructure helps producers increase their capacity and reach. It reduces the green hydrogen production cost. The active involvement of individual governments is crucial to embracing green hydrogen as an alternative fuel. The global market is progressing toward achieving net-zero emission targets. It is adhering to clean hydrogen legislation. The mobility sector is developing vehicles that use hydrogen in internal combustion engines or fuel cells. Policy support is linked to definitions and certification. They include renewable hydrogen criteria and carbon intensity thresholds. It influences subsidy eligibility, cross-border trade, and corporate procurement. Clear rules around certification and guarantees of origin enhance transparency for buyers. They also strengthen market confidence. Therefore, supportive policy and subsidy frameworks drive the green hydrogen industry growth.
What are the Green Hydrogen Challenges?
High Production Cost Breakdown
The capital-intensive nature of electrolyzers increases the production cost of green hydrogen. Also, the high cost of renewable electricity raises the production cost. Electrolyzer systems hold a major share of upfront investments. Balance-of-plant components and grid interconnection increase capital expenditure. It is also increased due to high-cost power electronics. Electricity prices, water purification charges, and maintenance requirements can impact the operating costs. In regions with limited renewable capacity or grid constraints, securing low-cost, reliable power remains difficult. The underutilization of electrolyzers during variable renewable generation reduces efficiency. It also increases levelized hydrogen costs. Therefore, high production costs pose challenges for the green hydrogen industry.
Operational and Infrastructure Challenges
Low volumetric density and high combustibility can pose challenges for green hydrogen storage and transportation. High investments in infrastructure development, such as pipelines and carriers, are required. Thus, the growing storage and transportation challenges and high investment requirements hinder market expansion. Furthermore, the lack of skilled workers poses a challenge to market development.
Green Hydrogen Production Cost and Economics
Electrolyzer CAPEX, electricity prices, and system efficiency drive the green hydrogen costs. Electricity accounts for the 50–70% of the total cost. Access to low-cost renewable power and high electrolyzer utilization reduces the LCOH (levelized cost of hydrogen) of green hydrogen. Electrolyzer systems, balance of plant, and compression/storage lead to the dominance of CAPEX. However, OPEX consists of electricity, water, stack replacement, and maintenance. Policy incentives, carbon pricing, and tax credits improve economics. Declining costs of renewable energy and rising adoption technological advancements are steadily reducing green hydrogen cost. Declining costs of clean hydrogen enhance competitiveness for industrial applications, mobility, and export markets. The following table mentions various components and their impact on green hydrogen costs and LCOH.
| Cost Component | Description | Impact on Green Hydrogen Cost / LCOH |
| Electricity Cost | Cost of renewable power such as solar, wind, and hybrid used for electrolysis | Largest cost component (≈50–70%) Decline in electricity prices reduces the LCOH of green hydrogen |
| Electrolyzer CAPEX | Cost of electrolyzer stacks, power electronics, and balance of plant | High upfront cost Declining with scale and technology learning Improving green hydrogen production economics |
| Electrolyzer Efficiency | kWh of electricity required per kg of hydrogen | Higher efficiency reduces electricity consumption per kg, minimizing green hydrogen costs |
| Capacity Factor | Annual utilization rate of electrolyzer | Higher utilization spreads fixed costs, lowering LCOH |
| O&M Costs (OPEX) | Labor, water, stack replacement, and maintenance | Moderate impact. Stack lifetime is a key cost sensitivity |
| Financing Cost | Cost of capital, interest rates, and risk premium | Lower WACC significantly improves LCOH economics |
| Hydrogen Handling | Compression, storage, and on-site logistics | Adds incremental cost. More significant for mobility and export use cases |
| Policy Incentives | Tax credits, subsidies, and production incentives | Can materially lower green hydrogen cost. Boosts clean hydrogen adoption |
Source: Polaris Market Research Analysis
Segmentation Overview
By Technology Analysis
The alkaline electrolyzer segment dominated the revenue share in 2025. It is a mature technology. The technology has been in use for longer. Thus, there have been continuous improvements in efficiency, reliability, and cost-effectiveness. Due to their scalability and high production capacity, alkaline electrolyzers are preferred for large-scale green hydrogen production. They are in high demand across industrial applications and large-scale hydrogen projects. The segment dominance is driven by its robustness and ability to handle dynamic operating conditions. Alkaline electrolyzers have lower power and current densities.
Unlike PEM electrolyzers, alkaline electrolyzers operate for longer periods. They utilize a liquid alkaline solution. The solution contains potassium or sodium hydroxide as the electrolyte. Alkaline electrolyzers operate at temperatures between 100 and 105°C. However, PEM electrolyzers run between 70 and 90°C. The ability of alkaline electrolyzers to operate at higher temperatures makes them advantageous in certain applications. Emerging AEM/SOEC technologies enhance operational efficiency. They typically require commercialization and scale-up.
| B2B Decision Criteria | Alkaline Electrolyzer | PEM Electrolyzer |
| Commercial maturity | Highly mature, proven at large scale | Commercial, scaling rapidly |
| Typical project scale | Large, centralized hydrogen plants | Small to mid-scale, modular systems |
| CAPEX per MW | Lower | Higher |
| OPEX profile | Lower, stable | Higher, catalyst-driven |
| Load flexibility | Limited turndown, slower ramp | Excellent turndown, fast ramp |
| Renewable integration | Best with steady renewable supply | Ideal for variable solar/wind |
| Hydrogen purity | Standard industrial grade | High purity, mobility-grade |
| Operating pressure | Low to medium | High (reduced downstream compression cost) |
| Footprint & modularity | Larger footprint | Compact, modular |
| Materials supply risk | Low (non-precious metals) | Medium (platinum group metals) |
| Water quality requirement | Moderate | High (ultra-pure water) |
| Maintenance complexity | Lower | Moderate |
| Deployment timeline | Faster for large projects | Faster for modular installations |
| Preferred buyer segments | Ammonia, refining, bulk hydrogen | Mobility, grid services, decentralized users |
| Bankability | High | Growing, policy-supported |
| Long-term competitiveness | Cost leader for bulk H₂ | Performance leader for dynamic operations |
Source: Polaris Market Research Analysis
By Distribution Channel Analysis
In 2025, the pipeline led the revenue share due to its efficiency in transporting large volumes of hydrogen over long distances. Hydrogen is stored and transported in various forms. For instance, it can be stored or transported in liquid form in thermally insulated containers. For gas form, high-pressure containers are used. Pipelines are the most practical and cost-effective distribution option. Existing natural gas pipelines can be used for future hydrogen transport. Pipeline scalability depends on material compatibility, blending limits, network access, and permitting. In some cases, volumes are sufficient and industrial clusters are concentrated. Here, repurposing existing gas infrastructure can reduce long-term transport costs.
Source: Polaris Market Research Analysis
Europe dominated the revenue share in 2025, due to government initiatives related to clean hydrogen. European countries are making investments in hydrogen projects. They are made to transition toward a clean hydrogen-based economy. In December 2023, the UK government announced an investment worth approximately USD 2.19 billion to expand its green hydrogen production. It is expected to cover regions from England to the other Highlands during the next 15 years. In the initial three years, an advance funding of approximately USD 438.2 million is anticipated to develop 125 MW of green hydrogen capability. This capacity will serve various industries. It will contribute to the advancement of the country's green economy. It represents the largest concurrent announcement of commercial-scale green hydrogen production projects in Europe.
Germany holds a major share of the European green hydrogen industry. In the country, green hydrogen has become a core part of industrial decarbonization. It targets large electrolyzer capacity and infrastructure build-out. High production costs and regulatory uncertainty have challenged commercial rollout. It is leading companies to delay or reconsider projects. Green hydrogen remains more costly than fossil alternatives. It is slowing scale-up despite ambitious goals.
In North America, the market is anticipated to register the highest CAGR during the forecast period. The adoption of clean energy legislation fuels the North America green hydrogen market growth. The U.S. and Canada are gradually expanding their markets. California currently dominates the U.S. market. The state has its ambitious decarbonization goals, including eliminating gas or diesel-powered public transportation by 2040. Air Liquide is constructing 20 MW large-scale PEM electrolyzer project in Canada. The project is utilizing hydropower to create green hydrogen. This initiative, along with other projects in the pipeline, is expected to benefit the Canada green hydrogen market growth.
The U.S. market has strong policy incentives such as the 45V production tax credit. It aims to reduce the costs of clean hydrogen and catalyze deployment. Recent rulings clarify the credit framework. They enable major projects to progress. Many announced projects are expected to miss deadlines for tax credit eligibility. It will push some developers to focus on export markets, such as Europe.
The Asia Pacific green hydrogen market is witnessing strong momentum. Clear hydrogen roadmaps across Asia and rising decarbonization commitments boost the market expansion. Rapid renewable expansion across the region supports regional market growth. Green hydrogen growth is driven by proximity to major industrial demand centers such as steel, chemicals, and refining. Thus, Asia Pacific has become a key global production and consumption hub. Government incentives and public–private partnerships are enabling large-scale deployment of electrolyzer. Export-oriented projects for green ammonia and hydrogen derivatives strengthen regional competitiveness.
China is the world’s largest hydrogen producer and consumer. However, most hydrogen production remains fossil-fuel based. In the country, green hydrogen products holds a very small share (<1%). The government of China aims to expand renewable hydrogen as part of carbon neutrality goals. Such government initiatives will boost the China green hydrogen market in the coming years. The India green hydrogen market is rapidly growing. Initiatives such as the National Green Hydrogen Mission drive the market growth. Also, the growth is driven by production targets aimed at capturing about 10% of global demand by 2030. Such initiatives reflect India’s drive toward export potential and industrial decarbonization. The Japan green hydrogen market is also witnessing rapid growth. It can be attributed to its increasing investments in long-term infrastructure and technological advancements.
Source: Polaris Market Research Analysis
Key Market Players and Competitive Insights
The green hydrogen market is characterized by dynamic competition. Established players leverage their experience and resources. However, emerging startups bring fresh perspectives. They focus on introducing innovations and advanced technologies to the market. Buyers and investors evaluate providers based on electrolyzer efficiency and performance. Delivered hydrogen cost and hydrogen project execution track record are also being considered. Also, they focus on renewable power access, hydrogen certification readiness, and infrastructure integration.
Key Market Players
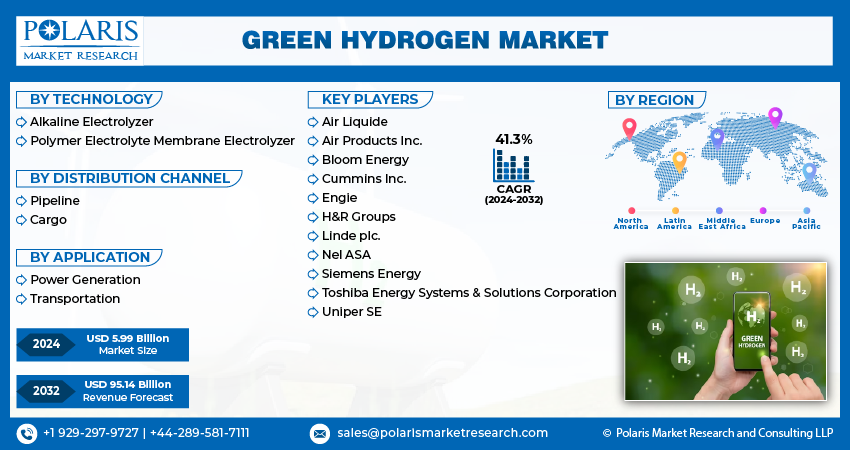
- Air Liquide
- Air Products Inc.
- Bloom Energy
- Cummins Inc.
- Engie
- H&R Groups
- Linde plc.
- Nel ASA
- Siemens Energy
- Toshiba Energy Systems & Solutions Corporation
- Uniper SE
Future of Green Hydrogen Market
The green hydrogen sector is poised to grow rapidly due to the pursuit of carbon-neutral status by nations around the world. The reduction in renewable energy costs and the deployment of many electrolyzers will contribute to economic efficiency. The policy support and financial motivation of governments will accelerate the process of building the infrastructure
Recent Developments
-
April 2026: The Hydrogen Council announced the addition of seven new members. The new members include ANDRITZ, Enagás, HD Korea Shipbuilding & Offshore Engineering, Intelligent Energy, ITM Power, Keppel Infrastructure Division, and Lotte Chemical. The addition signals a shift from ambition to active delivery of projects. (source: hydrogencouncil.com)
-
January 2026: Duke Energy Florida unveiled its DeBary Hydrogen Production Storage System in Volusia County. The company stated that it’s the first U.S. project to integrate end-to-end green hydrogen production, storage, and combustion. (source: duke-energy.com)
- In March 2025, Kandla Port in Gujarat will launch India’s first green hydrogen plant by June 2025, using wind and solar energy to produce clean hydrogen for industries, boosting renewable energy and job creation. (Source: indiatoday.in)
- In February 2025, Air Liquide advanced Europe’s decarbonization with two hydrogen projects the 200 MW ELYgator plant in Rotterdam and a 250 MW venture with TotalEnergies in Zeeland expanding clean hydrogen and reducing major CO₂ emissions. (Source: airliquide.com)
Market Segmentation
By Technology Outlook (Revenue – USD Billion, 2021–2034)
- Alkaline Electrolyzer
- Polymer Electrolyte Membrane (PEM) Electrolyzer
By Distribution Channel Outlook (Revenue – USD Billion, 2021–2034)
- Pipeline
- Cargo
By Application Outlook (Revenue – USD Billion, 2021–2034)
- Power Generation
- Transportation
- Others
By Regional Outlook (Revenue – USD Billion, 2021–2034)
- North America
- U.S.
- Canada
- Europe
- Germany
- UK
- France
- Italy
- Spain
- Russia
- Netherlands
- Rest of Europe
- Asia Pacific
- China
- India
- Japan
- South Korea
- Indonesia
- Malaysia
- Rest of Asia Pacific
- Latin America
- Argentina
- Brazil
- Mexico
- Rest of Latin America
- Middle East & Africa
- UAE
- Saudi Arabia
- Israel
- South Africa
- Rest of Middle East & Africa
Green Hydrogen Market Report Scope
| Report Attributes | Details |
| Market Size in 2025 | USD 8.45 Billion |
| Market Size in 2026 | USD 11.93 Billion |
| Revenue Forecast by 2034 | USD 190.64 Billion |
| CAGR | 41.4% from 2026 to 2034 |
| Base Year | 2025 |
| Historical Data | 2022–2024 |
| Forecast Period | 2026–2034 |
| Quantitative Units | Revenue in USD billion, 2021–2034 and CAGR from 2026 to 2034 |
| Report Coverage | Revenue Forecast, Market Competitive Landscape, Growth Factors, and Trends |
| Segments Covered |
|
| Regional Scope |
|
| Competitive Landscape |
|
| Report Format | PDF + Excel |
| Customization | Report customization as per your requirements with respect to countries, regions, and segmentation. |
Source: Polaris Market Research Analysis
What does the Green Hydrogen Industry Report Offer?
Our research report offers a quantitative and qualitative analysis of the green hydrogen market. The report covers key trends and growth opportunities that will favorably impact the market. Also, the study covers in-depth segmental analysis and regional revenue forecasts for market assessment. All these components will help stakeholders make effective decisions.
FAQ's
The global green hydrogen market is projected to reach USD 190.64 billion by 2034. Decarbonization goals and renewable energy adoption worldwide would drive the market growth.
The difference between green hydrogen vs blue hydrogen lies in production and emissions. Green hydrogen is produced using renewable electricity and electrolysis with near-zero carbon emissions. However, blue hydrogen is produced from natural gas with carbon capture and storage to reduce emissions. Among clean hydrogen types, green hydrogen has the lowest lifecycle emissions. Blue hydrogen, on the other side, has a carbon footprint due to incomplete CO? capture and methane leakage.
Alkaline electrolysis leads with 65.90% market share due to lower costs. However, the PEM electrolyzer witnesses the fastest growth with superior efficiency.
The transportation sector is the major application, followed by the power generation sector.
Europe held the largest revenue share in 2025. Policy innovation and infrastructure development boost the regional market dominance. The North America market is expected to grow at the fastest rate during the forecast period.
Compressed gas form or liquid hydrogen is used for green hydrogen storage. It is transported via pipelines for short distances. For long-distance and international trade, hydrogen transportation relies on LOHC and ammonia carriers.
A few key barriers are high production costs, limited infrastructure, and complex storage.
Green hydrogen incentives and policies help minimize production costs and reduce investment risks. They accelerate infrastructure and technology deployment. The implementation of hydrogen subsidies and policy framework boosts green hydrogen production and adoption.
Download Sample Report of Green Hydrogen Market
Please fill out the form to request a customized copy of the research report.
