
Lake Food Colors Market Size & Share Global Analysis Report, 2023-2032
REPORT DETAILS
REPORT DETAILS
ABOUT THIS REPORT
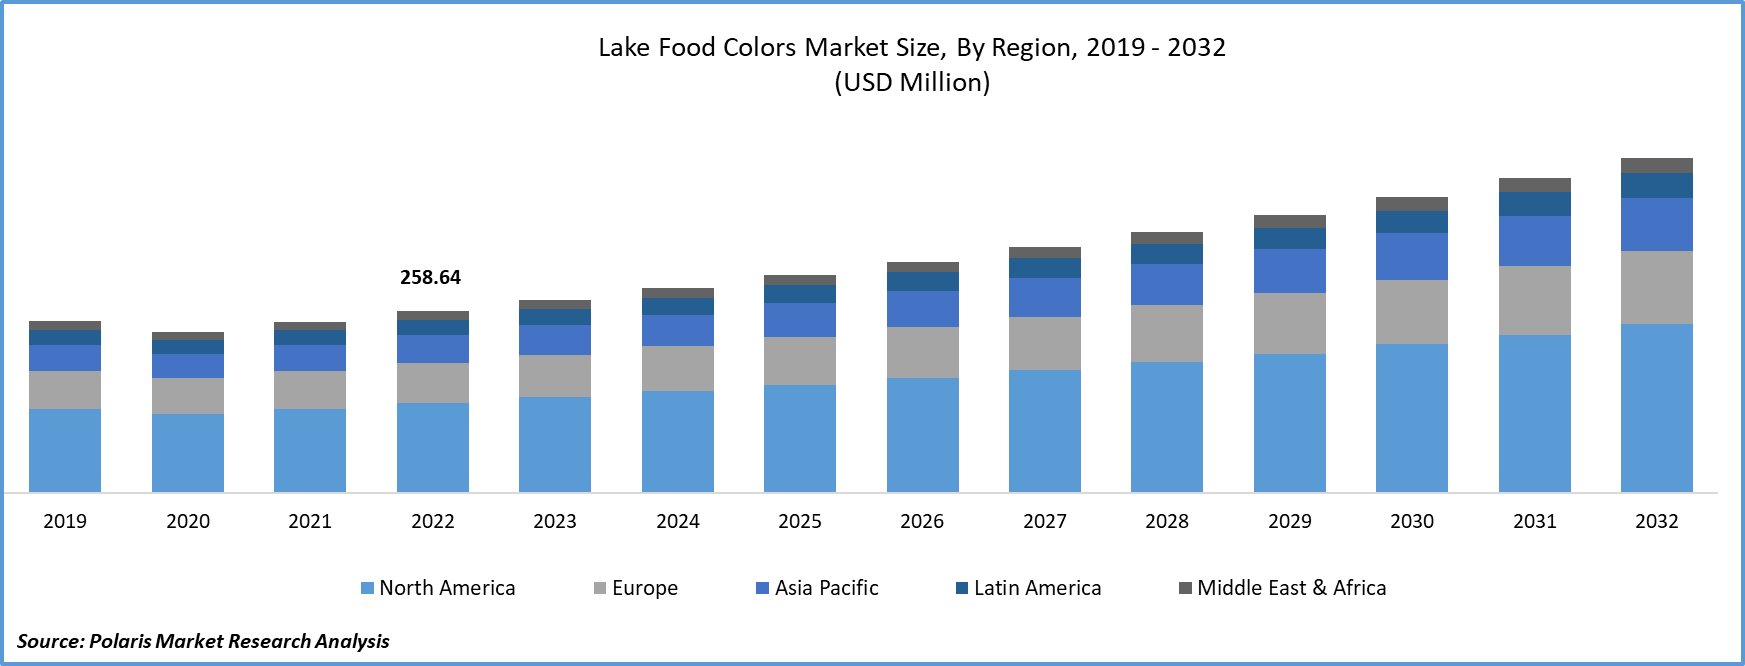
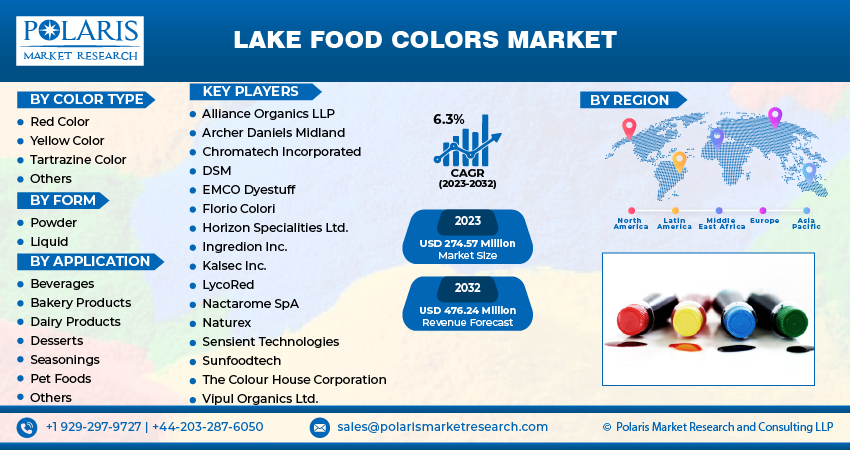
The global lake food colors market was valued at USD 258.64 million in 2022 and is expected to grow at a CAGR of 6.3% during the forecast period.
The drastic shift in consumer eating preferences towards convenience and processed foods that often requires food colors to enhance the visual appeal of such products and continuous growth of bakery & confectionery industry which heavily relies on food colors to create attractive products, is driving the growth of the market. Additionally, its ability to offer higher stability in variety of food & beverage applications because they are less sensitive to pH, temperature, and light, are also among the factors influencing the market growth.
To Understand More About this Research: Download Sample Report
In addition, the surging consumption of various types of beverages including soft drinks, sports drinks, and flavored water, among others and increased number of consumers becoming conscious of their food choices, is further anticipated to boost the need and demand for lake food colors globally.
- For instance, according to a Ministry of Electronic and Information Technology of India, the global consumption of packed beverages in China was amounted to around 269 billion liters in 2022, and the number is projected to reach over 303 billion liters by 2025. And, the global packed beverages consumption stood at approx. 1.4 trillion liters in 2022.
Moreover, the innovations in natural sourcing and extraction methods of lake food colors that have enabled its production from various plant-based sources like fruits, vegetables, and spices, and making them a highly preferred and ideal choice for consumers seeking for food colors without any synthetic additives.
For Specific Research Requirements: Request for Customized Report
However, growing stringent regulations and regulatory measures regarding the use of food colors and high cost associated with the production of lake food colors as compared to synthetic ones, are likely to hamper the demand and growth of the market.
Industry Dynamics
Growth Drivers
-
Increased demand for processed & packaged food and emergence of clean label trends boosting the market growth
The rapid increase in the demand and consumption of processed & packaged food products that significantly uses food colors to enhance their visual appeal and surge in the proliferation for natural and clean label products that are derived from natural sources such as fruits and vegetables, are leading factors propelling the market growth. Additionally, the globalization of food supply chains across the globe has increased the need for consistent and standardized food coloring solutions to meet international quality and safety standards, which in turn, fueling the global lake food colors market growth at extensive pace.
- For instance, according to a report by Invest India, the Indian Food Processing market is projected to grow at annual growth rate of 15.2% and could reach USD 535 billion by 2025.
Clean label trends have led food manufacturers to replace synthetic colors with natural alternatives, including Lake Food Colors, to meet consumer demands for cleaner and more wholesome products. As consumers become more health-conscious, they are looking for food and beverage products that align with their wellness goals. Natural food colors, like those used in Lake Food Colors, are often perceived as healthier and safer than synthetic counterparts. The avoidance of synthetic food colors, which have been associated with health concerns in some studies, is driving the demand for natural and clean label alternatives.
Report Segmentation
The market is primarily segmented based on color type, form, application, and region.
| By Color Type | By Form | By Application | By Region |
|
|
|
|
To Understand the Scope of this Report: Request Customization
By Color Type Analysis
-
Red color segment accounted for the largest market share in 2022
The red food color segment accounted for the largest market share. The growth of the segment market can be largely attributable to significant increase in consumer preferences for brightly colored and visually appealing food & beverage products and huge popularity of red color in different types of food products including candies, baked goods, dairy product, and beverages. Beside this, the rapid development of unique and eye-catching red shades and formulations by key players, that allows companies to easily differentiate their products in this competitive market, has also been creating lucrative growth opportunities and demand for red color segment over the years.
By Form Analysis
-
Powder segment held the significant market share in 2022
The powder segment held the majority market share in terms of revenue in 2022, which is majorly driven by numerous benefits associated with powder-based colors over other types including longer shelf-life, cost-effectiveness, and easy to use, store, and transport. Apart from this, powered food colors are highly versatile and being used in wide array of food & beverage applications including bakery, confectionery, dairy products, and savory snacks, among others.
With the drastic increase in globalization of the food industry, there is an increasing and emerging demand for standardized and consistent food products. Thereby, powdered lake colors that are manufactured to meet strict quality standards for international markets has also been gaining huge traction as a reliable choice for multinational food companies.
By Application Analysis
-
Beverages segment is projected to witness highest growth
The beverages segment is projected to grow at highest growth rate during the course of projected period, on account of steady growth in beverage consumption across the globe and continuous innovations in beverage products, as manufacturers are continually launching new products with innovative formulations, flavors, and colors to attract wider customer base. As urbanization continues to grow all over the world and surge in the number of people adopting busy and hectic lifestyles, the demand for convenient and ready-to-drink beverages is on the rise in the recent years, which in turn, fuels the segment market exponentially.
- For instance, according to UN report, the percentage of urban population in India is projected to reach 43.2% by 2035, with more than 675 million people will be living in cities or urban areas, which will be the second highest just behind China’s 1 billion. Also, the global urban population is likely to increase by another 2.2 billion by 2050.
Regional Insights
-
The demand in North America is expected to witness significant growth
The North America region dominated the global market. The regional market growth can be largely attributed to busy lifestyles of the consumers that fueled the consumption and demand of ready-to-eat and convenience food products along with the continuous growth of e-commerce and online retailing channels that has made it easier for consumer to access various types of food products that includes lake food colors.
Asia Pacific will grow at rapid pace, owing to rising income of middle-class population and constant growth in the food service industry with greater focus on producing visually appealing and convenient food products. Along with this, the robust presence of several large food & beverage manufacturers that widely uses food colors in their products to cater to local tastes and preferences across the region, is further escalating the demand for product at rapid pace.
Key Market Players & Competitive Insights
The lake food colors market is moderately competitive in nature with the robust presence of various global market players. Many leading market players are significantly focusing on business development and expansion strategies including partnerships, collaborations, acquisitions & mergers, and new product launches, to keep their market ahead of the competitors and expand their geographical presence.
Some of the major players operating in the global market include:
- Alliance Organics LLP
- Archer Daniels Midland
- Chromatech Incorporated
- DSM
- EMCO Dyestuff
- Florio Colori
- Horizon Specialities Ltd.
- Ingredion Inc.
- Kalsec Inc.
- LycoRed
- Nactarome SpA
- Naturex
- Sensient Technologies
- Sunfoodtech
- The Colour House Corporation
- Vipul Organics Ltd.
Recent Developments
- In July 2021, Dynemic Products Limited, announced the start of commercial production of food colours plants at their manufacturing unit located at Dahej, Gujarat. With the start o this production plant, company will be aiming to serve its customer in a better way with added capacity.
- In September 2022, Sun Chemical, announced the launch of its SUNFOODS Natural Colorants, meeting the needs for various standard & custom colours that could be applied to wide range of food & beverage products.
Lake Food Colors Market Report Scope
| Report Attributes | Details |
| Market size value in 2023 | USD 274.57 million |
| Revenue forecast in 2032 | USD 476.24 million |
| CAGR | 6.3% from 2023 – 2032 |
| Base year | 2022 |
| Historical data | 2019 – 2021 |
| Forecast period | 2023 – 2032 |
| Quantitative units | Revenue in USD million and CAGR from 2023 to 2032 |
| Segments covered | By Color Type, By Form, By Application, By Region |
| Regional scope | North America, Europe, Asia Pacific, Latin America; Middle East & Africa |
| Customization | Report customization as per your requirements with respect to countries, region and segmentation. |
Download Sample Report of Lake Food Colors Market
Please fill out the form to request a customized copy of the research report.
