
Photoacoustic Imaging Market Demand, Growth, Industry Trends, 2025-2034
REPORT DETAILS
REPORT DETAILS
ABOUT THIS REPORT
Photoacoustic Imaging Market Summary
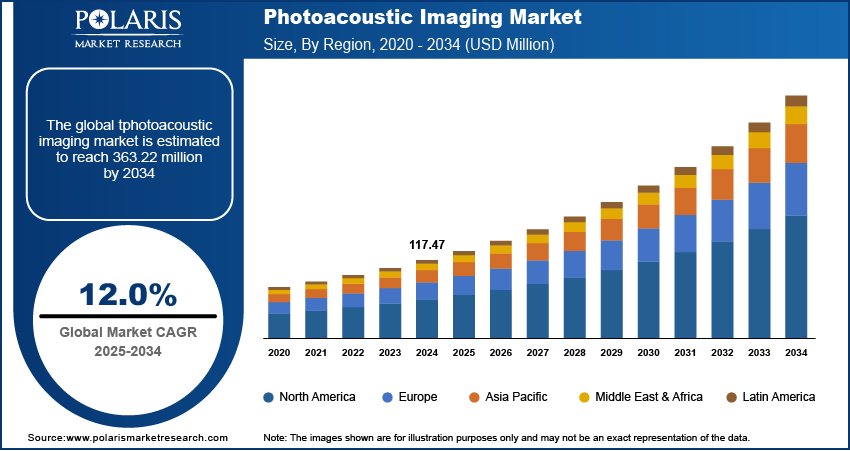
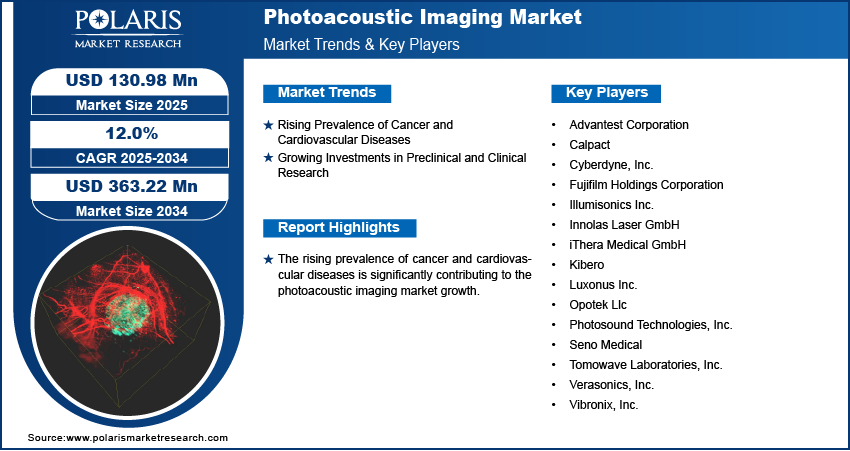
The global photoacoustic imaging market size was valued at USD 117.47 million in 2024, growing at a CAGR of 12.0% during 2025–2034.
Market Statistics
Key Takeaways
- The photoacoustic tomography (PAT) segment accounted for the largest market share in 2024, owing to its excellent imaging depth and high-resolution capabilities.
- The cardiology segment is anticipated to register the highest CAGR, owing to the growing incidence of cardiovascular diseases (CVDs) and the need for advanced imaging technologies.
- North America accounted for the largest market share in 2024, owing to the region’s high healthcare expenditure and strong research infrastructure.
- Asia Pacific is projected to register the highest CAGR, primarily driven by the region’s rising healthcare investments and increased government funding for medical research.
The rising adoption of photoacoustic imaging in brain imaging and skin cancer detection and the shift towards radiation-free imaging techniques are the key factors fueling market growth.
Industry Dynamics
- The rising prevalence of cancer and cardiovascular diseases is fueling the demand for high-resolution imaging solutions and boosting market growth.
- Increased investment in biomedical research and drug development has led to increased need for advanced imaging techniques in therapy monitoring and disease modeling, fueling market expansion.
- The trend of personalized medicine is expected to create several market opportunities in the coming years.
- Shortage of skilled professionals may hinder market growth.
AI Impact on Photoacoustic Imaging Market
- AI-powered algorithms enhance image reconstruction. They produce clearer, high-resolution outputs from complex photoacoustic signals.
- Machine learning enables faster data interpretation, supporting early and more accurate detection of tumors, vascular diseases, and tissue abnormalities.
- AI reduces operator dependency by automating image analysis, making photoacoustic imaging more accessible in clinical settings.
- Continuous integration of AI with hybrid imaging platforms is driving innovation. It is expanding applications in oncology, cardiology, and neurology diagnostics.
To Understand More About this Research: Download Sample Report
Photoacoustic imaging (PAI) is an advanced biomedical imaging method that operates non-invasively. PAI functions by generating ultrasonic waves through pulsed laser irradiation of tissue, followed by reconstructing an image derived from the absorption pattern of light energy within the tissue. The ability of photoacoustic imaging to provide detailed vascular and molecular insights is boosting its adoption in brain imaging and skin cancer detection, thereby fueling photoacoustic imaging market expansion. Advancements in laser technology, increasing biomedical research, and rising demand for noninvasive imaging solutions are key factors shaping the market dynamics.
The rising shift toward safer, radiation-free imaging techniques for real-time visualization is accelerating photoacoustic imaging market demand. Furthermore, increasing Food and Drug Administration and Conformite Europeenne (CE) approvals for clinical photoacoustic imaging devices are driving market demand.
Market Dynamics
Rising Prevalence of Cancer and Cardiovascular Diseases
The rising prevalence of cancer and cardiovascular diseases is significantly contributing to the photoacoustic imaging market growth. In 2022, according to the New York State Behavioral Risk Factor Surveillance System, in New York State, 1.3 million adults (i.e., about 8.2% of people) have cardiovascular disease. As the demand for noninvasive, high-resolution imaging solutions increases for disease detection, the adoption of photoacoustic imaging technology is accelerating. This modality enables precise tumor detection, vascular imaging, and functional tissue characterization, enhancing diagnostic accuracy and early disease intervention. The growing need for real-time, high-contrast imaging is driving investments in research and development. Moreover, with increasing advancements in laser-based imaging and multimodal integration, the market forecast indicates sustained growth. Increasing clinical applications and supportive regulatory approvals are further strengthening the photoacoustic imaging market demand in modern medical diagnostics.
Growing Investments in Preclinical and Clinical Research
Increased funding for biomedical research and drug development is driving demand for advanced imaging techniques in disease modeling and therapy monitoring. For instance, the National Institutes of Health invested nearly USD 48 billion annually in medical research to improve life and reduce illness and disability. Moreover, the ability of photoacoustic imaging to provide high-resolution, real-time visualization of biological tissues is accelerating market expansion across pharmaceutical and research institutions. The photoacoustic imaging market statistics indicate a rising adoption of this technology for studying tumor microenvironments, vascular abnormalities, and treatment responses. The demand for photoacoustic imaging is expected to increase as researchers integrate photoacoustic imaging into precision medicine applications. Rising focus on technological advancements and increasing regulatory approvals for clinical adoption are generating investments in preclinical and clinical research. Thus, growing investments in preclinical and clinical research are expected to create the photoacoustic imaging market opportunities in the coming years.
Segment Insights
Assessment by Product Outlook
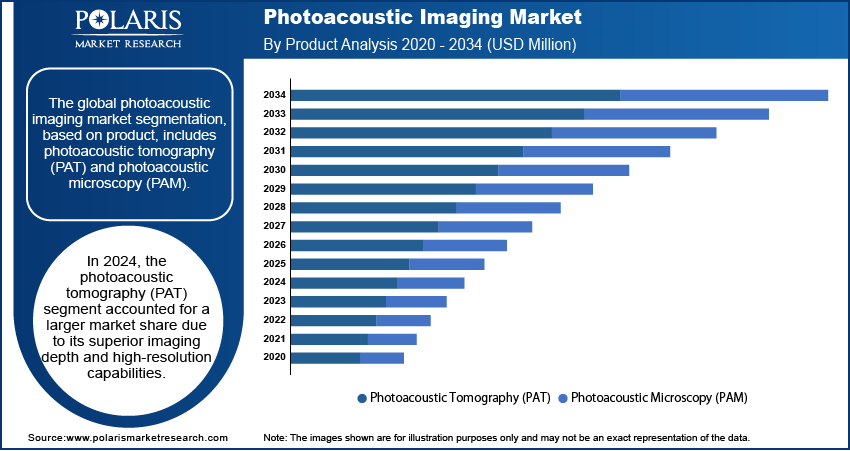
The global photoacoustic imaging market segmentation, based on product, includes photoacoustic tomography (PAT) and photoacoustic microscopy (PAM). In 2024, the photoacoustic tomography (PAT) segment accounted for a larger market share due to its superior imaging depth and high-resolution capabilities, making it indispensable in clinical and preclinical applications. The increasing adoption of PAT in oncology, neurology, and vascular imaging is driving market expansion, as it enables noninvasive visualization of deep tissue structures with functional and molecular contrast. PAT’s integration with ultrasound further enhances its diagnostic potential. The growing emphasis on precision medicine and the rising need for real-time, high-contrast imaging solutions are key factors contributing to photoacoustic tomography dominant market value.
The photoacoustic microscopy (PAM) segment is expected to witness a higher CAGR during the forecast period due to its ability to deliver ultra-high resolution at the cellular and subcellular levels. The rising demand for detailed vascular and microcirculatory imaging, particularly in dermatology, ophthalmology, and neurovascular research, is fueling market growth. The increasing utilization of PAM in drug discovery and histopathological studies is further expanding the demand for PAM. Moreover, continuous advancements in laser technology and miniaturization of imaging systems are enhancing PAM’s accessibility and usability, strengthening its market forecast as a critical tool in biomedical research and diagnostics.
Evaluation by Application Outlook
The global photoacoustic imaging market segmentation, based on application, includes oncology, cardiology, angiology, histology, and interventional radiology. In 2024, the oncology segment accounted for the largest market share due to the rising prevalence of cancer and the urgent need for early, noninvasive tumor detection. Photoacoustic imaging provides superior soft tissue contrast and functional imaging capabilities, enabling real-time monitoring of tumor angiogenesis, hypoxia, and therapy response. The growing investments in cancer research, coupled with the increasing adoption of precision oncology solutions, are driving market expansion. The growing adoption of personalized treatment strategies is creating demand for advanced imaging modalities and enhancing its market value in oncology applications.
The cardiology segment is expected to witness the highest CAGR over the forecast period due to the increasing incidence of cardiovascular diseases (CVDs) and the need for advanced imaging technologies to assess vascular health. Photoacoustic imaging enables high-resolution visualization of atherosclerotic plaques, microvascular changes, and myocardial tissue oxygenation, driving market demand for early diagnosis. Advancements in multimodal imaging integration, such as PAT-ultrasound hybrids, are enhancing diagnostic accuracy and expanding market opportunities. The rising focus on preventive cardiology and the growing adoption of non-ionizing imaging modalities are key factors accelerating the photoacoustic imaging market expansion for the cardiology segment.
Regional Analysis
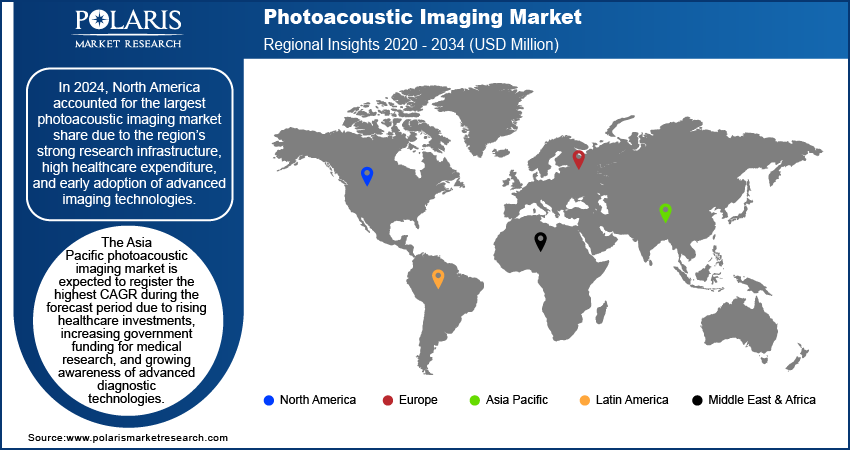
By region, the study provides photoacoustic imaging market insights into North America, Europe, Asia Pacific, Latin America, and the Middle East & Africa. In 2024, North America accounted for the largest photoacoustic imaging market share due to the region’s strong research infrastructure, high healthcare expenditure, and early adoption of advanced imaging technologies. For instance, in 2023, healthcare spending in the US reached $4.9 trillion, growing by 7.5% compared to the previous year. This was higher than the 4.6% growth rate recorded in 2022.. The increasing prevalence of cancer and cardiovascular diseases, coupled with growing investments in biomedical research, is driving market expansion. Leading academic institutions and research centers in the US and Canada are actively integrating photoacoustic imaging for clinical and preclinical applications, further contributing to market growth. Additionally, the presence of key industry players and favorable regulatory frameworks supporting medical imaging innovation strengthen North America’s dominant position in the global market.
The Asia Pacific photoacoustic imaging market is expected to witness the highest CAGR over the forecast period due to rising healthcare investments, increasing government funding for medical research, and growing awareness of advanced diagnostic technologies. For instance, according to the World Health Organization, over 2.3 million people are diagnosed with cancer in Southeast Asia annually, with approximately 1.4 million deaths by cancer in the region. The region’s expanding biotechnology and pharmaceutical sectors, particularly in China, Japan, and India, are accelerating demand for noninvasive, high-resolution imaging solutions. Additionally, the rising burden of cancer and cardiovascular diseases, coupled with an increasing focus on early disease detection and personalized medicine, is driving market growth. Collaborations between research institutes and industry players, along with technological advancements, are further boosting the Asia Pacific market expansion.
Key Players & Competitive Analysis Report
The photoacoustic imaging market is characterized by intense competition, with key players focusing on strategic partnerships, collaborations, and mergers and acquisitions to strengthen their market position. Leading companies are investing in technological advancements to enhance imaging resolution, expand clinical applications, and integrate artificial intelligence for improved diagnostics. Academic and industry collaborations are driving innovation, particularly in preclinical and clinical research. Market participants are also expanding their geographic presence through joint ventures and distribution agreements to capitalize on growing demand in emerging economies. Furthermore, increased funding for biomedical research and precision medicine is prompting companies to develop next-generation imaging platforms, supporting the market’s growth trajectory and competitive intensity.
Fujifilm Corporation is involved in creating, selling, and distributing image, information, and document solutions. The company has established 280 regional management companies at major locations in the US, Europe, China, and Southeast Asia. It was founded in 1934 and is headquartered in Minato-ku, Tokyo. The three divisions through which the company functions are imaging solutions, information solutions, and document solutions. The Imaging solutions business unit deals with electronic imaging, photofinishing equipment, lab services, film processing, color films, color paper, and chemicals. The information solutions cover visual arts, recording media, and medical and life sciences systems. The document solutions division offers printers, office supplies, document creation, and outsourcing services. Fujifilm Corporation is actively engaged in the photoacoustic imaging market, leveraging its expertise in advanced imaging technologies to develop high-resolution, noninvasive diagnostic services for oncology and cardiovascular applications. The company focuses on technological innovation and strategic collaborations to enhance the adoption of photoacoustic imaging in clinical and research settings.
Advantest Corporation, is a major manufacturer of automatic test equipment (ATE) for the semiconductor industry. The company initially began as Takeda Riken Industry Co., Ltd., focusing on electronic measuring instruments before entering the semiconductor testing business in 1972. The company operates through three primary business segments: Semiconductor and Component Test Systems, Mechatronics Systems, and Services, Support, and Others. The semiconductor and component test systems segment includes various test solutions such as SoC test systems, memory test systems, and burn-in test systems. Advantest's global footprint is extensive, with operations in 18 countries and subsidiaries strategically located across North America, Europe, and Asia. Advantest Corporation is a key player in the photoacoustic imaging market, specializing in high-precision diagnostic and analytical imaging solutions.
List of Key Companies
- Advantest Corporation
- Calpact
- Cyberdyne, Inc.
- Fujifilm Holdings Corporation
- Illumisonics Inc.
- Innolas Laser GmbH
- iThera Medical GmbH
- Kibero
- Luxonus Inc.
- Opotek Llc
- Photosound Technologies, Inc.
- Seno Medical
- Tomowave Laboratories, Inc.
- Verasonics, Inc.
- Vibronix, Inc.
Industry Developments
In April 2025, researchers unveiled the Acoustic Loudness Factor (ALF), a novel benchmark metric for small-molecule photoacoustic probes. This parameter allows precise prediction of in-vivo dye performance, streamlining probe development and enhancing diagnostic imaging signal clarity.
In November 2024, Seno Medical received an innovative technology contract from Vizient for its Imagio Breast Imaging System, which combines opto-acoustic and ultrasound imaging to enhance breast cancer diagnostics.
Market Segmentation
By Product Outlook (Revenue – USD Million, 2020–2034)
- Photoacoustic Tomography (PAT)
- Photoacoustic Microscopy (PAM)
By Imaging Type Outlook (Revenue – USD Million, 2020–2034)
- Pre-Clinical
- Clinical
By Application Outlook (Revenue – USD Million, 2020–2034)
- Oncology
- Cardiology
- Angiology
- Histology
- Interventional Radiology
By Regional Outlook (Revenue – USD Million, 2020–2034)
- North America
- US
- Canada
- Europe
- Germany
- France
- UK
- Italy
- Spain
- Netherlands
- Russia
- Rest of Europe
- Asia Pacific
- China
- Japan
- India
- Malaysia
- South Korea
- Indonesia
- Australia
- Vietnam
- Rest of Asia Pacific
- Middle East & Africa
- Saudi Arabia
- UAE
- Israel
- South Africa
- Rest of Middle East & Africa
- Latin America
- Mexico
- Brazil
- Argentina
- Rest of Latin America
Report Scope
| Report Attributes | Details |
| Market Size Value in 2024 | USD 117.47 Million |
| Market Size Value in 2025 | USD 130.98 Million |
| Revenue Forecast in 2034 | USD 363.22 Million |
| CAGR | 12.0% from 2025 to 2034 |
| Base Year | 2024 |
| Historical Data | 2020–2023 |
| Forecast Period | 2025–2034 |
| Quantitative Units | Revenue in USD Million, and CAGR from 2025 to 2034 |
| Report Coverage | Revenue Forecast, Market Competitive Landscape, Growth Factors, and Trends |
| Segments Covered |
|
| Regional Scope |
|
| Competitive Landscape |
|
| Report Format |
|
| Customization | Report customization as per your requirements with respect to countries, regions, and segmentation. |
FAQ's
The global market size was valued at USD 117.47 million in 2024 and is projected to grow to USD 363.22 million by 2034.
The global market is projected to register a CAGR of 12.0% during the forecast period.
In 2024, North America accounted for the largest photoacoustic imaging market share due to the region’s strong research infrastructure, high healthcare expenditure, and early adoption of advanced imaging technologies.
A few of the key players in the market are Advantest Corporation; Calpact; Cyberdyne, Inc.; Fujifilm Holdings Corporation; Illumisonics Inc.; Innolas Laser GmbH; iThera Medical GmbH; Kibero; Luxonus Inc.; Opotek LLC; Photosound Technologies, Inc.; Seno Medical; Tomowave Laboratories, Inc.; Verasonics, Inc.; and Vibronix, Inc.
In 2024, the photoacoustic tomography (PAT) segment accounted for a larger market share due to its superior imaging depth and high-resolution capabilities.
In 2024, the oncology segment accounted for the largest market share due to the rising prevalence of cancer and the urgent need for early, noninvasive tumor detection.
Research Methodology
A robust system of research, verification, and forecasting designed to ensure reliable and actionable market insights.
Polaris Market Research & Consulting, Inc. uses a clear and structured approach to deliver insights that clients can rely on. The process combines detailed primary and secondary research, including direct communication with industry experts. The detailed information helps build a complete picture of market trends and developments. Secondary data is gathered from credible sources such as industry reports, company filings, government source links, and trusted organization databases. It is then cross-checked through discussions with key stakeholders across the value chain. Market size and forecasts are developed using both bottom-up and top-down methods to ensure accuracy and consistency in the final results.
1. Project Setup
Step 1 & 2:
- We start every project by clearly understanding the client’s objective or goal, then defining the market scope, and aligning regions, segments, and timelines.
- Once the foundation is set, we collect data from all-around of sources, including company reports, government databases, and paid industry platforms.
- Our research is based on secondary data, which helps us build a strong understanding of the market across regions and industries. Then we validate this information through primary research by speaking directly with industry experts, companies, and stakeholders.
- By combining secondary and primary research, we ensure that our market insights are accurate, practical, and closely aligned with real market conditions.
2. Data Collection
We gather information from both public and verified sources:
3. Data Structuring
Step 3:
- All collected data is organized into a consistent format to ensure accurate analysis. Since inputs come from multiple sources, they are standardized and aligned before use.
- The data is segmented by product, application, and region, and mapped across a defined historical period (2020–2024). All values are converted into common units (USD Mn/Bn), and volume and pricing are aligned where required to estimate revenue.
- Any overlaps or inconsistencies are reviewed and adjusted to maintain accuracy (<5% variance threshold).
- The result is a structured dataset that allows for clear comparison across regions and supports reliable analysis and forecasting.
Structured Market Dataset, USD Mn/Bn
| Region | Segment | VolumeUnits | Avg PriceUSD | RevenueUSD Mn | Share % |
|---|---|---|---|---|---|
| North America | Product A | 250 | 2.5 | 500 | 15% |
| Product A | XX | XX | XX | XX | |
| Product A | XX | XX | XX | XX | |
| Consistent methodology applied across regions | |||||
4. Market Estimation
Step 4: TOP-DOWN APPROACH
- We start with the overall market size at a global or macro level.
- The market is then narrowed down based on scope and industry relevance.
- We apply penetration rates and split the data by region and segment.
- This helps us estimate the market size for specific segments.
- The numbers are validated through cross-checks to ensure accuracy.
Step 5: BOTTOM-UP APPROACH
- We begin by analyzing data from leading companies in the market.
- Revenue data is collected and mapped across different segments.
- The data is then aggregated to estimate the total market size.
- To fill in any gaps, adjustments are made based on industry standards.
- Validation checks make sure that the results are correct.
5. Forecasting
Step 6:
At Polaris Market Research & Consulting, Inc., we employ a methodical forecasting strategy. This approach blends the analysis of historical data with real-time market validation. To forecast future trends with precision, we examine past patterns, pricing fluctuations, and the interplay of supply and demand. To ensure our conclusions reflect the present market landscape, we actively seek input from industry experts and key stakeholders.
To refine our predictions, we carefully consider critical elements such as market drivers and restraints, fluctuations in raw material costs, emerging technologies, and the production capabilities of various regions. Furthermore, we assess regulatory frameworks and potential policy shifts to gauge their potential impact on market expansion.
All this information is synthesized to generate precise forecasts for each segment and region. These forecasts illuminate the current state of the market and highlight forthcoming opportunities.
6. Validation & Triangulation
Step 7:
In the final stage, we validate all our estimates using a triangulation method, where data is cross-checked from multiple reliable sources, like company data, primary interviews, and secondary research. This helps us make sure that our numbers are correct and fit with the rest of the market.
This process involves verifying data consistency across various segments and geographic areas. It also requires comparing historical trends with the assumptions support the forecast. Any discrepancies involve adjustments to ensure everything remains aligned and dependable.
Once the data is finalized, we prepare the final outputs, including market size estimates, segment-wise breakdowns, and growth metrics. These are delivered in structured formats such as tables, charts, and data files for easy analysis and use.
We collaborate closely with clients, ensuring the final products align with their requirements. This includes offering tailored adjustments, supplementary data analyses, and continuous assistance. Furthermore, we monitor market trends post-delivery, providing updates and refinements to maintain the insights' relevance as time passes.
Triangulation Framework
Estimates are cross-verified across three sources:
Company-level data
• Primary inputs from industry participants
• Secondary benchmarks and published data
Variance maintained within +5-10%
Adjustments applied to align estimates
Segment values validated against overall market structure
Data Consistency & Integrity
Segment totals validated to 100%
Regional estimates aligned with global market size
Historical trends compared against forecast outputs
Assumptions reviewed for cross-segment and regional alignment
Final Outputs
Deliverables
Client Alignment & Support
- Deliverables are aligned with defined client requirements and scope
- Custom data cuts and segment splits are incorporated as required
- Post-delivery queries are addressed through analyst interactions
- Additional clarifications and data support are provided upon request
Client Continuity & Updates
- Market developments are tracked post-delivery to capture changes in key trends
- Updated data and revisions are provided based on new market inputs
- Additional refinements and data cuts are shared as required
- Continued analyst engagement supports evolving client requirements
Download Sample Report of photoacoustic imaging market
Please fill out the form to request a customized copy of the research report.
