
Rare Earth Metal Recycling Market Share, Size, Trends, Industry Analysis Report, 2022 - 2030
REPORT DETAILS
REPORT DETAILS
ABOUT THIS REPORT
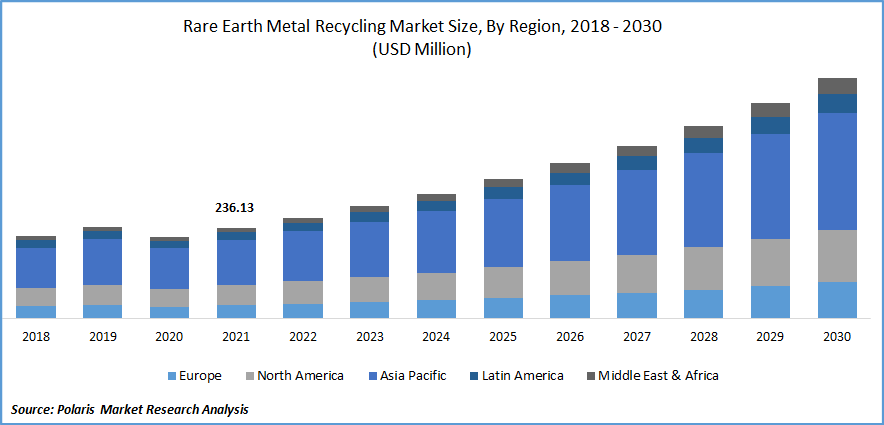
The rare earth metal recycling market was valued at USD 236.13 million in 2021 and is expected to grow at a CAGR of 11.4% during the forecast period.
Rare earth metals are important for emerging technologies in the military, electronics, automotive, and communications industries. These substances are essential to the development of new applications like green technology and electric and hybrid cars, and the demand for these substances is driving the market.
Know more about this report: Download Sample Report
In a wide range of consumer goods, including electronics and automobiles, rare earth elements are essential components. Only a dozen of the almost 200 minerals have high concentrations of RE metals to be economically extractable. Due to their special chemical, magnetic, electrical, and luminescence properties, Rare Earth (RE) metals are essential for advanced technology like computers and MRIs.
 Know more about this report: Download Sample Report
Industry Dynamics
Growth Drivers
The need to develop and use technologies for recycling rare earth elements is being driven by the steps taken worldwide to move to a cleaner and greener environment. The transition to using more of the sun, wind, tidal, and electricity generated naturally is being accelerated. And a variety of technologies that provide cleaner, greener energy employ rare earth elements. The abundant usage of RE for a sustainable environment is expected to drive the growth of the market.
Rare earth metal extraction and mining harm the ecosystem and environment. They are extracted utilizing incredibly energy-intensive procedures that release pollutants into the ground and carbon emissions into the atmosphere. Mercury, barium, lead, chromium, and cadmium are only a few of the metals that are particularly harmful to the health of various ecosystems, including humans. Rare earth extraction can be risky and challenging when these ores contain other radioactive elements like uranium or thorium.
The resources are therefore expected to run out and exhaust as demand and exploitation increase, making the extraction of these elements unprofitable. Recycling is therefore required to satisfy the demand for RE metals. Furthermore, some applications, including florescent lamps and rare earth magnets, contain considerably larger concentrations of rare earth elements and are therefore more cost-effective and recyclable. This drives the growth of the global market.
Governments are emphasizing the green environment; therefore, legislation is banning the use of conventional materials in industries to obtain a sustainable environment. They need to use green technologies like wind turbines, compact fluorescent lighting, and HE vehicles. Wind turbines are now using direct drive permanent magnets which have a major quantity of rare earth metals such as neodymium, europium, praseodymium, dysprosium, and terbium. The need to protect the environment results in the development of clean energy resources like wind energy. Wind turbines and water turbines use permanent magnets, increasing growth opportunities for the market. Direct drive generators for wind turbines need permanent magnets for power output. This shows that the use of permanent magnets is economical and helps the environment to become greener and cleaner. All these factors increase the growth of the global market.
Report Segmentation
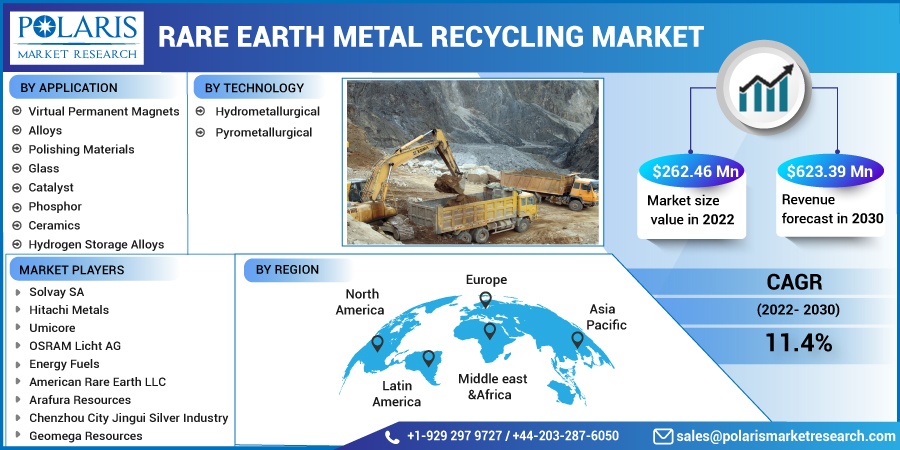
The market is primarily segmented based on application, technology, and region.
| By Application | By Technology | By Region |
|
|
|
Know more about this report: Download Sample Report
Glass segment is expected to dominate the market
The three rare earth elements that are most frequently utilized in glass are erbium, ytterbium, & neodymium. Erbium mixed silica is used for optical communication, ytterbium mixed silica is used in engineering materials, & neodymium-doped glass lasers are utilized for inertial confinement fusion.
In the glass industry, rare earth is utilized as a clarifier, decolorizer, colorant, & polishing powder. It is possible to create optical glass, which may be used to create high-quality lenses for cameras, telescopes, and other high-quality optical instruments, by utilizing the properties of some rare earth elements, such as high refraction and low dispersion. Thus, rare earth metals are utilized in many ways therefore the market is dominating globally. The permanent magnet market is expected to grow at the fastest rate. The permanent magnets are extracted from neodymium, praseodymium, and dysprosium. The wind turbines and automobile sector are the biggest users of permanent magnets.
The hydrometallurgical technology segment is to witness higher CAGR during the forecast period
In hydrometallurgy technology, three steps must be considered to extract rare earth metals. Rare earth component dissolves in acid, occasionally under high pressure and temperature. And then extraction is done using a solvent or using an ionic liquid and ion exchange to separate the various REE into pure and concentrated solutions. And lastly, pure and unique earth metals are produced. This technology recovers rare earth metals from secondary wastes such as spent magnets, batteries, e-wastes, and others.
The pyrometallurgical process extracts 99% of rare earth metals from batteries and magnets. The rare earth metals are obtained from high-temperature treatment which gives 96% of rare earth metals by weight. Hydrometallurgical technology has many advantages as compared to the pyrometallurgical technique. The advantages are a small amount of waste generation, low production costs, and low levels of noxious gases emission. Hydrometallurgical technology gives clean rare earth metals which prevent the degradation of the environment.
Asia Pacific is expected to hold the largest market share
Asia Pacific has experienced enormous growth in recent years due to investment policies, expanding population, expanding economies, and government initiatives to support the electronics and automobile industries. REEs, such as neodymium, yttrium, and terbium, are important materials mostly present in wind turbines, smartphones, and electric vehicles. Today, China produces 80% of rare earth elements. Due to China's rapidly rising demand, which accounts for the majority of rare earth metal consumption worldwide, the area is the greatest user of rare earth elements.
Competitive Insights
Key players in the market include Solvay, Hitachi Metals, Umicore, OSRAM Licht, Energy Fuels, American Rare Earth, Arafura Resources, Jingui Silver Industry, Geomega Resources, Urban Mining, and Mitsubishi Electric.
Recent Developments
In Sept. 2022, Solvay announced intentions to expand its operations, in France to enter the European market & better serve clients in the rapidly expanding markets for electric vehicles, wind power, and electronics.
In Dec. 2021, Umicore & Volkswagen formed a joint venture to develop precursor & cathode material production units, in Europe. This joint venture significantly aided the region's transition to greener mobility.
Rare Earth Metal Recycling Market Report Scope
| Report Attributes | Details |
| Market size value in 2022 | USD 262.46 million |
| Revenue forecast in 2030 | USD 623.39 million |
| CAGR | 11.4% from 2022 - 2030 |
| Base year | 2021 |
| Historical data | 2018 - 2020 |
| Forecast period | 2022 - 2030 |
| Quantitative units | Revenue in USD million and CAGR from 2022 to 2030 |
| Segments covered | By Application, By Technology, By Region |
| Regional scope | North America, Europe, Asia Pacific, Latin America; Middle East & Africa |
| Key companies | Solvay SA, Hitachi Metals, Umicore, OSRAM Licht AG, Energy Fuels, American Rare Earth LLC, Arafura Resources, Chenzhou City Jingui Silver Industry, Geomega Resources, Urban Mining Company, Mitsubishi Electric Corporation |
Research Methodology
A robust system of research, verification, and forecasting designed to ensure reliable and actionable market insights.
Polaris Market Research & Consulting, Inc. uses a clear and structured approach to deliver insights that clients can rely on. The process combines detailed primary and secondary research, including direct communication with industry experts. The detailed information helps build a complete picture of market trends and developments. Secondary data is gathered from credible sources such as industry reports, company filings, government source links, and trusted organization databases. It is then cross-checked through discussions with key stakeholders across the value chain. Market size and forecasts are developed using both bottom-up and top-down methods to ensure accuracy and consistency in the final results.
1. Project Setup
Step 1 & 2:
- We start every project by clearly understanding the client’s objective or goal, then defining the market scope, and aligning regions, segments, and timelines.
- Once the foundation is set, we collect data from all-around of sources, including company reports, government databases, and paid industry platforms.
- Our research is based on secondary data, which helps us build a strong understanding of the market across regions and industries. Then we validate this information through primary research by speaking directly with industry experts, companies, and stakeholders.
- By combining secondary and primary research, we ensure that our market insights are accurate, practical, and closely aligned with real market conditions.
2. Data Collection
We gather information from both public and verified sources:
3. Data Structuring
Step 3:
- All collected data is organized into a consistent format to ensure accurate analysis. Since inputs come from multiple sources, they are standardized and aligned before use.
- The data is segmented by product, application, and region, and mapped across a defined historical period (2020–2024). All values are converted into common units (USD Mn/Bn), and volume and pricing are aligned where required to estimate revenue.
- Any overlaps or inconsistencies are reviewed and adjusted to maintain accuracy (<5% variance threshold).
- The result is a structured dataset that allows for clear comparison across regions and supports reliable analysis and forecasting.
Structured Market Dataset, USD Mn/Bn
| Region | Segment | VolumeUnits | Avg PriceUSD | RevenueUSD Mn | Share % |
|---|---|---|---|---|---|
| North America | Product A | 250 | 2.5 | 500 | 15% |
| Product A | XX | XX | XX | XX | |
| Product A | XX | XX | XX | XX | |
| Consistent methodology applied across regions | |||||
4. Market Estimation
Step 4: TOP-DOWN APPROACH
- We start with the overall market size at a global or macro level.
- The market is then narrowed down based on scope and industry relevance.
- We apply penetration rates and split the data by region and segment.
- This helps us estimate the market size for specific segments.
- The numbers are validated through cross-checks to ensure accuracy.
Step 5: BOTTOM-UP APPROACH
- We begin by analyzing data from leading companies in the market.
- Revenue data is collected and mapped across different segments.
- The data is then aggregated to estimate the total market size.
- To fill in any gaps, adjustments are made based on industry standards.
- Validation checks make sure that the results are correct.
5. Forecasting
Step 6:
At Polaris Market Research & Consulting, Inc., we employ a methodical forecasting strategy. This approach blends the analysis of historical data with real-time market validation. To forecast future trends with precision, we examine past patterns, pricing fluctuations, and the interplay of supply and demand. To ensure our conclusions reflect the present market landscape, we actively seek input from industry experts and key stakeholders.
To refine our predictions, we carefully consider critical elements such as market drivers and restraints, fluctuations in raw material costs, emerging technologies, and the production capabilities of various regions. Furthermore, we assess regulatory frameworks and potential policy shifts to gauge their potential impact on market expansion.
All this information is synthesized to generate precise forecasts for each segment and region. These forecasts illuminate the current state of the market and highlight forthcoming opportunities.
6. Validation & Triangulation
Step 7:
In the final stage, we validate all our estimates using a triangulation method, where data is cross-checked from multiple reliable sources, like company data, primary interviews, and secondary research. This helps us make sure that our numbers are correct and fit with the rest of the market.
This process involves verifying data consistency across various segments and geographic areas. It also requires comparing historical trends with the assumptions support the forecast. Any discrepancies involve adjustments to ensure everything remains aligned and dependable.
Once the data is finalized, we prepare the final outputs, including market size estimates, segment-wise breakdowns, and growth metrics. These are delivered in structured formats such as tables, charts, and data files for easy analysis and use.
We collaborate closely with clients, ensuring the final products align with their requirements. This includes offering tailored adjustments, supplementary data analyses, and continuous assistance. Furthermore, we monitor market trends post-delivery, providing updates and refinements to maintain the insights' relevance as time passes.
Triangulation Framework
Estimates are cross-verified across three sources:
Company-level data
• Primary inputs from industry participants
• Secondary benchmarks and published data
Variance maintained within +5-10%
Adjustments applied to align estimates
Segment values validated against overall market structure
Data Consistency & Integrity
Segment totals validated to 100%
Regional estimates aligned with global market size
Historical trends compared against forecast outputs
Assumptions reviewed for cross-segment and regional alignment
Final Outputs
Deliverables
Client Alignment & Support
- Deliverables are aligned with defined client requirements and scope
- Custom data cuts and segment splits are incorporated as required
- Post-delivery queries are addressed through analyst interactions
- Additional clarifications and data support are provided upon request
Client Continuity & Updates
- Market developments are tracked post-delivery to capture changes in key trends
- Updated data and revisions are provided based on new market inputs
- Additional refinements and data cuts are shared as required
- Continued analyst engagement supports evolving client requirements
Download Sample Report of Rare Earth Metal Recycling Market
Please fill out the form to request a customized copy of the research report.
