
Scrubber System Market Size, Share Global Analysis Report, 2024-2032
REPORT DETAILS
The global scrubber system market was valued at USD 9.06 billion in 2023 and is expected to grow at a CAGR of 4.80% during the forecast period. The growing demand for various types of innovated marine vessels to facilitate sea trade and increasing applications across wide range of end-use industries such as oil & gas, mining & metallurgy, pharmaceutical, among others are some prominent factors driving the market growth. Furthermore, the ability of scrubber systems to efficiently handle inflammable & explosive dust with very low risk are projected to gain huge demand in a wide range of the wet scrubbing, dry scrubbing absorber-in-scrubber, & mercury removal products.
Source: Polaris Market Research Analysis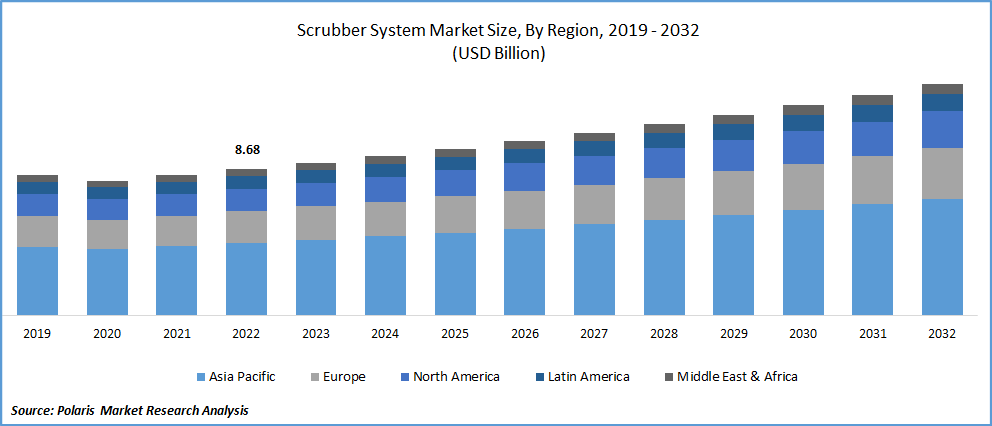
Know more about this report: Download Sample Report
For instance, in November 2021, Wartsila, introduced lighter & smaller IQ Series scrubber, that is designed by its “Exhaust Treatment” business entity located in Moss, Norway. The new IQ series comes with several improvements, which makes it suitable for container vessels and further satisfy the demand for scrubber. It is 30% lighter, take 25% less space and has 35% less volume, that minimizes the impact on vessel’s cargo capacity.
In the last few years, many countries are highly implementing on the improvement of their naval capabilities due to the growing international tensions and maritime conflicts between several nations. Countries are continuously investing on the upgradation of their existing naval fleets or looking to replace the aged fleets with next-generation with innovated features, that is likely to create new growth opportunities for the scrubber system market in the near future.
However, strict regulatory policies imposed by several countries for the disposal of contaminated effluents from scrubber systems and high use of scrubbers might cause environmental degradation through short term value reduction, temperature increase, and material discharge are major factors expected to be hampered the global market.
The outbreak of the COVID-19 pandemic has significantly impacted the growth of the scrubber system market. The rapid spread of deadly coronavirus had severe impact on the trading activities for both international and domestic levels owing to the nationwide lockdowns, strict social distancing measures, and international border seals. Due to this, many companies were close either full or partially, leading to the disruption in the supply demand ration. However, it is expected that the market will witness steady growth as a result of reopening of trade activities.
Industry Dynamics
Growth Drivers
An extensive rise in the international trades through major sea routes and continuously growing number of leisure activities owing to the economical transportation costs and rising global demand for variety of goods and petroleum products are key factors propelling the growth of the global market. Additionally, the growing participation in leisure activities including cruise vacations and international voyage, that results in increased usage of marine ships and in turn fueling the market growth.
Furthermore, various types of air pollution prevention policies and laws enforced by several governments to protect environment are gaining importance globally for reducing the impact of industrial emissions, as these policies and standards promote the use of non-toxic substances, implementing conservation techniques, and modification in the production process which helps to eliminate pollution, thereby influencing the global market growth at significant pace.
Source: Polaris Market Research Analysis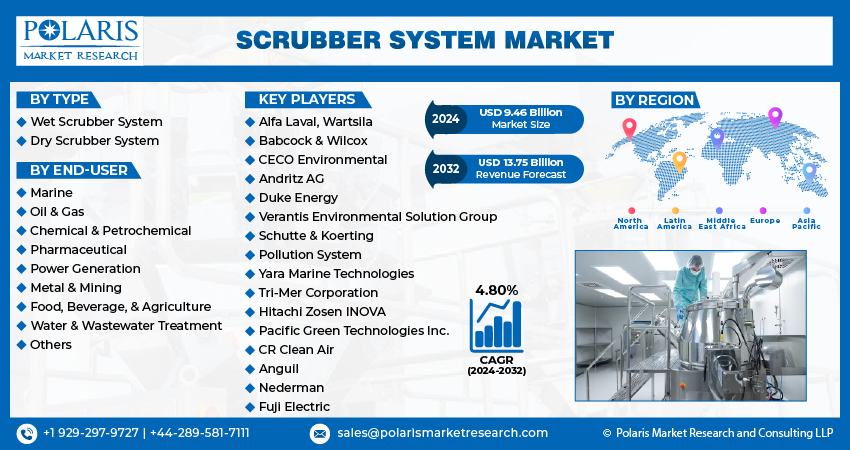
Report Segmentation
The market is primarily segmented based on type, end-user, and region.
| By Type | By End-User | By Region |
|
|
|
Source: Polaris Market Research Analysis
Know more about this report: Download Sample Report
Wet scrubber system segment held the largest market share in 2022
The wet scrubber system segment held the highest market revenue share in 2022, and is expected to maintain its dominance throughout the anticipated period. The continuous rise in the number of coal and gas-fired power plants and several stringent regulations on air pollution control imposed by governments from different countries, as it effectively eliminates particulate harmful gasses and matter form industrial exhausts, is one of the major factors driving the growth of the segment market.
However, the dry scrubber system is expected to account for fastest growth rate during the anticipated period, on account of its wide usage in the process of removing acid gases form combustion sources by reacting dry reactants to the exhaust gases at very high speed. In the recent years, dry scrubber system has embraced widely owing to the positive environmental impact of using it and its ability to prevent numerous pollutants from escaping into the air coupled with the low operational cost and no associated cost with removing or transportation.
Power generation segment accounted for the largest market share in 2022
High dependence of fossil fuels and continuous rise in the demand for energy across both developed and developing regions, are primary factors expected to drive the segment growth. In addition, with the rapidly growing urbanization in developing countries and surge in the number of total consumers has led to significant increase in the demand for electricity and have forced governments across several countries to take proactive steps for ensuring stable power supply, thereby demand for Scrubber System are likely to have positive growth in the coming years.
Furthermore, the marine segment is expected to account for significant market revenue share during the anticipated period, which is mainly driven by its growing usage in variety of chips and vessels to remove contaminants like nitrogen oxide and Sulphur oxide. Moreover, rapidly increasing deployment of naval vessels across the oceans to facilitate the international trade coupled with the rising military expenditure in countries like US and Germany, is further creating lucrative demand and growth for Scrubber System.
Source: Polaris Market Research Analysis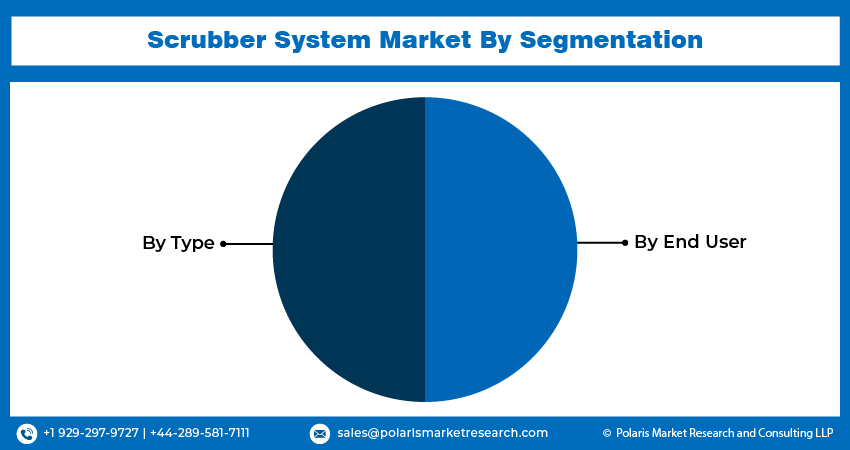
Asia Pacific region dominated the global market in 2022
The growth of the regional market can be attributed to high awareness regarding the several health risks and concerns associated with air pollution along with the rapid growth in the industrialization and urbanization in emerging countries like India and China. China is expected to led the market for scrubber systems in the region due to the growing investments in petrochemical, chemical, and cement sector and factors like ongoing population and increasing government efforts to develop country’s infrastructure.
However, North America is expected to be the fastest growing region throughout the projected period, which is mainly driven by significant progress in the technologies and various environmental regulations and policies introduced by governments like U.S. Clean Air Act by U.S. Environmental Protection Agency and emission reduction strategies by Environment Canada.
Source: Polaris Market Research Analysis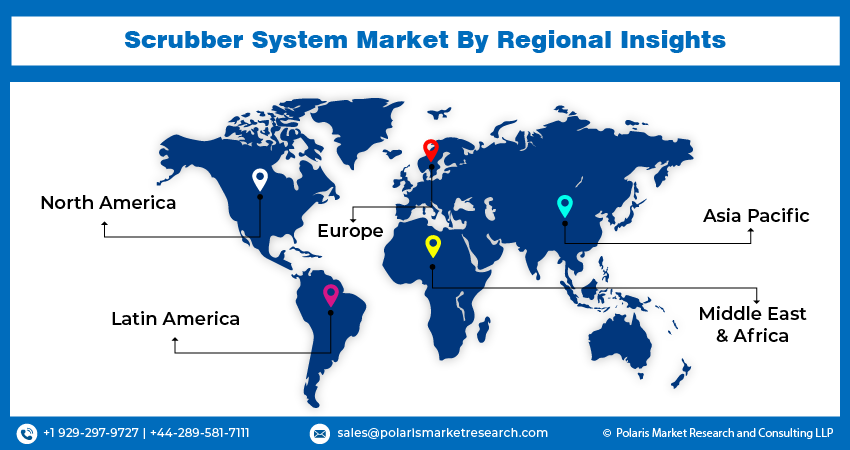
Competitive Insight
Some of the major players operating in the global market include Alfa Laval, Wartsila, Babcock & Wilcox, CECO Environmental, Andritz AG, Duke Energy, Verantis Environmental Solution Group, Schutte & Koerting, Pollution System, Yara Marine Technologies, Tri-Mer Corporation, Hitachi Zosen INOVA, Pacific Green Technologies Inc., CR Clean Air, Anguil, Nederman, and Fuji Electric.
Recent Developments
- In March 2025, i-team Global launched the SAFE-T product family, the world’s first battery-powered cleanroom floor cleaning range. These innovations permit businesses to prevent contamination in critical environments while saving time, cutting costs, and addressing staff shortages. Hoevenaars noted that no other scrubber dryer currently on the market meets the required standards for cleanrooms.
- In March 2023, Wärtsilä delivered its first CCS-ready scrubber systems, engineered to support future carbon capture and storage capabilities.
- In August 2023, Wärtsilä provided carbon capture and storage (CCS) feasibility studies to shipowners and operators, marking another milestone in its efforts to research, develop, and commercialize CCS technologies for the market.
- In March 2022, Alfa Laval, received contract from Evergreen Marine for providing “PureSOx scrubber” for the “Ace Ever”. To efficiently clean the engine exhaust gas the ship has two different scrubbers on the board, one for the auxiliaries & another for engines. It comprises container vessels for around 24,000 TEU capacity, powered by a main engine of 60 W.
- In November 2021, Wartsila announced that it will supply scrubbers for Grimaldi Group owned the Trasmed GLE, on two roll on/roll off passenger ferries. Trasmed has selected the 4 of Wartsila open the loop scrubbers along with the de plume systems for “RoPax” vessels in Volcan del Teide & Ciudad de Granada, operates in the Mediterranean Sea.
Scrubber System Market Report Scope
| Report Attributes | Details |
| Market size value in 2024 | USD 9.46 billion |
| Revenue forecast in 2032 | USD 13.75 billion |
| CAGR | 4.80% from 2024 – 2032 |
| Base year | 2023 |
| Historical data | 2019 – 2022 |
| Forecast period | 2024 – 2032 |
| Quantitative units | Revenue in USD billion and CAGR from 2024 to 2032 |
| Segments covered | By Type, By End-User, By Region |
| Regional scope | North America, Europe, Asia Pacific, Latin America; Middle East & Africa |
| Key companies | Alfa Laval, Wartsila, Babcock & Wilcox, CECO Environmental, Andritz AG, Duke Energy, Verantis Environmental Solution Group, Schutte & Koerting, Pollution System, Yara Marine Technologies, Tri-Mer Corporation, Hitachi Zosen INOVA, Pacific Green Technologies Inc., CR Clean Air, Anguil, Nederman Milropuk, and Fuji Electric. |
Source: Polaris Market Research Analysis
Scrubber System Market FAQ's
The scrubber system market report covering key segments are type, end-user, and region.
Scrubber System Market Size Worth $13.75 Billion By 2032.
The global scrubber system market expected to grow at a CAGR of 4.7% during the forecast period.
Asia Pacific is leading the global market.
Key driving factors in the scrubber system market are government initiatives for maintaining air quality in workspaces.
Download Sample Report of Scrubber System Market
Please fill out the form to request a customized copy of the research report.
