
Tea Beer Market Share, Size, Growth Analysis Report, 2024-2032
REPORT DETAILS
The global tea beer market was valued at USD 2.62 billion in 2023 and is expected to grow at a CAGR of 21.8% during the forecast period.
Tea beer is a type of beer made up of brewed tea and beer ingredients like yeast, hops, water, etc. The presence of the younger generation is one of the primary factors driving the demand for beverages, as they are more inclusive in trying new flavours and textures of different products in their school, college, or office. People barely ever have time for themselves in the rat race we are in to cater to employees’ personal needs. Companies are incorporating parties at their offices or planning events at pubs and clubs at the weekends, which will likely fuel market growth as it creates a wider audience in the coming years. In addition, companies are moving forward with collaboration to make unique products with other market players to meet ongoing consumer demand.
Source: Polaris Market Research Analysis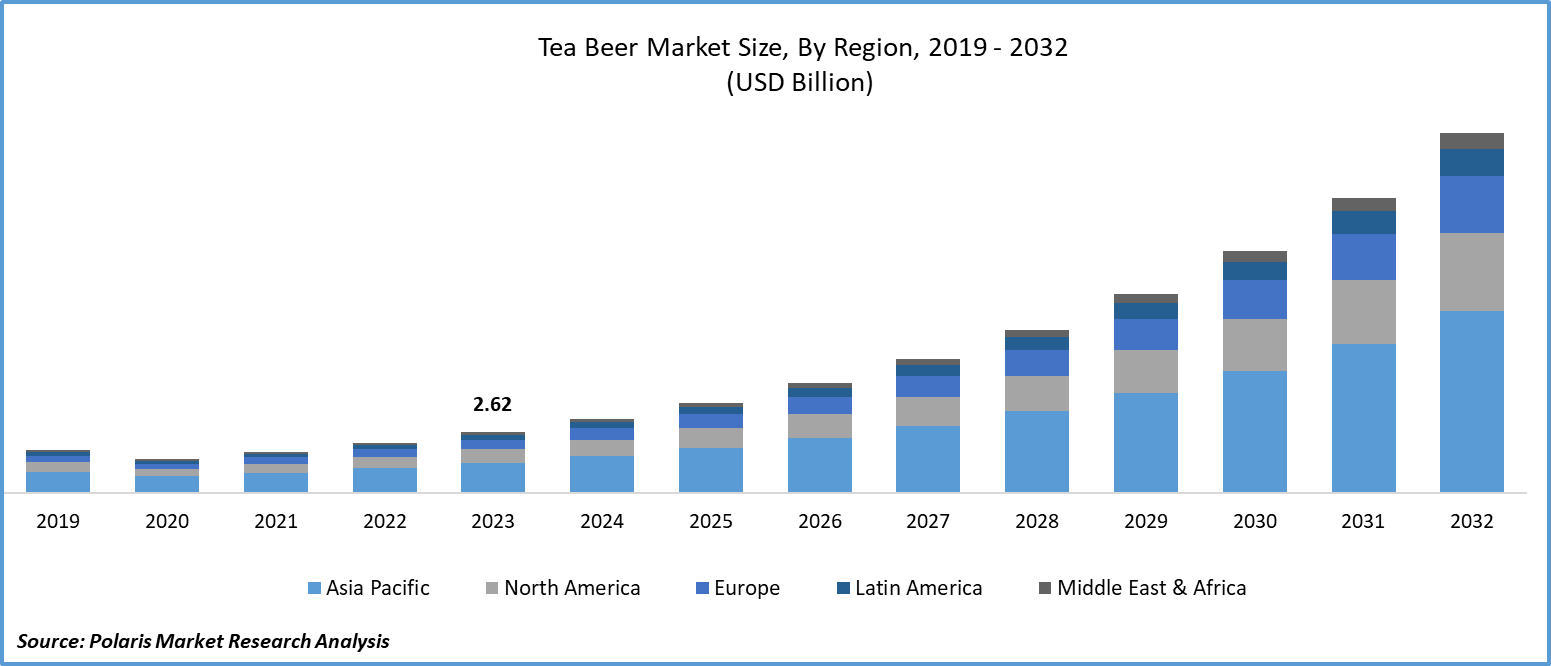
To Understand More About this Research: Download Sample Report
For instance, in April 2023, Turners and Pittsburgh Brewing Company's brand, Iron City, unveiled their latest innovation, "IC’d Tea" for 412 Day after the collaboration. It is a special batch of Iron City Beer that incorporates the flavors of Turner's renowned tea.
Moreover, social media networks are now playing a significant role in determining consumer preferences. Beer lovers and influencers exchange experiences, advice, and reviews, which have a big impact on consumer decisions. In order to foster brand loyalty and create excitement about their products, breweries have realized the power of social media and actively engage with consumers on websites like Instagram, Facebook, and Twitter. Rising internet users are helping companies showcase their effective marketing strategies to their target audience.
However, the lower product awareness among the general population is one of the factors hampering the growth and demand for the tea and beer market. Difficulties in the production and processing of tea beer are impeding manufacturers from entering this business, as the initial process is to brew tea separately and then integrate it with beer manufacturing processes.
Source: Polaris Market Research Analysis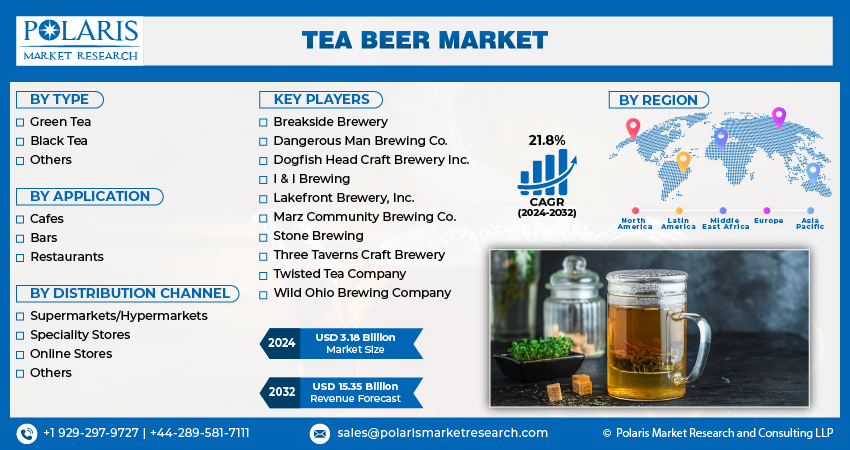
For Specific Research Requirements, Request for a Customized Research Report
Growth Drivers
Increase in the Consumer’s Willingness to Try New Beverages on the Market
Customers are becoming more eager to experiment with new and distinctive flavors of beer. This is driving new opportunities for tea beer in the next few years. Despite appearing to be complete opposites, beer and tea are two of the most popular beverages in the world. However, they share a lot in common. Beer and tea are both brewed with water and can have a variety of flavors added. Healthier solutions are becoming more popular as consumers become more health conscious.
As customers look for lower-calorie, low-alcohol, and gluten-free beer options, this trend has had an impact on the tea beer industry. Breweries have expanded their product lines to include low- or non-alcoholic beers in response to consumer demand for lighter beer varieties. The versatility of tea beer is driving demand for tea beer, as it can be made with low alcohol or high alcohol according to consumer interests.
Report Segmentation
The market is primarily segmented based on type, application, distribution channel, and region.
| By Type | By Application | By Distribution Channel | By Region |
|
|
|
|
Source: Polaris Market Research Analysis
To Understand the Scope of this Report: Request Customization
By Type Analysis
Green Tea Segment is Expected to Witness the Highest Growth During the Forecast Period
The green tea segment is expected to grow at a CAGR during the projected period, primarily driven by its health benefits. The production of high-quality orthodox tea and green tea grew in 2017–18, according to the Tea Board of India. In high-value markets like Iran, Germany, and Japan, these teas are in high demand. The growing prevalence of demand for green tea will further create or expand the tea beer market with a green tea flavour. Manufacturers are stepping forward in incorporating green tea flavour into their product portfolio, attracting consumers with green tea preferences.
The black tea segment led the industry market with a substantial revenue share in 2023, largely attributable to the rising consumer focus on antioxidant beverages. The existence of higher demand for black tea due to its potential health benefits is driving tea beer for people who love black tea and beer, as they are likely to try new combinations.
By Application Analysis
Green Tea Segment is Expected to Witness the Highest Growth During the Forecast Period
The cafe segment accounted for the largest market share in 2023 and is likely to continue its market position in the next few years. Cafes are known to be casual sitting and stress relief places for a wider population, including working professionals. Innovations at this place, like tea beer can fuel market expansion. Growing product diversification by cafe management to serve a variety of drinks to fulfill the needs of consumers with different tastes and preferences This will drive awareness of tea beer among wider consumers.
The bar segment is projected to have the fastest growth rate over the next few years. This is due to the presence of a likely preferred consumer base in one place. Consumers are becoming more interested in trying new products on the market. Tea beer also aligns with the trend, driving its demand in the near future.
By Distribution Channel Analysis
Online Stores Segment Witnessed a Larger Revenue Share
The online stores segment held a significant market share, which is highly fueling due to the availability of a variety of products on the e-commerce platforms. As customers become more informed, they place a high value on items, like beer, that are transparent. They are interested in the origin, production process, and components utilised in their beer. Breweries that can authentically convey their brewing method, ingredients, and brand story are more likely to acquire the trust and loyalty of their customers. Online platforms fulfills this demand, promoting the growth and demand for the tea beer market.
Regional Insights
Asia Pacific Region Held Largest Global Market Share
The Asia Pacific region witnessed the largest market share in the global market and is projected to continue this trend over the projected period. This region is witnessing rapid growth in alcoholic beverages. In India, there has been a rise in the popularity of café and pub culture, which has been greatly inspired by western culture. It's become common to spend the evenings at a pub talking with friends over a beer. According to Bira 91, sales of beer in the summer of 2023 witnessed a higher demand owing to the uptick in temperature in India. With a 2.5 million-hectoliter capacity, India's fourth-largest brewer plans to quadruple production over the next two years. This demonstrates the growth in demand for beverages that will fuel the tea beer market in the coming years.
The Europe region is projected to be the fastest growing region with a higher growth rate during the study period, owing to the rising demand for healthy beverages. According to the FAO’s Intergovernmental Group, there is a growing demand for organic and natural ingredients in tea in Europe. This trend is aligning with tea beer, as it is a highly nutritional and healthy beverage.
Key Market Players & Competitive Insights
The tea beer market is expected to witness higher competition owing to the strict competition in the marketplace. This is, in a way, fueling the technological innovations in the tea beer manufacturing processes. Companies are working towards partnerships, mergers, and acquisitions to expand their businesses and reach a wider audience.
Some of the major players operating in the global market include:
- Breakside Brewery
- Dangerous Man Brewing Co.
- Dogfish Head Craft Brewery Inc.
- I & I Brewing
- Lakefront Brewery, Inc.
- Marz Community Brewing Co.
- Stone Brewing
- Three Taverns Craft Brewery
- Twisted Tea Company
- Wild Ohio Brewing Company
Recent Developments
- In September 2024, Brown-Forman rolled out Jack Daniel’s Country Cocktails Hard Tea nationwide, offering four flavors in variety packs and single-serve cans. The launch meets growing demand for ready-to-drink beverages and features a country music ambassador.
- In September 2022, Bira 91, a premier beer company, and Vahdam India, a wellness brand, collaborated to introduce Chamomile Tea Lager, a tea-based beer. The Chamomile Tea Lager is a crisp, zesty, and delicious beer made with a specific mixture of premium green tea, genuine chamomile, and dried orange peels.
Tea Beer Market Report Scope
| Report Attributes | Details |
| Market size value in 2024 | USD 3.18 billion |
| Revenue forecast in 2032 | USD 15.35 billion |
| CAGR | 21.8% from 2024 – 2032 |
| Base year | 2023 |
| Historical data | 2019 – 2022 |
| Forecast period | 2024 – 2032 |
| Quantitative units | Revenue in USD billion and CAGR from 2024 to 2032 |
| Segments covered | By Type, By Application, By Distribution Channel, By Region |
| Regional scope | North America, Europe, Asia Pacific, Latin America, Middle East & Africa |
| Customization | Report customization as per your requirements with respect to countries, region, and segmentation. |
Source: Polaris Market Research Analysis
Tea Beer Market FAQ's
The global tea beer market size is expected to reach USD 15.35 billion by 2032
Key players in the market are Breakside Brewery, Dangerous Man Brewing, Dogfish Head Craft Brewery
Asia Pacific contribute notably towards the global tea beer market
The global tea beer market is expected to grow at a CAGR of 21.8% during the forecast period.
The tea beer market report covering key segments are type, application, distribution channel and region.
Download Sample Report of Tea Beer Market
Please fill out the form to request a customized copy of the research report.
