
U.S. Non-Automotive Rubber Transmission Belts Market, 2024-2032
REPORT DETAILS
Market Statistics
The U.S. non-automotive rubber transmission belts market size was valued at USD 1,399.2 million in 2023. The market is anticipated to grow from USD 1,418.6 million in 2024 to USD 1,847.7 million by 2032, exhibiting a CAGR of 3.4% during the forecast period
Industry Trends
The United States stands as a pivotal market for non-automotive rubber transmission belts, driven by its diverse industrial landscape and infrastructure projects. With robust sectors spanning automotive, aerospace, and food processing, the demand for transmission belts remains consistently high. Additionally, the agricultural sector heavily relies on transmission belts for various applications, further bolstering market growth.
Technological advancements and a relentless pursuit of energy efficiency propel market expansion in the US, ensuring the industry remains dynamic and responsive to evolving needs. The country's commitment to innovation and sustainability underscores its position as a leader in the global transmission belt market, fostering continuous advancements and driving adoption across diverse industries.
One prominent trend is the increasing demand for durable and high-performance rubber transmission belts across industries such as agriculture, construction, and mining. As these sectors continue to expand, there's a growing need for reliable power transmission solutions to enhance operational efficiency and productivity. Additionally, advancements in rubber compounding technologies have led to the development of belts with superior strength, flexibility, and resistance to wear and tear, further fueling market growth.
Source: Polaris Market Research Analysis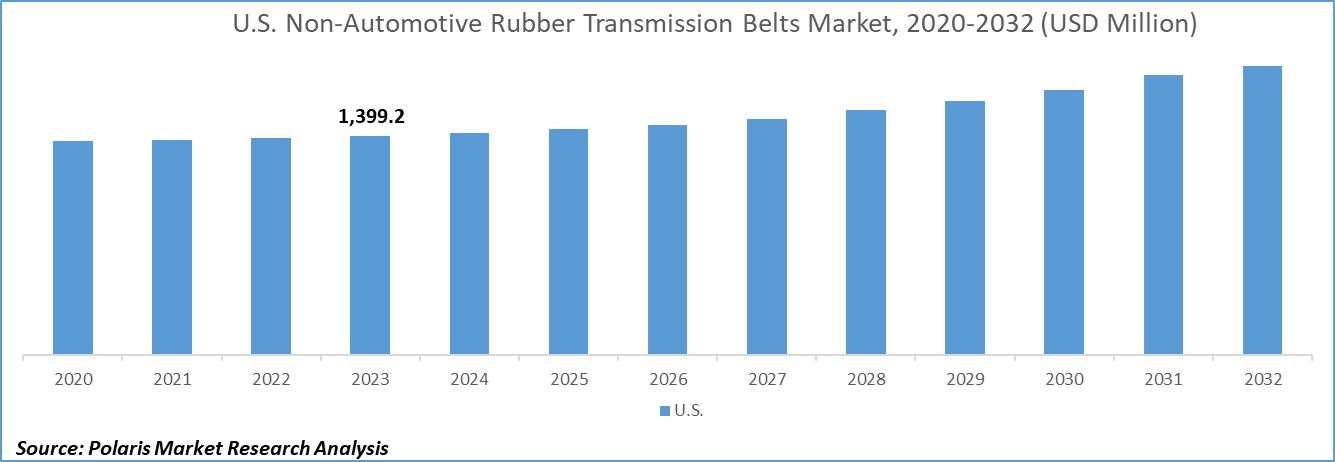
To Understand More About this Research: Download Sample Report
However, the market faces certain restraining factors, such as the volatility in raw material prices, particularly natural rubber and synthetic elastomers. Fluctuations in raw material costs can significantly impact production costs and profit margins for manufacturers, posing challenges in pricing strategies and market competitiveness.
Key Takeaways
- By product category, the v-belts segment is projected to grow with a significant CAGR over the U.S. non-automotive rubber transmission belts market forecast period
- By application category, the industrial segment dominated the U.S. non-automotive rubber transmission belts market size in 2023
What are the market drivers driving the demand for the market?
Enhanced belt performance and durability fuel demand for the U.S. non-automotive rubber transmission belts.
End-users across various industries, such as agriculture, manufacturing, and mining, are increasingly demanding belts that can withstand harsh operating conditions and provide extended service life. Improvements in belt technology have resulted in the development of high-performance materials and designs that offer superior resistance to wear, heat, and abrasion. For example, the introduction of synthetic rubbers, fiber-reinforced composites, and advanced polymer blends has led to the creation of belts with higher tensile strength, flexibility, and durability. This, in turn, reduces maintenance costs, minimizes downtime, and improves the overall efficiency of industrial operations.
Also, advancements in belt construction, such as precision-engineered cogs and grooves, have enhanced flexibility, reduced slippage, and improved power transmission efficiency. As a result, end-users are witnessing improved productivity and reduced operational costs, making the adoption of high-performance and durable non-automotive rubber transmission belts an effective option in the U.S. market.
Which factor is restraining the demand for the market?
Competition from alternatives like chain drives and synchronous belts challenges market growth.
The U.S. non-automotive rubber transmission belts market faces challenges in the form of competition from alternative technologies such as chain drives and synchronous belts. These alternatives offer distinct advantages in specific applications, posing a challenge to the market's growth trajectory. Chain drives are preferred in heavy-duty industrial settings where robustness and precision are paramount, while synchronous belts excel in applications requiring precise timing and synchronization. The availability of these alternatives presents consumers with viable options, potentially diverting demand away from rubber transmission belts.
Also, advancements in alternative technologies, coupled with their competitive pricing and evolving performance characteristics, intensify the challenge for rubber belt manufacturers to maintain market share. Thus, the persistent competition from alternative transmission solutions poses a challenging hindrance to the sustained growth of the U.S. market.
Source: Polaris Market Research Analysis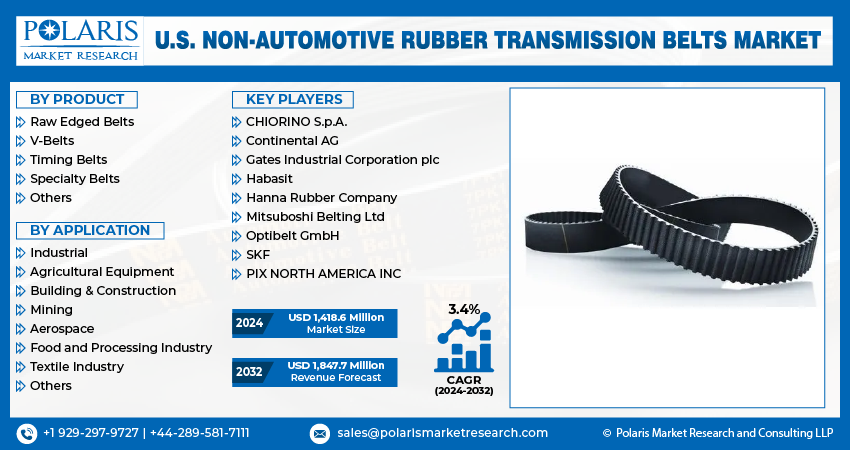
Report Segmentation
The market is primarily segmented based on product and application.
| By Product | By Application |
|
|
Source: Polaris Market Research Analysis
To Understand the Scope of this Report: Request Customization
Category Wise Insights
By Product Insights
Based on product category analysis, the market has been segmented on the basis of raw edged belts, V-belts, timing belts, specialty belts, and others. The v-belts segment is poised for robust growth with a significant CAGR over the forecast period in the U.S. market since v-belts, known for their versatility, efficiency, and cost-effectiveness, find widespread applications across various industries, including agriculture, manufacturing, and construction. Their ability to transmit power efficiently over long distances and operate smoothly in diverse operating conditions makes them indispensable components in machinery and equipment.
Also, advancements in rubber compounding technologies have resulted in v-belts with enhanced durability, strength, and resistance to wear, further bolstering their appeal to end-users. The increasing adoption of v-belts in emerging sectors such as renewable energy and material handling, coupled with growing industrialization and infrastructure development activities in the U.S., is expected to drive substantial demand for v-belts in the non-automotive segment.
By Application Insights
Based on application category analysis, the market has been segmented on the basis of industrial, agricultural equipment, building & construction, mining, aerospace, food and processing industry, textile industry, and others. In 2023, the industrial segment dominated the U.S. non-automotive rubber transmission belts market since industries across various sectors heavily rely on machinery and equipment powered by transmission belts for efficient operations. These belts facilitate the smooth transfer of power, ensuring uninterrupted production processes. Also, the robust growth of industrialization in emerging economies, coupled with the ongoing modernization and automation initiatives in developed nations, has bolstered the demand for durable and high-performance transmission belts. Stringent regulations pertaining to workplace safety and energy efficiency have prompted industries to invest in advanced transmission belt technologies, further driving market growth within the industrial sector. Overall, these dynamics emphasize the industrial segment in shaping the U.S. market.
Source: Polaris Market Research Analysis
Competitive Landscape
The U.S. non-automotive rubber transmission belts market is highly competitive and fragmented, with a large number of domestic and international manufacturers vying for market share. Key players in this market invest heavily in research and development to stay ahead of the competition. These companies offer a wide range of products, including V-belts, synchronous belts, and flat belts, catering to various industrial applications such as agriculture, mining, and manufacturing. While these established companies hold a significant market share, numerous smaller regional players compete by offering specialized products or focusing on specific market segments.
Some of the major players operating in the U.S. market include:
- CHIORINO S.p.A.
- Continental AG
- Gates Industrial Corporation plc
- Habasit
- Hanna Rubber Company
- Mitsuboshi Belting Ltd
- Optibelt GmbH
- SKF
- PIX NORTH AMERICA INC
Recent Developments
- In July 2021, Chiorino SpA acquired Safari Belting Systems, Inc., a US-based company that specializes in producing high-quality modular belts for the food processing industry.
- In December 2020, Advent and The Goodyear Tire & Rubber Company have collaborated to create Goodyear Belts, a line of power transmission belts that cater to the specific demands of various global markets, providing solutions for the industrial sectors.
Report Coverage
The U.S. non-automotive rubber transmission belts market research report provides a better understanding of the product to the users. Also, the report provides market insights into recent developments and trends and analyzes the technologies that are gaining traction around the globe. Furthermore, the report covers an in-depth qualitative analysis pertaining to various paradigm shifts associated with the transformation of these solutions.
The report provides a detailed analysis of the market while focusing on various key aspects such as competitive analysis, product, application, and futuristic growth opportunities.
U.S. Non-Automotive Rubber Transmission Belts Market Report Scope
| Report Attributes | Details |
| Market size value in 2024 | USD 1,418.6 million |
| Revenue Forecast in 2032 | USD 1,847.7 million |
| CAGR | 3.4% from 2024 – 2032 |
| Base year | 2023 |
| Historical data | 2020 – 2022 |
| Forecast period | 2024 – 2032 |
| Quantitative units | Revenue in USD million and CAGR from 2024 to 2032 |
| Segments Covered | By Product, By Application |
| Customization | Report customization as per your requirements with respect to countries, regions, and segmentation. |
Source: Polaris Market Research Analysis
Us Non Automotive Rubber Transmission Belts Market FAQ's
U.S. Non-Automotive Rubber Transmission Belts Market Size Worth USD 1,847.74 Million by 2032
Key players in the market are CHIORINO S.p.A., Continental AG, Gates Industrial Corporation plc, Habasit, Hanna Rubber Company
The U.S. non-automotive rubber transmission belts market exhibiting a CAGR of 3.4% during the forecast period
The U.S. Non-Automotive Rubber Transmission Belts Market report covering key segments are product and application.
Download Sample Report of U.S. Non-Automotive Rubber Transmission Belts Market, 2024-2032
Please fill out the form to request a customized copy of the research report.
