
Wi-Fi as a Service Market Share, Size, Trends, Industry Analysis Report, 2022 - 2030
REPORT DETAILS
REPORT DETAILS
ABOUT THIS REPORT
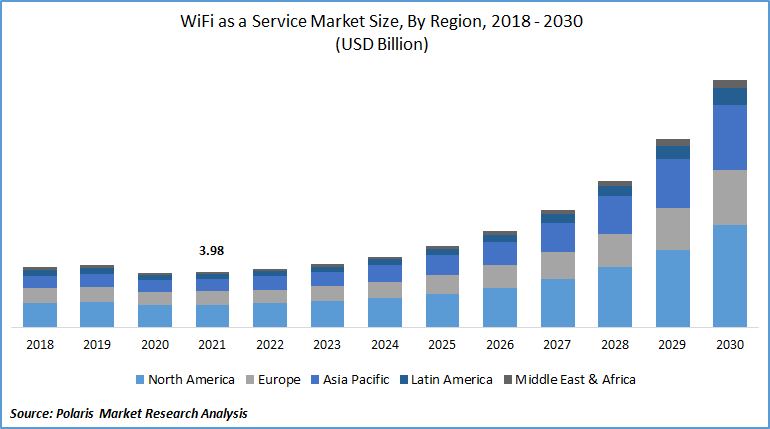
The global Wi-Fi as a service market was valued at USD 3.98 billion in 2021 and is expected to grow at a CAGR of 19.8% during the forecast period. The market demand is being driven by stringent government regulations requiring the deployment in the face of a pandemic, Wi-Fi networks were critical to national resilience. With the growing number of connected devices and people working remotely, there has been a global increase in in-home Wi-Fi activity.
Know more about this report: Download Sample Report
Major corporations are also developing and providing advanced apps and services. For instance, in March 2021, Extreme Networks produced unique and consumable solutions like the Portable Branch Kit. The system lets users connect to emergency remote office sites quickly and securely.
During the COVID-19 pandemic, the company is committed to assisting its global client base. Government agencies use COVID-19 tracking dashboards from IBM Corporation, Covidvisualizer.com, Microsoft, and others. These solutions are used to monitor and control the disease's spread. As a result of the COVID–19 pandemic, manufacturers have begun to consider automation options to reduce human reliance, creating a demand for IoT technology suppliers, which will impact the growth of WaaS networking devices.
However, due to the shelter-in-place orders, internet use in public places such as coffee shops, hotels, and airports has decreased. As the global remote workforce grows, so does the use of Wi-Fi for enterprise connectivity networks, which has harmed the Wi-Fi as a service market. In post-pandemic scenarios, it is expected that the adoption of enterprise-class and high-density Wi-Fi solutions will continue to rise.
Organizations worldwide are eager to implement technologically advanced applications across their verticals to engage customers in new and engaging ways, necessitating the use of high-quality wireless network connectivity, such as Wi-Fi. Additionally, maintaining organizational data privacy and confidentiality is critical for businesses.
Industry Dynamics
Growth Drivers
The rapid adoption of digital solutions has paved the way for Wi-Fi as a service market development. As per the "Mobile Economy 2021" report from the "Global System for Mobile Communications (GSMA)," there will be approximately 5.2 Bn mobile-based subscriptions by 2020. Smartphone users are growing, and the more younger generation can use their cell phones to connect with their peers remotely. Organizations worldwide are eager to implement technologically advanced applications across their verticals.
Additionally, to fully meet an organization's needs, these new applications must be deployed in an agile environment, allowing for rapid and responsive development while maintaining optimal network performance and cost-effectiveness. Also, the convenience of operating Wi-Fi infrastructure via the cloud is moving the WaaS industry forward. WaaS allows businesses to control their wireless fidelity networks from anywhere in the world. The cloud-based centralized administration enables network managers to remotely monitor Wi-Fi infrastructure problems from a distant location via a managed facilities interface, conserving money and time.

Know more about this report: Download Sample Report
Report Segmentation
The market is primarily segmented based on solution, service, organization size, vertical and region.
| By Solution | By Service | By Vertical | By Organization Size | By Region |
|
|
|
|
|
Know more about this report: Download Sample Report
Insight by vertical
The public sector segment is expected to be the most significant revenue contributor based on the vertical segment. The demand for internet connectivity in high-density areas, including malls, education centers, public parks, and parking spaces, is increasing due to the market penetration of innovative consumer electronics such as smartphones, laptops, and tablets, among others.
Furthermore, governments worldwide are increasingly investing in providing free Wi-Fi connectivity in public transportation facilities to ensure traveler safety. With the increasing reliance on IoT-connected devices, the emergence of smart cities in various developed countries is projected to positively impact the W-Fi as a service market growth over the forecast period.
Geographic Overview
In terms of geography, North America had the largest revenue share. Because of the early implementation of progressive technologies and the highly competitive landscape, the Wi-Fi as a service market is growing. In the region, there has been significant investment in wireless technologies. In addition, the rapid adoption of BYOD policies and Wi-Fi-enabled smart devices for increased productivity, employee satisfaction, and cost-effectiveness have aided the region's market growth. Increased adoption of integrated enterprise and business solutions for more flexible and agile business processes and operations is driving market growth in the North American region.
Moreover, Asia Pacific is expected to witness a high CAGR in the global market. Many cities in the region have significant deployments of wireless hotspots. Many government initiatives aim to encourage the use of the internet and smart devices. A large number of businesses are implementing managed Wi-Fi solutions and facilities to provide internet access to their employees and visitors. These factors are helping to drive the market for managed Wi-Fi solutions forward in some categories of communications services.
Setting up challenging targets for high-speed Internet access has much value, especially in the urban areas of emerging areas. For instance, as per the ITU, ASEAN markets could agree on a common broadband goal in significant cities, such as universal residential broadband of 30 Mbps and a mandate that all households in major cities be connected to 100 Mbps broadband facilities by 2025, with the option to upgrade further.
Competitive Insight
Some of the major players operating in the global market include:
- 4ipnet,
- Alcatel-Lucent Enterprise,
- Allied Telesis,
- Arista,
- Aruba – a Hewlett Packard Enterprise Company, C
- ambium Networks,
- CommScope Inc.,
- Cucumber,
- Datto,
- D-Link,
- Edgecore,
- Extreme Networks,
- Huawei Technologies Co.,
- iPass,
- Juniper Networks,
- LANCOM Systems,
- Redway Networks,
- Rogers Communication,
- Ruijie Networks,
- Singtel,
- Superloop,
- Tata Communications,
- Telstra, Ubiquiti,
- Viasat.
Recent Developments:
In May 2025: AT&T agreed to buy most of Lumen’s Mass Markets fiber business for USD 5.75 billion in an all-cash deal, pending final adjustments. The move will boost investment in US connectivity infrastructure, support new middle-class jobs, and speed up high-speed fiber internet access for millions of people.
In May 2025: TP-Link announced its first Tri-Band Six-Stream Omnidirectional BE11000 outdoor access point, the EAP772-Outdoor. With the 6 GHz band enabled by AFC, the device delivers true tri-band coverage and outperforms existing dual-band outdoor access points.
In April 2025: T-Mobile partnered with EQT to acquire fiber-to-the-home provider Lumos. The deal aims to expand fiber networks to millions of users while offering stronger broadband choices, better value, and added customer benefits.
In October 2024: e& launched its Managed Wi-Fi 7 services to support rising business needs. This next-generation wireless solution offers up to four times faster speeds and double the capacity of earlier Wi-Fi versions, improving efficiency and scalability.
In September 2024: Nokia teamed up with RUCKUS Networks, a CommScope company, to develop a new solution for smooth in-building and campus-wide connectivity, tailored to the needs of multiple industry sectors.
Wi-Fi as a Service Market Report Scope
| Report Attributes | Details |
| Market size value in 2021 | USD 3.98 billion |
| Revenue forecast in 2030 | USD 17.78 billion |
| CAGR | 19.8% from 2022 - 2030 |
| Base year | 2021 |
| Historical data | 2018 - 2020 |
| Forecast period | 2022 - 2030 |
| Quantitative units | Revenue in USD billion and CAGR from 2022 to 2030 |
| Segments covered | By Solution, By Service, By Organization Size, By Vertical, By Region |
| Regional scope | North America, Europe, Asia Pacific, Latin America; Middle East & Africa |
| Key companies | 4ipnet, Alcatel-Lucent Enterprise, Allied Telesis, Arista, Aruba – a Hewlett Packard Enterprise Company, Cambium Networks, CommScope Inc., Cucumber, Datto, D-Link, Edgecore, Extreme Networks, Huawei Technologies Co., iPass, Juniper Networks, LANCOM Systems, Redway Networks, Rogers Communication, Ruijie Networks, Singtel, Superloop, Tata Communications, Telstra, Ubiquiti, and Viasat. |
FAQ's
USD 3.98 billion in 2021 to USD 17.78 billion by 2030 at 19.8% CAGR.
Access Points and WLAN Controllers dominate hardware solutions.
Government and public sector for free Wi-Fi in public spaces and smart cities.
North America leads with early BYOD adoption and Wi-Fi-enabled smart devices.
Aruba, Cisco, Extreme Networks, Huawei, CommScope, Juniper Networks, Ubiquiti.
Research Methodology
A robust system of research, verification, and forecasting designed to ensure reliable and actionable market insights.
Polaris Market Research & Consulting, Inc. uses a clear and structured approach to deliver insights that clients can rely on. The process combines detailed primary and secondary research, including direct communication with industry experts. The detailed information helps build a complete picture of market trends and developments. Secondary data is gathered from credible sources such as industry reports, company filings, government source links, and trusted organization databases. It is then cross-checked through discussions with key stakeholders across the value chain. Market size and forecasts are developed using both bottom-up and top-down methods to ensure accuracy and consistency in the final results.
1. Project Setup
Step 1 & 2:
- We start every project by clearly understanding the client’s objective or goal, then defining the market scope, and aligning regions, segments, and timelines.
- Once the foundation is set, we collect data from all-around of sources, including company reports, government databases, and paid industry platforms.
- Our research is based on secondary data, which helps us build a strong understanding of the market across regions and industries. Then we validate this information through primary research by speaking directly with industry experts, companies, and stakeholders.
- By combining secondary and primary research, we ensure that our market insights are accurate, practical, and closely aligned with real market conditions.
2. Data Collection
We gather information from both public and verified sources:
3. Data Structuring
Step 3:
- All collected data is organized into a consistent format to ensure accurate analysis. Since inputs come from multiple sources, they are standardized and aligned before use.
- The data is segmented by product, application, and region, and mapped across a defined historical period (2020–2024). All values are converted into common units (USD Mn/Bn), and volume and pricing are aligned where required to estimate revenue.
- Any overlaps or inconsistencies are reviewed and adjusted to maintain accuracy (<5% variance threshold).
- The result is a structured dataset that allows for clear comparison across regions and supports reliable analysis and forecasting.
Structured Market Dataset, USD Mn/Bn
| Region | Segment | VolumeUnits | Avg PriceUSD | RevenueUSD Mn | Share % |
|---|---|---|---|---|---|
| North America | Product A | 250 | 2.5 | 500 | 15% |
| Product A | XX | XX | XX | XX | |
| Product A | XX | XX | XX | XX | |
| Consistent methodology applied across regions | |||||
4. Market Estimation
Step 4: TOP-DOWN APPROACH
- We start with the overall market size at a global or macro level.
- The market is then narrowed down based on scope and industry relevance.
- We apply penetration rates and split the data by region and segment.
- This helps us estimate the market size for specific segments.
- The numbers are validated through cross-checks to ensure accuracy.
Step 5: BOTTOM-UP APPROACH
- We begin by analyzing data from leading companies in the market.
- Revenue data is collected and mapped across different segments.
- The data is then aggregated to estimate the total market size.
- To fill in any gaps, adjustments are made based on industry standards.
- Validation checks make sure that the results are correct.
5. Forecasting
Step 6:
At Polaris Market Research & Consulting, Inc., we employ a methodical forecasting strategy. This approach blends the analysis of historical data with real-time market validation. To forecast future trends with precision, we examine past patterns, pricing fluctuations, and the interplay of supply and demand. To ensure our conclusions reflect the present market landscape, we actively seek input from industry experts and key stakeholders.
To refine our predictions, we carefully consider critical elements such as market drivers and restraints, fluctuations in raw material costs, emerging technologies, and the production capabilities of various regions. Furthermore, we assess regulatory frameworks and potential policy shifts to gauge their potential impact on market expansion.
All this information is synthesized to generate precise forecasts for each segment and region. These forecasts illuminate the current state of the market and highlight forthcoming opportunities.
6. Validation & Triangulation
Step 7:
In the final stage, we validate all our estimates using a triangulation method, where data is cross-checked from multiple reliable sources, like company data, primary interviews, and secondary research. This helps us make sure that our numbers are correct and fit with the rest of the market.
This process involves verifying data consistency across various segments and geographic areas. It also requires comparing historical trends with the assumptions support the forecast. Any discrepancies involve adjustments to ensure everything remains aligned and dependable.
Once the data is finalized, we prepare the final outputs, including market size estimates, segment-wise breakdowns, and growth metrics. These are delivered in structured formats such as tables, charts, and data files for easy analysis and use.
We collaborate closely with clients, ensuring the final products align with their requirements. This includes offering tailored adjustments, supplementary data analyses, and continuous assistance. Furthermore, we monitor market trends post-delivery, providing updates and refinements to maintain the insights' relevance as time passes.
Triangulation Framework
Estimates are cross-verified across three sources:
Company-level data
• Primary inputs from industry participants
• Secondary benchmarks and published data
Variance maintained within +5-10%
Adjustments applied to align estimates
Segment values validated against overall market structure
Data Consistency & Integrity
Segment totals validated to 100%
Regional estimates aligned with global market size
Historical trends compared against forecast outputs
Assumptions reviewed for cross-segment and regional alignment
Final Outputs
Deliverables
Client Alignment & Support
- Deliverables are aligned with defined client requirements and scope
- Custom data cuts and segment splits are incorporated as required
- Post-delivery queries are addressed through analyst interactions
- Additional clarifications and data support are provided upon request
Client Continuity & Updates
- Market developments are tracked post-delivery to capture changes in key trends
- Updated data and revisions are provided based on new market inputs
- Additional refinements and data cuts are shared as required
- Continued analyst engagement supports evolving client requirements
Download Sample Report of Wi-Fi as a Service Market
Please fill out the form to request a customized copy of the research report.
