
Bunion Correction Systems Market Size, Share Global Analysis Report, 2023-2032
REPORT DETAILS
REPORT DETAILS
ABOUT THIS REPORT
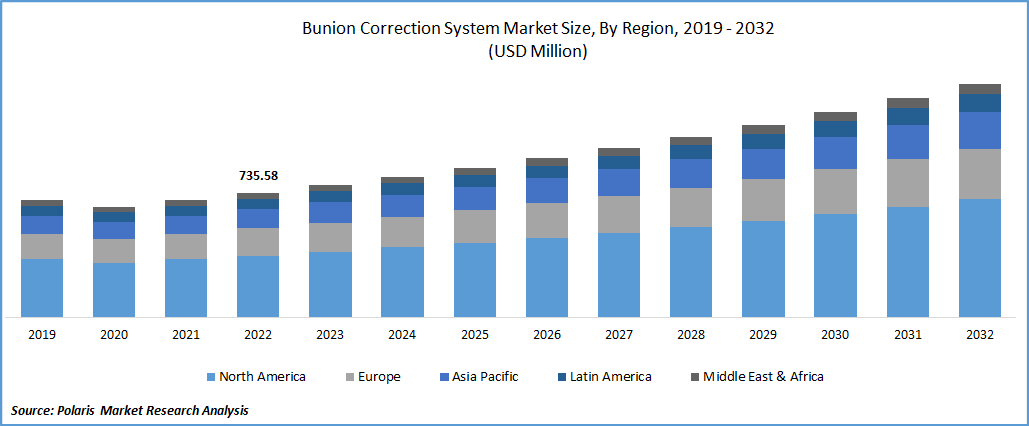
The global bunion correction systems market was valued at USD 735.58 million in 2022 and is expected to grow at a CAGR of 6.5% during the forecast period. The growing availability of various types of surgical and non-surgical procedures to effectively manage numerous conditions like PROstep MIS and the increasing use of bunion pads, orthopedic implants, pain relievers, tapings, physical therapy, and injections are the primary factors driving the growth of the global market at a significant pace. The rapid development of new and innovative systems that have made it easier for physicians to offer effective and minimally invasive treatments, along with the advancements such as 3D printing and improved materials for implants, are also likely to contribute positively towards the market growth in the forecast period. For instance, in September 2021, Treace Medical Concepts introduced a new Adducto-plasty System, which brings together Treace’s implants & precision instrumentation for the realignment, stabilization, & fusion of mid-foot.
To Understand More About this Research: Download Sample Report
Moreover, the increasing desire for fashionable footwear and a large portion of the female population who wear shoes that are too small has contributed to an increase in the incidence of bunions. Thus, the need and demand for improved treatment systems and techniques are gaining traction and growing globally. However, a very large portion of the global population who are affected by these conditions ignore the condition and do not opt for any treatment, and lack of awareness regarding the availability of these techniques in low-income and less-developed countries are key factor hampering the market growth.
The outbreak of the COVID-19 pandemic has significantly impacted the growth of the bunion correction systems market. During the pandemic, many elective surgeries and procedures, including bunion correction procedures, were canceled or postponed to treat COVID-19 patients on priority and to reduce the risk of virus transmission, which declined the demand for these systems. However, as the pandemic started improving, the need for bunion correction systems began to recover well.
For Specific Research Requirements, Request Customization
Industry Dynamics
Growth Drivers
People across the globe are continuously becoming more and more aware of the availability of several types of benefits associated with bunion correction devices. They are using them more frequently in various surgical procedures, which are among the key factors influencing the global market growth. The rapidly increasing demand for these devices due to the rise in the number of people with bunions has led to higher product demand and utilization globally. Furthermore, rapid technological advancements, such as 3D printing and advanced materials for implants, have made these systems more reliable, precise, and effective, resulting in increased adoption by physicians and patients worldwide, which is further anticipated to create huge growth and demand for the bunion correction systems market.
Report Segmentation
The market is primarily segmented based on product, end-use, and region.
| By Product | By End-Use | By Region |
|
|
|
To Understand the Scope of this Report: Request Customization
Wearables segment accounted for the largest market share in 2022
The wearables segment will witness the largest market share in 2022. The rapid increase in the prevalence of bunions across the globe and the wide availability of wearables for various groups, including adult, pediatric, and geriatric populations, are among the major factors driving the demand and growth of the segment market at a rapid pace. Moreover, the growing penetration of wearables to support the joint to prevent mal-positioning and manage or reduce the pain effectively is likely to propel segment market growth.
The implants & accessories segment is projected to grow at the fastest growth rate over the coming years on account of the continuous rise in the number of people undergoing corrective strategies to effectively treat the condition and the introduction of advanced minimally invasive implant techniques that help to treat the source of a bunion. Moreover, the increasing use of various new materials in developing implants & accessories, like biodegradable materials with higher technological advancements, will likely impact the market's growth positively.
Hospitals segment held the significant market revenue share in 2022
The hospital's segment held the majority market revenue share in 2022 with a substantial growth rate, which is mainly driven by a rapid surge in the number of patients globally undergoing these surgeries at the hospitals due to the availability of a wide range of surgery options with the best and highly developed technology such as exostectomy, osteotomy, and arthrodesis coupled with the availability of skilled physicians and staffs at the hospitals. In addition, the rapid increase in healthcare expenditure across both developed and developing nations to develop healthcare infrastructure and offer the best possible treatment to patients is also projected to boost the demand and growth of the segment market in the coming years.
The ambulatory center's segment is expected to exhibit significant growth during the projected period, which is largely attributed to numerous benefits that are associated with these centers, as it offers minimally invasive bunion correction procedures which are less painful, have a faster recovery time, and are associated with very fewer complications. As patients worldwide are constantly looking for less invasive procedures, ambulatory centers' demand for bunion correction systems is increasing drastically.
North America region dominated the global market in 2022
The North American region dominated the global market in 2022 and is expected to maintain its dominance over the projected period. The regional market's growth can be highly attributed to the growing prevalence of the condition across the region and the presence of highly advanced treatment facilities for correcting procedures coupled with the robust fact of major market players like Arthrex, Zimmer Biomet Holdings, and Stryker Corporation.
The Asia Pacific region is projected to be the fastest growing region with a healthy CAGR during the forecast period, owing to the rapidly increasing geriatric population and changing people lifestyles, and improved working population, especially in emerging nations such as China, India, Malaysia, and South Korea. Moreover, the growing government initiatives towards developing healthcare infrastructure and rising investments in R&D activities to innovate more innovative techniques and systems propel the market growth exponentially.
Competitive Insight
Some of the major players operating in the global market:
- Stryker Corporation
- Zimmer Biomet Holdings
- Wright Medical
- Extremity Medical
- Acumed LLC
- CrossRoads Extremity Systems
- Orthofix Holdings
- OrthoHelix Surgical
- De Puy Systems
- Arthrex
- BioPro Inc.
- Aspire Bariatrics
- Medtronic
- Entero Healthcare.
Recent Developments
- In February 2024, Paragon 28, Inc., a prominent participant in the market, introduced the PRECISION MIS Bunion System within the USA. This system enables surgeons in conducting minimally invasive distal metatarsal osteotomy procedures and integrates a free-hand technique to lower the risk of soft tissue irritation postoperative.
- In March 2022, In2Bones Global announced the launch of its new and minimally invasive joint-spring correction technique to easily moderate several bunions with the brand name “CoLink Vallux Active Bunion.” It is a simpler and faster technique that does not violate the joint. With this new technique, surgeons can correct the joint alignment without restricting common space and avoid joint fusion at midfoot.
- In September 2021, Novastep introduced Pecaplasty Instrumented MIS System. This system is specially designed for better precise alignment, accurate stabilization, and reproductive outcomes, which further helps technology reduce the challenges faced while using the technique.
Bunion Correction Systems Market Report Scope
| Report Attributes | Details |
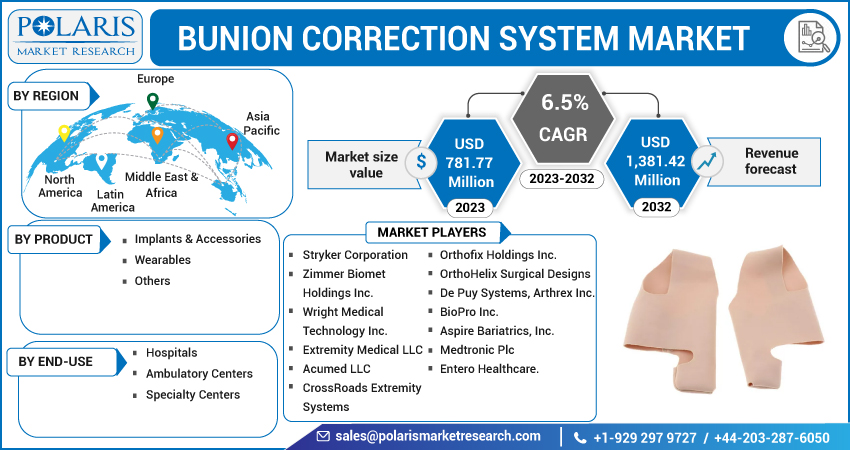
| Market size value in 2023 | USD 781.77 million |
| Revenue forecast in 2032 | USD 1,381.42 million |
| CAGR | 6.5% from 2023– 2032 |
| Base year | 2022 |
| Historical data | 2019– 2021 |
| Forecast period | 2023 – 2032 |
| Quantitative units | Revenue in USD million and CAGR from 2023 to 2032 |
| Segments covered | By Product, By End-Use, By Region |
| Regional scope | North America, Europe, Asia Pacific, Latin America; Middle East & Africa |
| Key companies | Stryker Corporation, Zimmer Biomet Holdings Inc., Wright Medical Technology Inc., Extremity Medical LLC, Acumed LLC, CrossRoads Extremity Systems, Orthofix Holdings Inc., OrthoHelix Surgical Designs, De Puy Systems, Arthrex Inc., BioPro Inc., Aspire Bariatrics, Inc., Medtronic Plc, and Entero Healthcare. |
FAQ's
The bunion correction systems market report covering key segments are product, end-use, and region.
Bunion Correction Systems Market Size Worth $1,381.42 Million By 2032.
The global bunion correction systems market expected to grow at a CAGR of 6.5% during the forecast period.
North America is leading the global market.
key driving factors in bunion correction systems market are availability of wide variety of various surgical and nonsurgical techniques.
Download Sample Report of Bunion Correction Systems Market
Please fill out the form to request a customized copy of the research report.
