
Cross-Border Payments Market Size, Share, and Forecast 2026 to 2034
REPORT DETAILS
Cross-Border Payments Market Summary
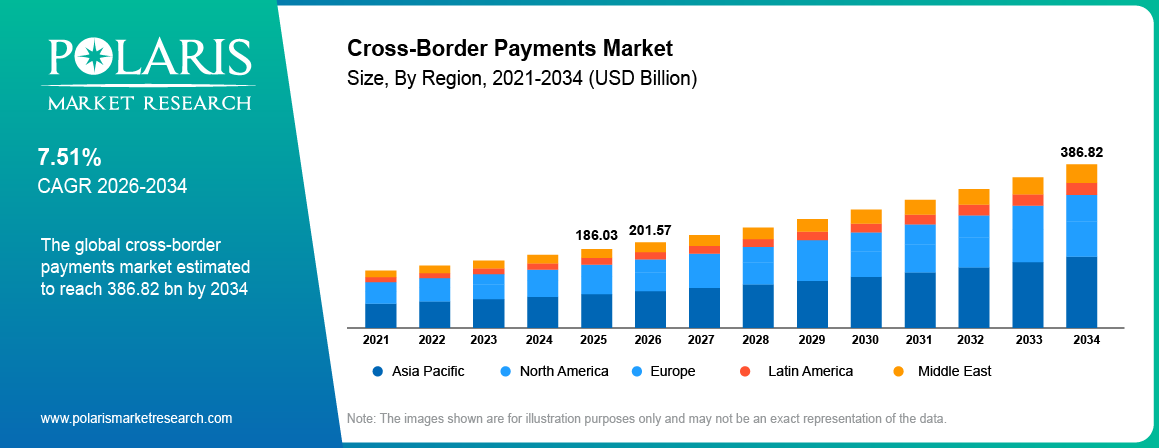
Cross-Border Payments market size was valued at USD 186.03 billion in 2025. The market is expected to grow at a CAGR of 7.51% from 2026 to 2034. Growth is driven by G20 targets for faster and cheaper payments, the rise of digital-first payment platforms, and links between domestic instant payment systems.
Market Statistics
Cross-Border Payments Market Key Takeaways
- North America accounted for approximately 28.16% in 2025. The share is driven by strong digital payment infrastructure.
- Asia Pacific is projected to grow at 9.24% CAGR through 2034. Growth is driven by international trade, digital commerce, and remittance activity.
- B2B payments accounted for approximately 68.42% in 2025. The share is driven by international trade and supplier payments in the international payments market.
- Digital payment providers comprised approximately 15.38% in 2025. The share is driven by APIs and multi-currency accounts.
- Payment interoperability is projected to expand through 2034. Growth is driven by links between national real-time payment systems.
Note: Figures and projections outlined in this report are the result of Polaris Market Research’s proprietary analytical processes, grounded in the latest available datasets and market observations.
Cross-Border Payments Market Definition
Cross-border payments are services, platforms, networks and infrastructure to transfer monetary value between entities located in different countries or currency jurisdictions. The market encompasses bank transfers, card payments, money transfer services, digital wallets, payment platforms, correspondent banking arrangements and network-based payouts. Cross-border transactions can facilitate businesses, financial institutions, marketplaces and individuals across international payment corridors.
Correspondent banking is still an important solution for international account-to-account transfers. To move funds between jurisdictions, banks use correspondent relationships, nostro and vostro accounts, liquidity arrangements, compliance processes and settlement workflows. It offers wide geographical reach but may involve several intermediaries, higher fees, longer processing times and complex reconciliation requirements.
This market also includes digital payment systems that link local banks, card networks, wallets, clearing facilities, and direct payments via APIs. These solutions can route transactions according to destination, currency, transaction value, processing speed, regulatory requirements, and available payment rails. Multi-currency accounts, local receiving accounts, automated reconciliation, payment tracking, and API-based connectivity are increasingly integrated into international payment solutions.
The growth of the market is linked with the modernization of payment infrastructure and increased adoption in supplier payments, international payroll, marketplace payouts, e-commerce collections, subscriptions, remittances, education, travel and intercompany transfers. This expansion is strengthening global cross-border payments across individual payment corridors, with providers integrating banks, card schemes, fintech platforms, instant payment systems, and payout networks. Partior and LSEG DiSH are developing a 24/7 settlement solution to improve liquidity management and enable faster cross-border payments, expected September 2026 (Source: prnewswire.com).
Market Dynamics
Driver Impact Analysis
| Factor | Type | Impact on growth | Timeline | Key evidence |
| G20 cost, speed, and transparency targets | Driver | High | 2026–2030 | Retail cost target of 1% by end-2027; remittance target of 3% by 2030 |
| Digital-first platform adoption | Driver | High | 2026–2034 | Wise cross-border volume rose 31% to USD 243.5 billion in FY26 |
| Linked domestic instant payment rails | Opportunity | High | 2026–2030 | Citi, Swift, and FedNow cross-border launches in 2026 |
| B2B workflow and reconciliation services | Opportunity | Medium | 2027–2034 | Wise Business volume grew 35% YoY in Q4 FY26 |
| Stablecoin and tokenized settlement | Emerging driver | Medium | 2028–2034 | Visa–Lloyds pilot settled funds in under an hour, including weekends |
Source: Polaris Market Research Analysis; FSB; Wise plc; World Bank; company press releases
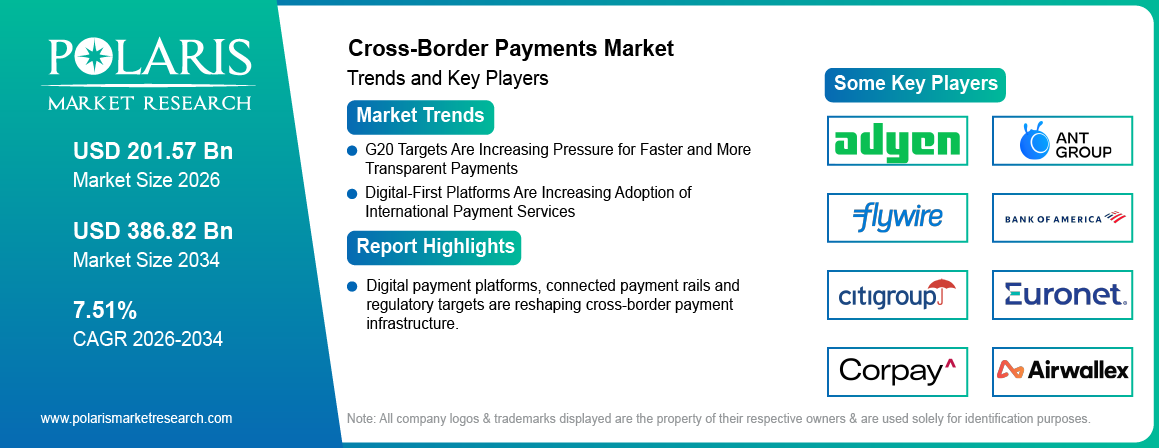
Driver: G20 Targets Are Increasing Pressure for Faster and More Transparent Payments
The G20 cross-border payments framework is increasing pressure on payment providers to improve cost, speed, transparency, and access. For example, G20 has set targets for retail payment costs of up to 1% globally and 3% per corridor by 2027 and remittance costs of 3% globally and 5% per corridor by 2030. These targets are driving demand for global cross border payments solutions that reduce the cost of intermediaries, improve visibility on transactions and give a clearer status on delivery. Corporate treasury teams also are comparing providers in terms of FX rates, processing time, reconciliation data, return handling, and availability of service. Providers that publish fees upfront and track payments end to end are better placed to win business (Source: swift.com).
Driver: Digital-First Platforms Are Increasing Adoption of International Payment Services
Digital-first payment platforms are driving adoption through transparent pricing, faster payments, simplified onboarding and multi currency accounts. According to Wise plc, cross-border volume rose 31% to USD 243.5 billion in FY26, while active customers increased 21% to 18.9 million. Multi-currency balances, local receiving details, APIs, mobile apps, and automated reconciliation are attracting SMEs, marketplace sellers, remote employees, software companies, and global service businesses. Banks and payment networks are also building out international services through APIs, treasury platforms, card products and payout solutions. This environment is increasing competition among banks, payment networks, fintech companies, processors, and money transfer operators (Source: g-co.agency).
Restraint: Regulatory Fragmentation and Liquidity Requirements Increase Operating Complexity
Providers of cross-border payments have to deal with varying licensing rules, AML requirements, sanctions screening processes, data standards, settlement arrangements and currency liquidity requirements between jurisdictions. Some corridors are less liquid and may require local banks, agents, payment partners or payout networks, which can increase costs and reduce control over processing. Payment exceptions may also occur due to variations in beneficiary names, addresses, account identifiers, purpose codes, tax information and other transaction data. ISO 20022 may improve the structure and quality of the information carried on a payment but local regulatory and operational requirements still drive the need for separate processes. These differences raise compliance, technology, operational and liquidity requirements for providers wanting to expand into multiple international corridors.
Opportunity: Connecting Domestic Instant Payment Rails Can Improve International Payout Speed
Connecting domestic instant payment systems can accelerate cross-border payouts without creating a single global settlement network. In 2025 Mastercard and Corpay expanded their near-real-time payout capabilities to 22 additional markets. Providers can connect real time payments infrastructure to local clearing systems and APIs. This supports payroll, marketplace payouts, insurance payments, travel refunds, creator payments and SME transactions. The model also allows regional financial institutions to expand their global footprint through network partners. Greater interoperability between domestic payment systems can thus support faster payout services and grow the addressable market for cross-border payment platforms (Source: mastercard.com).
Opportunity: B2B Payment Platforms Can Expand Through Workflow and Reconciliation Services
B2B payment platforms can provide additional value by combining international payments with invoice matching, approval workflows, beneficiary validation, FX controls, payment tracking, ERP integration and multi-entity reporting. SMEs and large companies are increasingly looking for solutions to simplify international supplier payments, currency management, compliance processes and reconciliation. Local receiving accounts, batch payments, transparent pricing and accounting integration can reduce manual administrative work. Providers can also embed international payments in logistics, education, travel, gaming, software, marketplace, and contractor workflows. This opens up opportunities for payment platforms to go beyond processing transactions and make money from integrated payment, treasury, software and workflow services.
Cross-Border Payments Market Segmentation Analysis
The report provides a comprehensive analysis of the cross border payment industry by transaction type, channel, enterprise size, end user, and region to identify key revenue-generating and high-growth segments.
Transaction Type Insights
B2B Payments held 68.42% share in 2025, the leading transaction type in cross-border payments market. Companies use international payment services to pay supplier invoices, pay for imports and exports, transfer funds between related entities, pay employees and contractors, and fulfill marketplace transactions. Greater transaction values drive the need for payment APIs, treasury controls, reconciliation tools, multi-currency accounts, beneficiary validation and payment tracking. Large organizations also need a central view of payments and integration with ERP and accounting systems. Demand for B2B cross-border payment infrastructure is supported by continued expansion of international supply chains, global service delivery, and digital marketplaces.
The C2C payments are anticipated to record a 8.44% CAGR from 2026 to 2034, driven by international remittances and the growing acceptance of digital money transfer services. International transfer platforms are used by migrant workers and other consumers to send money to family members and other persons abroad. Providers compete on the cost of transfers, FX transparency, speed of processing, availability of payouts, digital convenience and access to bank accounts or wallets. Mobile onboarding and digital payout infrastructure can help improve access for customers across international corridors. C2C cross-border payment services can grow with more migration, remittance activity, mobile financial services and the adoption of digital payments.
B2C payments accounted for 12.84% share in 2025, supported by international business-to-consumer payouts. This transaction type includes refunds, insurance payments, marketplace disbursements, payroll-related transfers, customer incentives and other consumer-facing payments. Businesses need a reliable payout infrastructure that connects international payment services to local bank accounts, cards and digital wallets. Key operational needs are beneficiary verification, transaction tracking, payment speed, transparency and returns handling. International digital commerce and marketplace activity is growing, and that growth can be a driver of demand for scalable B2C payout infrastructure, especially when businesses need to pay out to customers in multiple countries and currencies.
C2B payments accounted for 15.36% share in 2025, supported by cross-border e-commerce, travel bookings, tuition, subscriptions, and other payments from individuals to overseas businesses. Merchants need local payment methods, multi-currency pricing, card acceptance, and fast settlement to convert international buyers. Education and travel providers also need payer identification and reconciliation for each transaction. Growth in cross-border commerce and wider digital wallet adoption is expected to support demand for C2B collection services.
Channel insights
In 2025, bank transfers represented 41.86% of all cross-border payments, making them the most popular channel in the market. Bank transfers are still the most preferred method for international business payments due to the established banking relationships, corporate treasury processes and access to domestic clearing systems. Companies want reliable routing, beneficiary validation, transaction visibility, transparent fees, and integration with treasury and accounting systems. There is also increasing demand for connections between traditional bank infrastructure and domestic instant payment schemes. Banks are still providing correspondent banking and transaction banking services but are embedding APIs and digital interfaces to enhance the customer experience.
Digital/other payment platforms are expected to register the highest CAGR of 10.24% during 2026–2034, driven by API-based payment services, multi-currency accounts, digital wallets, local payment connections, and payment orchestration. These platforms can connect bank accounts, cards, wallets, clearing systems and payout networks via a single technology layer. Customers can use such services to enhance payment speed, transaction visibility, FX management and reconciliation. There is increasing competition on corridor coverage, pricing, payout options, onboarding and integration capabilities. Growing digital commerce and demand for embedded financial services may further increase the adoption of digital cross-border payment platforms.
Card payments accounted for 25.14% share in 2025. This was driven by international consumer spending, travel spending, online purchases, subscriptions and merchant payments. Cross border card payments need acceptance by the card network, authorization infrastructure, currency conversion, fraud controls and merchant settlement capabilities. Providers compete on transaction security, geographic acceptance, pricing transparency and multi-currency transaction processing. International e-commerce and travel-related spending can keep demand for card-based payment infrastructure alive. Card networks also continue to be integral components of wider payments ecosystems that link merchants, consumers, banks and international payments service providers.
Money transfer operators held 17.62% share in 2025, supported by remittance corridors, agent networks, and expanding digital channels. These providers combine bank, wallet, card, and cash payouts across consumer corridors. According to the World Bank, the International MTO Index averaged 5.52% in Q3 2025, compared with 14.99% for banks. Lower costs, wider payout choice, and digital onboarding are expected to support money transfer operator demand (Source: worldbank.org).
Enterprise Size Insights
In 2025, large enterprises accounted for the largest share of the market, with 63.54% share, due to their high transaction volumes and complex cross-border payment needs. Such organizations need centralized treasury visibility, ERP connectivity, API/file connectivity, multi-bank connectivity, FX controls, approval workflows and dedicated operational services. Vendor selection also includes reliability and integration capabilities, not just transaction pricing. The segment also benefits from growing international operations, complex payment flows and demand for centralized monitoring of transactions and reconciliation across multiple markets.
Small and medium enterprises are expected to experience the fastest growth at 8.72% CAGR during the forecast period, owing to international e-commerce, digital services and increasing cross-border trade. Small and medium businesses are looking for transparent fees, easy onboarding, local receiving accounts, accounting integration, batch payments and competitive FX conversion. Thanks to greater access to fintech solutions, SMEs can better manage international supplier payments, customer collections, currency conversion and payment reconciliation.
End User Insights
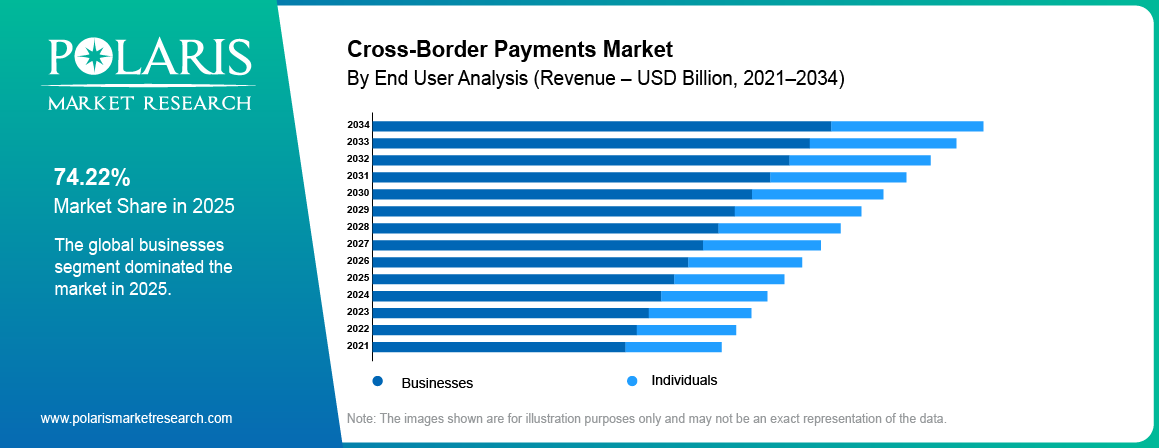
In 2025, businesses segment dominated the market with a 74.22% share due to international supplier settlements, payroll, procurement, marketplace payouts, subscriptions, refunds and intercompany transfers. Business users also want payment APIs, workflow tools, account services, treasury controls, and automated reconciliation. Demand for integrated payment infrastructure is driven by higher transaction value. Increasing international business activity is further supporting demand for solutions that provide payment visibility, beneficiary management, FX controls, compliance capabilities, and integration with accounting and enterprise resource planning systems across multiple countries.
Individuals are expected to register the fastest growth at a 8.06% CAGR during the forecast period, driven by international remittances, travel, education, property expenses, online shopping, personal transfers and income from abroad. The factors affecting consumer adoption include total transaction cost, FX transparency, transfer speed, payout options, trust and mobile usability. The increasing penetration of smartphones and digital financial services are democratizing international remittances and digital wallets; mobile apps and digital remittance platforms offer a convenient alternative for consumers in various payment corridors.
Regional Analysis
North America Cross-Border Payments Market Trends
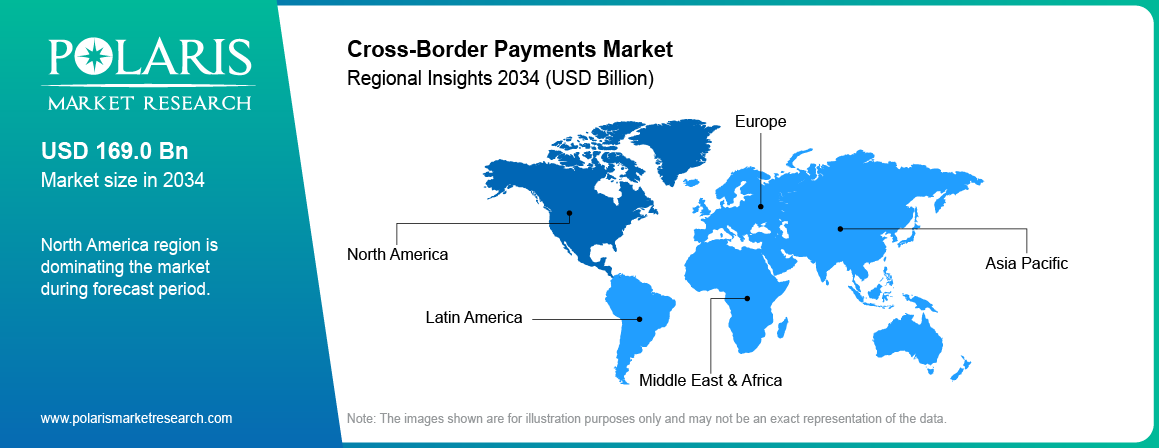
North America accounted for the largest share of the cross-border payments market in 2025 at 28.16%, due to large corporate payment flows, digital commerce, high card usage and transfers related to immigration. In September 2026, Wells Fargo unveiled ExpressSend Mobile, enabling customers to initiate international remittances through its mobile banking app to 12 countries. Corporate treasury, supplier payments, international payroll and marketplace activity all drive demand for APIs, FX services, fraud controls, rapid payouts and enterprise integration. Rules and regulations also drive the need for capabilities in identity, fraud screening, reporting and transaction monitoring. The region is expected to sustain strong demand underpinned by a solid financial infrastructure (Source: ffnews.com).
Europe Cross-Border Payments Market Trends
Europe had 24.72% share of the global market in 2025 due to high digital payment adoption rate, international trade activities, financial infrastructure and regulatory emphasis on payment competition and transparency. The EU said that online payments tripled from 7% to 21% of transactions between 2019 and 2024 and doubled in their share of total payment value from 18% to 36%. SMEs, remote employees, digital businesses and international merchants need multi-currency accounts, local receiving capabilities, FX conversion, cards and international payment services. Fast domestic payment systems are increasing expectations for clear delivery times, beneficiary amounts, and FX costs. Payment modernization and interoperability initiatives are also supporting regional market development (Source: europa.eu).
Asia Pacific Cross-Border Payments Market Trends
Asia Pacific is expected to register the fastest growth of 9.24% during the forecast period, driven by manufacturing and trade corridors, migrant populations, digital commerce, mobile-first consumers, and domestic instant payment systems. India, Southeast Asia, China-linked commerce, Japan, South Korea, and Australia generate demand across B2B payments, remittances, e-commerce, education, travel, marketplaces, and international services. According to IBEF, India’s e-commerce market is projected to grow from USD 125 billion in 2024 to USD 345 billion by 2030 and reach USD 550 billion by 2035. Fintech innovation, mobile wallets and digital banking are also expanding access to cross-border payment services across the region (Source: ibef.org).
Middle East & Africa Cross-Border Payments Market Trends
Middle East & Africa held 9.64% share of the cross-border payments market in 2025, owing to the expatriate payment corridors, remittances, digital commerce, mobile money and uneven banking access. Demand for these factors in the international money transfer market is particularly strong in corridors where expatriate and remittance flows are high. Gulf economies experience significant expat payment activity and demand from African markets for mobile financial services and alternative payout channels. Banks, exchange houses, fintechs, and wallets linked to telecoms and global payment networks serve the full range of preferences across bank accounts, wallets, cards and cash. Local partnerships still matter in markets where infrastructure access is limited.
Latin America Cross-Border Payments Market Trends
Latin America accounted for 10.64% share of the cross-border payments market in 2025 and is expected to grow rapidly during 2026–2034, driven by increasing demand for cross-border payments across remittances, e-commerce, tourism, creator income, software exports, and SME trade. Digital wallets and fintech platforms are responding to the need for international accounts and faster settlement across local monetary systems. Currency volatility and banking regulation are affecting FX costs and settlement structures and driving the need for flexible routing and treasury processes. Growing digital payment adoption is creating additional opportunities for fintechs, banks and payment platforms. Remittance activity, e-commerce expansion and improving payment infrastructure are expected to support demand for faster and more accessible cross border payment solutions.
Regulatory Landscape Snapshot
| Region | Regulation / initiative | Key requirement | Market impact |
| Global | G20 Roadmap targets (FSB) | Retail cost of 1% by end-2027; remittances 3% by 2030 | Makes cost, speed, and transparency measurable |
| Global | FATF Recommendation 16 revision (2025) | Fuller payer and payee data in transfers | Raises data quality and screening requirements |
| European Union | Instant Payments Regulation | Instant euro transfers with verification of payee | Raises expectations for speed and payee checks |
| United States | GENIUS Act (2025) | Federal framework for payment stablecoins | Supports regulated stablecoin settlement |
| United States | FedNow cross-border support (2026) | U.S. leg settles on FedNow; foreign leg via correspondents | Faster U.S. side of international payments |
| Global messaging | ISO 20022 migration on Swift | Structured data for cross-border payment messages | Better automation and compliance screening |
Source: FSB; FATF; European Commission; Federal Reserve Financial Services; Swift, and Polaris Market Research Analysis
Cross-Border Payments Market Competitive Landscape
Competitive Landscape Snapshot
| Company | Vendor type | Market position | Core strength | Primary focus |
| Visa Inc. | Card network | Leader | Global acceptance and payout reach | Consumer, B2C payouts |
| Mastercard Incorporated | Card network | Leader | Network scale and account-to-account payouts | Consumer, B2C, B2B |
| JPMorgan Chase & Co. | Transaction bank | Leader | Liquidity and treasury integration | Large-enterprise B2B |
| Citigroup Inc. | Transaction bank | Leader | Multi-currency clearing reach | Large-enterprise B2B, banks |
| HSBC Holdings plc | Transaction bank | Leader | Trade-corridor coverage | Large-enterprise B2B |
| Wise plc | Digital-first platform | Challenger | Low-cost FX and own payment network | C2C, SMEs |
| Payoneer Global Inc. | Digital-first platform | Challenger | Marketplace and seller payouts | SMEs, marketplaces |
| Airwallex Pty Ltd | Digital-first platform | Challenger | Multi-currency accounts and APIs | SMEs, platforms |
| PayPal Holdings, Inc. | Merchant platform | Leader | Wallet reach and checkout | C2B, C2C |
| Stripe, Inc. | Merchant platform | Challenger | Developer APIs and local payment methods | C2B, platforms |
| The Western Union Company | Remittance specialist | Leader | Agent network and payout reach | C2C remittances |
| Remitly Global, Inc. | Remittance specialist | Challenger | Digital-only remittance model | C2C remittances |
| Corpay, Inc. | B2B specialist | Niche | Corporate FX and payables | Mid-market B2B |
Source: Company filings and Polaris Market Research Analysis
The cross-border payments market comprises global payment networks, transaction banks, digital-first payment platforms, remittance providers and merchant payment companies. Competition is driven by network reach, licensing, compliance abilities, liquidity, FX economics, APIs, payout speed, customer trust and integration capabilities.
Global networks compete on acceptance, payout reach, institutional relationships and payment processing solutions. Banks compete on corporate relationships, liquidity, treasury services and correspondent banking reach. Digital-first platforms focus on transparent FX, multi-currency accounts, APIs, and digital onboarding.
Competition is increasingly moving toward ecosystem-based models. Providers embedded into ERP systems, marketplaces, accounting platforms, banking channels, wallets, and payment APIs can generate recurring payment activity. Partnerships and acquisitions can also expand corridor coverage by adding local licenses, customers, banking relationships, technology, or payout capabilities.
Cross-Border Payments Market Technology and Innovation Landscape
Technology and Innovation Landscape Snapshot
| Technology | What it does | Market impact | Example (2025–2026) |
| ISO 20022 messaging | Carries structured, data-rich payment messages | Fewer repairs; better screening and reconciliation | Citi uses ISO 20022 (MX) for Swift instant payments |
| Instant payment linkages | Connects domestic real-time rails across borders | Crediting in seconds instead of days | Citi via NPP (AUD), FPS (GBP), IMPS (INR) |
| Pay-by-alias | Sends money using a phone number or email | Simpler consumer transfers; fewer data errors | Swift initiative with Bizum, PayID, and Pix |
| Stablecoin and tokenized settlement | Settles funds 24/7 on blockchain networks | Lower idle liquidity; weekend settlement | Visa–Lloyds USDC settlement pilot |
| Payment orchestration and APIs | Routes payments by cost, speed, and corridor | Higher success rates; lower total cost | Mastercard Move payouts with Corpay |
| AI in payment operations | Flags fraud, ranks sanctions alerts, predicts repairs | Lower manual review costs | Payee verification inside payment workflows |
Source: Polaris Market Research Analysis
ISO 20022 is improving the structure and richness of payment messages. Better data can improve sanctions screening, reconciliation, exception management, automation, and interoperability. However, message standardization does not independently solve settlement, liquidity, compliance, or last-mile payment challenges.
Payments interoperability is increasing through connections between domestic instant payment systems, card networks, account payout networks and fintech routing platforms. Payment interoperability allows providers to select payment rails based on speed, cost, currency, transaction value, beneficiary requirements, and regulatory conditions.
Settlement infrastructure is also evolving via local collection accounts, virtual accounts, prefunding optimization, API-managed liquidity, real-time treasury data and intelligent payment routing. Adoption varies by corridor due to different transaction volumes and regulatory conditions.
Some of the first applications of artificial intelligence will be seen in payment operations. Potential applications include fraud detection, anomaly identification, beneficiary validation, routing selection, payment repair prediction, sanctions alert prioritization, and cash-flow forecasting. Regulated providers still need governance, model controls, explainability and human review for sensitive decisions.
Use Case Analysis
Global Supplier Payments for SMEs
An importing SME can pay suppliers in multiple currencies while managing margins and cash flow. Fragmented bank fees, FX spreads, manual beneficiary setup and invoice reconciliation can add to finance-team workload. Multi-currency account facilities and payment APIs may provide integration of currency conversion, batch payments and beneficiary accounting for payment transparency.
Marketplace Seller and Contractor Payouts
Marketplaces and software platforms can pay thousands of sellers or contractors in various countries. Recipient validation, multiple payout options, payment tracking, returns and reconciliation are all operational challenges. Embedded payout networks can automate these processes through a single interface across local payment rails.
Migrant Remittances and Family Support
Consumers sending recurring household support prioritize delivered value, transfer speed, trust, and convenient payout options. Digital remittance services offer mobile onboarding and access to bank accounts, wallets, cards or cash payouts for a variety of corridors. Total cost, reliability and last-mile availability are areas in which providers can compete.
Multi-Market E-Commerce and Subscription Collections
International merchants handle suppliers, taxes and service providers in multiple markets and accept payments in multiple currencies. Multi-currency digital wallets and merchant payment infrastructure can reduce needless conversions and improve settlement visibility. Deeper integration can tie payment and treasury data directly to merchant workflows.
Buyer Analysis and Barriers to Market Entry
Buyer Decision Framework
| Buyer group | Primary need | Key buying criteria |
| Large enterprises | Treasury and supplier payments at scale | Reliability, liquidity, ERP/API links, FX controls |
| SMEs | Simple international payables and receivables | Transparent pricing, local accounts, accounting sync |
| Platforms/marketplaces | Mass payouts and collections | API scale, recipient onboarding, status data |
| Consumers | Remittances and personal transfers | Total cost, speed, trust, payout reach |
| Banks/financial institutions | White-label corridor reach | Compliance, scheme reach, uptime, settlement model |
Payment purchasing is increasingly a team sport, involving finance, treasury, operations, compliance, technology and security. Buyers look at FX economics, service reliability, integration requirements, regulatory compliance, settlement capabilities, and lifecycle costs.
Barriers to Market Entry
- Licensing and compliance: Licensing, due diligence of customers, sanctions check, AML, reporting, and data obligations should be taken care of by providers.
- Banking or payment rails: New market entrants will require a banking partner, clearing access, scheme access, or a local payout partner.
- Foreign exchange and liquidity: Foreign exchange conversion management is one of the areas which need to be addressed by providers.
- Trust and Resilience: Payment failures affect payroll payments, vendor transactions, family assistance, and merchant cash flow.
- Scale of corridor: Different amounts of investment are required in regulation, technology, liquidity, partnerships, and customer acquisition per corridor.
- Distribution: Access must be provided through banking, accounting, ERP systems, marketplaces, or digital applications directly
Premium Insights and Forward Outlook
Major Remittance Inflow and Outflow Markets
| Country / aggregate | Flow | Value, 2024 (USD billion) | Role in cross-border payments |
| India | Inflow | 138 | World's largest remittance recipient |
| Mexico | Inflow | 68 | Anchors the U.S.–Mexico corridor |
| Philippines | Inflow | 40 | Diaspora-led consumer corridor |
| United States | Outflow | 103 | Largest remittance-sending country |
| World (reported by recipients) | Inflow | 892 | Exceeds the 549 reported by sending countries |
Source: World Bank (via Destatis and BusinessToday)
Real-Time Expectations Will Influence International Payment Experiences
Customers increasingly expect international payments to provide immediate confirmation, clear FX rates, upfront fees, continuous status updates, and rapid beneficiary availability. The underlying settlement process can still involve correspondent banking, prefunded accounts, cards, domestic instant payment systems, or deferred institutional settlement. Payment orchestration can abstract this complexity from customers by selecting different payment paths according to corridor requirements.
Payment Data and Transparency Will Become Important Commercial Capabilities
Structured payment data can reduce exceptions in payments, improve validation of beneficiaries, automate reconciliation and provide clearer information about expected costs and delivery times. Enterprise customers can embed those capabilities into treasury, procurement, accounting and payment work flows. That means more opportunities for revenue from subscriptions, APIs, fx services, account products and software features, not just transaction fees.
Cost and Pricing Benchmarking Analysis
Cross-border payment pricing varies across providers and corridors. Providers may charge explicit transfer fees, FX spreads, receiving fees, card fees, intermediary deductions, subscription charges, or negotiated enterprise rates. Total delivered cost therefore provides a more useful comparison than the headline transfer fee alone.
| Cost component | How it appears | Buyer impact |
| Transfer fee | Flat or percentage fee | Visible, but rarely the full cost |
| FX spread | Markup over the mid-market rate | Often exceeds the explicit fee |
| Intermediary fee | Deducted in transit | Makes the received amount uncertain |
| Payout fee | Charged at the receiving end | Varies by account, wallet, card, or cash |
| Platform fee | Monthly or tiered subscription | Common in business accounts |
| Negotiated pricing | Volume- or corridor-based | Compare total cost and service levels |
Source: Polaris Market Research Analysis
Providers with direct local connectivity can reduce dependence on intermediaries in suitable corridors. However, infrastructure ownership can increase fixed investment, while partner-based models can reduce capital requirements at the cost of additional fees and operational dependencies.
Remittance Cost Benchmark by Provider Type
| Benchmark | Avg. cost of sending USD 200 (Q3 2025) | Takeaway |
| Global average | 6.36% | More than double the 3% target for 2030 |
| Banks | 14.99% | Most expensive provider type |
| International MTO index | 5.52% | Below the global average |
| Digital remittances | 4.59% | Cheaper than non-digital services (7.30%) |
| SmaRT average (informed sender) | 3.29% | Near the 3% target in many corridors |
Source: World Bank, Remittance Prices Worldwide, Issue 54
Key Players in the Cross-Border Payments Market
- Adyen N.V.
- Airwallex Pty Ltd
- Ant Group Co., Ltd.
- Bank of America Corporation
- Citigroup Inc.
- Corpay, Inc.
- Euronet Worldwide, Inc.
- Flywire Corporation
- Global Payments Inc. (Worldpay)
- HSBC Holdings plc
- JPMorgan Chase & Co.
- Mastercard Incorporated
- MoneyGram International, Inc.
- Nium Pte. Ltd.
- Payoneer Global Inc.
- PayPal Holdings, Inc.
- Remitly Global, Inc.
- Revolut Ltd
- Ripple Labs Inc.
- Stripe, Inc.
- Thunes
- Visa Inc.
- The Western Union Company
- Wise plc
Industry Developments
- October 2026: Bancomat, Bizum, MB WAY, Vipps MobilePay, and Wero formed the European Network for Payments to link their schemes for cross-border payments, covering about 130 million users across 13 European countries. (Source: cybernews.com)
- September 2026: Visa and Lloyds Banking Group completed a seven-day live pilot in which Lloyds settled USD 750,000 of cross-border payment obligations with Visa using stablecoins, with funds arriving in under an hour. (Source: mynewsdesk.com)
- September 2026: Citi became the first bank to go live with multiple markets on the Swift payments scheme, giving bank clients instant cross-border access in AUD, GBP, and INR through a single account structure. (Source: citigroup.com)
- September 2026: Swift launched an industry initiative to bring domestic pay-by-alias experiences, such as Bizum, PayID, and Pix, to cross-border consumer payments. (Source: swift.com)
- September 2026: Federal Reserve Financial Services announced that the FedNow Service will support the U.S. leg of cross-border transactions, starting with early-adopter testing. (Source: thepaypers.com)
- September 2026: UniBank and Mastercard launched a cross-border payments tool to help Panamanian SMEs make faster international payments to over 50 countries. (Source: thepaypers.com)
- September 2026: SAMA and Qatar Central Bank signed an agreement to enable cross-border interoperability between Saudi Arabia’s mada and Qatar’s HIMYAN payment schemes. (Source: ffnews.com)
- September 2026: Bank of Kigali has become the first bank in East and Central Africa to join China’s CIPS, enabling more direct and efficient RMB cross-border payments between Rwanda and China. (Source: ktpress.rw)
- June 2026: Bank of America plans to launch real-time cross-border payments, enabling international transfers to settle within seconds or minutes. (Source: fintech.global)
- January 2026: Global Payments Inc. completed its acquisition of Worldpay from FIS and GTCR, creating a merchant platform that processes about USD 3.7 trillion in annual payment volume across more than 175 countries. (Source: businesswire.com)
Cross-Border Payments Market Segmentation
By Transaction Type Outlook (Revenue, USD Billion, 2021–2034)
- Business to Business (B2B)
- Business to Consumer (B2C)
- Consumer to Business (C2B)
- Consumer to Consumer (C2C)
By Channel Outlook (Revenue, USD Billion, 2021–2034)
- Bank Transfer
- Card Payment
- Money Transfer Operator
- Digital / Other Payment Platforms
By Enterprise Size Outlook (Revenue, USD Billion, 2021–2034)
- Large Enterprises
- Small and Medium Enterprises
By End User Outlook (Revenue, USD Billion, 2021–2034)
- Businesses
- Individuals
By Regional Outlook (Revenue, USD Billion, 2021–2034)
- North America
- US
- Canada
- Europe
- Germany
- France
- UK
- Italy
- Spain
- Netherlands
- Rest of Europe
- Asia Pacific
- China
- Japan
- India
- South Korea
- Taiwan
- Australia
- Rest of Asia Pacific
- Latin America
- Brazil
- Mexico
- Argentina
- Rest of Latin America
- Middle East & Africa
- Saudi Arabia
- UAE
- South Africa
- Rest of Middle East & Africa
Cross-Border Payments Market Report Scope
| Report Attributes | Details |
| Market Size in 2025 | USD 186.03 Billion |
| Market Size in 2026 | USD 201.57 Billion |
| Revenue Forecast by 2034 | USD 386.82 Billion |
| CAGR | 7.51% from 2026–2034 |
| Base Year | 2025 |
| Historical Data | 2021–2024 |
| Forecast Period | 2026–2034 |
| Quantitative Units | Revenue in USD Billion and CAGR |
| Report Coverage | Revenue Forecast, Growth Factors, Competitive Landscape, Industry Trends, and Strategic Analysis |
| Segments Covered |
|
| Regional Scope | North America, Europe, Asia Pacific, Latin America, Middle East & Africa |
| Competitive Landscape | Company Profiling, Product Benchmarking, Financial Analysis, Market Developments, and Strategic Initiatives |
| Report Format | PDF + Excel |
| Customization | Available by Country, Region, and Segment |
Source: Polaris Market Research Analysis
Why Choose Polaris Market Research
Polaris Market Research & Consulting, Inc. combines secondary research, primary interviews, market modeling, competitive benchmarking, and analyst review to develop decision-ready insights for the cross-border payments market report. The methodology gives particular attention to the revenue boundary because transaction value and provider revenue represent different market measures in the international payments industry.
The cross-border payments market analysis offers insights across transaction types, payment channels, enterprise sizes, end users, regions, competitors, technologies, and pricing structures. The study also supports global payments industry analysis by assessing key market trends, competitive developments, payment technologies, and regional dynamics. The study can be customized based on target corridors, customer categories, payment rails, competitors, and geographic requirements.
Cross-Border Payments Market Research Methodology
The cross-border payments market research follows five phases covering market definition, secondary research, primary validation, market modeling, triangulation, and final quality review. Regulatory publications, central-bank sources, company disclosures, annual reports, payment-network announcements, and industry sources are reviewed to assess market developments, competitive activity, and the cross-border payments industry forecast.
Research Methodology Phases
| Phase | Primary activities |
| Scope definition | Define revenue boundary, adjacent markets, transaction types, channels, and end users |
| Secondary research | Regulators, central-bank bodies, filings, annual reports, company disclosures, payment-network releases |
| Primary research | Interviews with providers, banks, fintechs, corporate treasury users, payment operations specialists, and channel experts |
| Modeling and triangulation | Provider revenue logic, transaction economics, corridor demand, segment splits, regional checks, scenario analysis |
| Review and QC | Senior analyst challenge, source verification, consistency checks, editorial review, final sign-off |
Source: Polaris Market Research Analysis.
Primary research should distinguish gross transaction value from provider revenue. Interviews should also assess FX revenue, payment fees, network costs, subscription revenue, and software services to maintain a consistent market boundary.
The recommended research team includes a lead payments analyst, research analyst, quantitative/modeling analyst, and independent senior reviewer.
Cross-Border Payments Market FAQ's
The market is valued at USD 186.03 billion in 2025 and is forecast to reach USD 386.82 billion by 2034.
The market is expected to grow at a CAGR of 7.51% from 2026 to 2034.
North America led the Cross-Border Payments Market in 2025, supported by corporate payments, digital commerce, and well-established payment infrastructure. Asia Pacific is expected to be the fastest-growing region during 2026–2034.
The market is dominated by B2B payments, especially those involving supplier payments, trade, payroll, contractors' payments and intercompany payments.
Cross-border payments move funds between a payer and a beneficiary in different countries or currencies. They are processed through correspondent banks, card networks, clearing systems, wallets, or payment platforms, which also handle currency conversion, compliance checks, and payout.
According to the World Bank, sending USD 200 cost 6.36% on average in Q3 2025. Banks averaged 14.99%, while digital remittances averaged 4.59%. Costs stay high because of FX markups, intermediary fees, compliance checks, and prefunding. G20 targets call for retail payment costs of no more than 1% on average by end-2027 and remittance costs of 3% by 2030.
Timing depends on the payment method, currencies, intermediaries, and compliance checks. Swift reports that 75% of payments on its network reach the receiving bank within 10 minutes. The G20 target is for 75% of wholesale cross-border payments to be credited within one hour by end-2027.
Cross-border payments cover business, consumer, merchant, and payroll transfers across jurisdictions. Remittances are a smaller subset, typically money that migrants send to family abroad. India is the largest remittance recipient, with about USD 138 billion in 2024, according to World Bank estimates.
Links between domestic instant payment systems let international payments reach the beneficiary over a fast local rail. In September 2026, Citi launched multi-market instant payments on the Swift payments scheme, and the FedNow Service announced support for the U.S. leg of cross-border payments. Visa and Lloyds Banking Group also settled USD 750,000 using stablecoins in a live pilot, with funds arriving in under an hour.
Risk areas include fraud, anti-money laundering/sanctions risk, inaccuracies in beneficiary data, foreign currency conversion risk, liquidity risk, cybersecurity risk, and regulatory risk.
Key players include Visa Inc., Mastercard Incorporated, JPMorgan Chase & Co., Citigroup Inc., HSBC Holdings plc, Wise plc, Payoneer Global Inc., PayPal Holdings, Inc., Stripe, Inc., Adyen N.V., The Western Union Company, and Remitly Global, Inc.
G20 targets for faster, cheaper, and more transparent payments are the key driver. Adoption of digital-first platforms, links between domestic instant payment systems, and demand for B2B workflow tools also support growth.
Download Sample Report of Cross-Border Payments Market
Please fill out the form to request a customized copy of the research report.


