
Data Visualization Tools Market Size, Share Global Analysis Report, 2024-2032
REPORT DETAILS
REPORT DETAILS
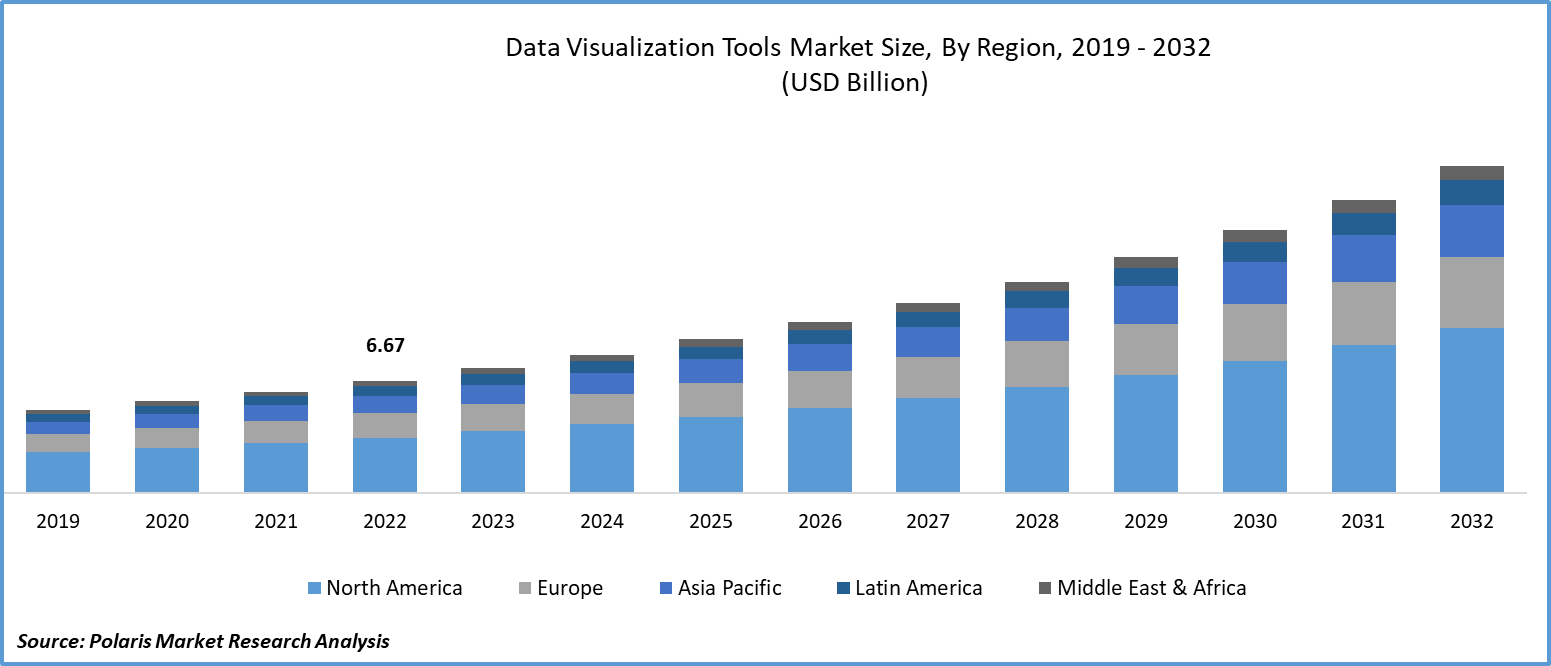
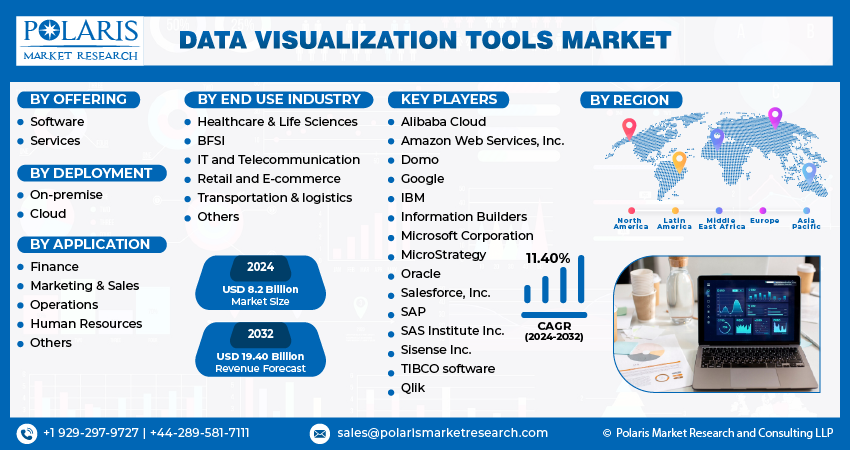
The global data visualization tools market size and share was valued at USD 7.4 billion in 2023 and is expected to grow at a CAGR of 11.40% during the forecast period.
The fast-paced business environment demands access to real-time data and insights. Data visualization tools that can provide up-to-the-minute information are vital for organizations seeking agility and responsiveness. The proliferation of data analytics across industries underscores the need for robust data visualization tools. These tools are crucial for presenting the findings of data analysis effectively, and facilitating data-driven decision-making.
Information and data are represented graphically in data visualization. Software programs known as data visualization tools present information for data analysis purposes in a visual manner, such as a chart, graph, or heat map. These tools facilitate the understanding and handling of large amounts of data. People may make data-driven decisions with the help of efficient data visualization tools, saving them the time and effort of trying to organize unstructured data in a comprehensible manner. When properly set up, data visualization software accomplishes that labor for you by selecting only the most pertinent and significant facts from enormous repositories of data.
Furthermore, data visualization tools differ greatly. They range from user-friendly software with an emphasis on simplicity to more advanced platforms that demand a greater level of technical and data science expertise. But the ultimate objective of all the technologies is essentially the same: to make data easier to understand and use. As a result, these various key factors are driving the demand for data visualization tools market.
To Understand More About this Research: Download Sample Report
Data visualization tools with user-friendly interfaces broaden their user base, enabling professionals from diverse fields, including non-technical staff, to create, interpret, and interact with data visualizations. Intuitive interfaces are increasingly valued in the data visualization tools market.
In addition, several companies are expanding their offerings to cater to the growing consumer demand.
- For instance, in May 2021, PredictiVu launched Dynamic Marketing Optimizer (DMO), a centralized next-gen automated AI-powered data visualization tool.
The integration of artificial intelligence (AI) and machine learning (ML) capabilities within data visualization tools unlocks opportunities for advanced analytics and predictive modeling. These tools can provide more insightful visualizations and assist in uncovering patterns and trends in complex data. Businesses seek data visualization tools that can be customized to align with their specific branding and reporting needs. Scalability is essential for accommodating data growth and varying business requirements over time.
The research study offers an in-depth analysis of the competitive landscape in the industry. It examines the top players in the data visualization tools market on the basis of multiple factors, including market position, sales, new developments and products/services offered. Also, it details the key strategies like mergers, partnerships and collaborations that have been taken by data visualization tools industry key players to improve their position in the market.
Various sectors, such as healthcare, finance, e-commerce, and marketing, have unique data visualization requirements. Tailored solutions for specific industry verticals present opportunities for specialized vendors to provide niche offerings.
The research report offers a quantitative and qualitative analysis of the Data Visualization Tools Market to enable effective decision-making. It covers the key trends and growth opportunities anticipated to have a favorable impact on the market. Besides, the study covers segment and regional revenue forecasts for market assessment.
Growth Drivers
-
Increase in data complexity, adoption of data-driven decision-making, and technological advancements is projected to spur the market demand
The increasing intricacy of data, encompassing vast datasets and unstructured information, underscores the need for highly advanced data visualization tools capable of effectively managing and presenting this complexity.
With a growing awareness of the benefits of data-driven strategies, data visualization tools have evolved into pivotal assets for translating raw data into actionable insights. This transformation is further propelled by the ready availability of real-time data, solidifying the tools' importance in facilitating well-informed decision-making.
The extensive adoption of Business Intelligence (BI) solutions has led to a considerable demand for integrated data visualization functionalities. Businesses are actively pursuing the creation of interactive, visually engaging dashboards and reports that effectively convey insights to key stakeholders.
Report Segmentation
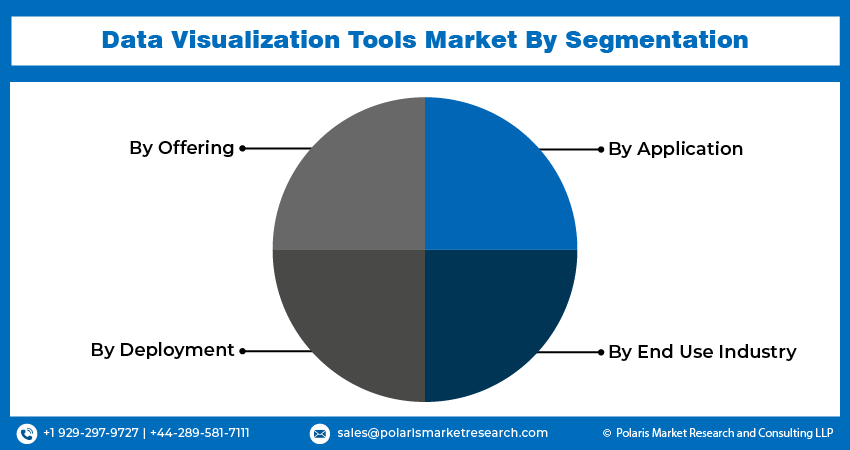
The market is primarily segmented based on offering, deployment, application, end use industry, and region.
| By Offering | By Deployment | By Application | By End Use Industry | By Region |
|
|
|
|
|
To Understand the Scope of this Report: Request Customization
By Offering Analysis
-
Software segment accounted for a significant share in 2022
The software segment accounted for a significant share in 2022. The escalating complexity and volume of data require advanced visualization tools for comprehending and harnessing insights. Data-driven decision-making has become a cornerstone of business strategy, creating a demand for software that presents data in actionable formats. Business intelligence adoption is on the rise, necessitating integrated data visualization for interactive dashboards and informed decisions. Real-time insights and the growth of data analytics further fuel the demand for data visualization software. The integration of AI and machine learning, user-friendly interfaces, cross-device compatibility, and customization options amplify the market's momentum, serving diverse industries' evolving needs.
By Deployment Analysis
-
On-premise segment accounted for a significant share in 2022
The on-premise segment accounted for a significant share in 2022. On-premise deployment of data visualization tools involves installing and running these applications within an organization's local infrastructure. This approach offers several benefits, including greater data control, customization, improved performance, compliance adherence, robust data governance, enhanced security measures, and seamless integration with existing systems. This is especially relevant for industries with stringent privacy and security requirements, like healthcare and finance. However, on-premise deployment also entails higher initial expenses, the need for dedicated IT support, and potential scalability and remote access limitations.
By End Use Industry Analysis
-
Healthcare & life sciences segment is expected to experience significant growth during the forecast period
The healthcare & life sciences segment is expected to experience significant growth during the forecast period. Data visualization tools are essential in the healthcare and life sciences sector, offering numerous advantages. They enable healthcare professionals to analyze patient data, make informed treatment decisions, and engage patients effectively. In life sciences, these tools are critical for visualizing complex molecular data, aiding in drug discovery and genetic research. Epidemiological analysis and disease tracking benefit from data visualization, as do pharmaceutical sales, marketing, and healthcare operations. These tools enhance drug safety monitoring, support public health initiatives, and help researchers present their findings effectively. Data visualization is integral in transforming complex data into actionable insights for better patient care and scientific progress in healthcare and life sciences.
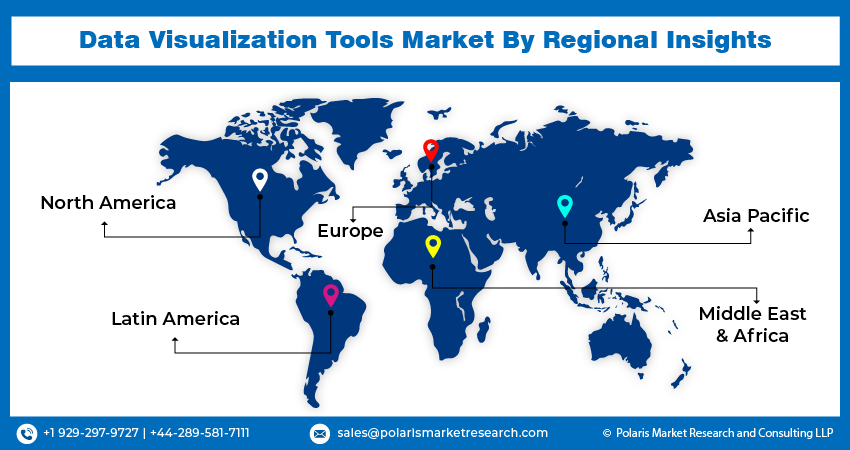
Regional Insights
-
North America emerged as the largest region in 2022
North America emerged as the largest region in 2022. The market for data visualization tools is witnessing substantial growth as these tools serve as the essential bridge between raw data and actionable insights. They empower businesses to distill intricate datasets into clear visuals, enabling better decision-making. Business intelligence (BI) adoption is a major catalyst driving the data visualization tools market. Enterprises across various industries in the U.S. are embracing these tools to gain a competitive edge. By utilizing data visualization, they can transform data into strategic insights, resulting in informed decision-making and enhanced performance. Self-service business intelligence is a rising trend that significantly impacts the market. The self-service approach empowers users to create their visualizations, reports, and dashboards without heavy reliance on IT departments. This shift not only streamlines processes but also democratizes data access and analytics, driving the market's expansion.
The data visualization tools market in Asia-Pacific is experiencing robust growth, propelled by several key drivers. The region's increasing emphasis on data-driven decision-making and rapid digital transformation are significant factors. Government initiatives supporting data analytics across sectors, along with industry-specific solutions, are fostering market expansion. Cloud adoption is on the rise, offering scalability and accessibility. The integration of AI and ML enhances predictive analytics and automation. Regulatory compliance, particularly in finance and healthcare, drives the adoption of data visualization tools. Opportunities lie in healthcare analytics, financial services, education, government, SMEs, and advanced analytics, making the Asia-Pacific market dynamic and promising.
Key Market Players & Competitive Insights
The data visualization tools sector exhibits a fragmented landscape, and competition is expected to intensify due to the active participation of numerous players. Prominent firms in this industry consistently introduce innovative strategies to bolster their market position. These key players prioritize strategies like forming partnerships and fostering collaborations to gain a competitive edge over their peers and establish a significant market presence.
Some of the major players operating in the global market include:
- Alibaba Cloud
- Amazon Web Services, Inc.
- Domo
- IBM
- Information Builders
- Microsoft Corporation
- MicroStrategy
- Oracle
- Salesforce, Inc.
- SAP
- SAS Institute Inc.
- Sisense Inc.
- TIBCO Software
- Qlik
Recent Developments
- In April 2025: Salesforce added new AI tools to Tableau, using automation and easy search to help large companies make faster, smarter choices using their own data.
- In January 2025: QlikTech teamed up with a top North American cloud firm to put its data tools into hybrid systems, aiming for better speed and safety for big business users
- In July 2024: NASA upgraded its hyperwall visualization system with higher-resolution displays, allowing researchers to analyze large datasets with greater clarity.
- In April 2023: Tempo Software acquired Old Street Solutions to enhance data visualization features in its portfolio management tools for Jira and Confluence, supporting better planning and decision-making.
- In August 2022: Reveal introduced a new data visualization solution, which utilizes the company’s artificial intelligence system. The solution is aimed at assisting users to map the patterns through various data points from common communication apps.
- In April 2022: TCN, Inc. introduced Data Explorer, a cutting-edge data visualization tool. This latest addition empowers contact centers to efficiently optimize real-time data organization and administration, simplifying the process of maintaining high-quality data and meeting compliance requirements proactively.
Data Visualization Tools Market Report Scope
| Report Attributes | Details |
| Market size value in 2024 | USD 8.2 billion |
| Revenue Forecast in 2032 | USD 19.40 billion |
| CAGR | 11.40% from 2024 – 2032 |
| Base year | 2023 |
| Historical data | 2019 - 2022 |
| Forecast period | 2024 – 2032 |
| Quantitative units | Revenue in USD billion and CAGR from 2024 to 2032 |
| Segments Covered | By Offering, By Deployment, By Application, By End Use Industry, By Region |
| Regional scope | North America, Europe, Asia Pacific, Latin America; Middle East & Africa |
| Customization | Report customization as per your requirements with respect to countries, region and segmentation. |
We strive to offer our clients the finest in market research with the most reliable and accurate research findings. We use industry-standard methodologies to offer a comprehensive and authentic analysis of the Data Visualization Tools Market. Besides, we have stringent data-quality checks in place to enable data-driven decision-making for you.
Browse Our Top Selling Reports
Cephalosporin Drugs Market Size, Share 2024 Research Report
Ear Infection Treatment Market Size, Share 2024 Research Report
Elbow Replacement Market Size, Share 2024 Research Report
FAQ's
USD 7.4 billion in 2023 to USD 19.40 billion by 2032 at 11.40% CAGR.
Software segment leads due to data complexity and BI adoption.
North America, driven by innovation and technology adoption.
Healthcare & life sciences for patient analytics and drug research.
Microsoft, IBM, Oracle, SAP, Salesforce, Google, AWS, Qlik
Download Sample Report of Data Visualization Tools Market
Please fill out the form to request a customized copy of the research report.
