
Decarbonization Market Share, Demand, Growth Report, 2025-2034
REPORT DETAILS
REPORT DETAILS
Decarbonization Market Summery
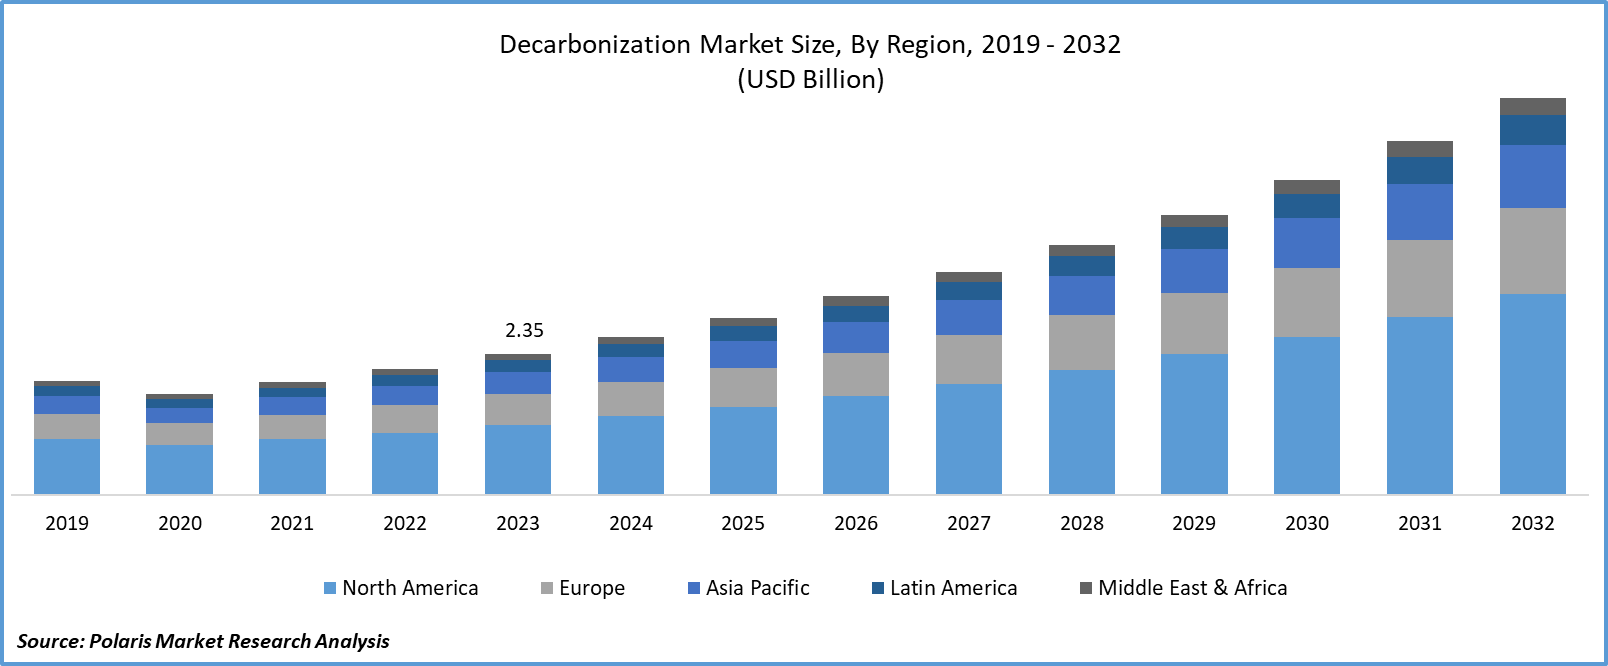
The global Decarbonization Market was valued at USD 1.8 Trillion in 2024 and is anticipated to grow at a CAGR of 15.40% from 2025 to 2034. Escalating climate change concerns, regulatory mandates, and corporate sustainability goals are accelerating investments in clean energy and carbon reduction technologies.
Market Statistics
The research report offers a quantitative and qualitative analysis of the decarbonization market to enable effective decision-making. It covers the key trends and growth opportunities anticipated to have a favorable impact on the market. Besides, the study covers segment and regional revenue forecasts for market assessment.
The substantial surge in renewable energy adoption is propelling market expansion. The shift towards low-carbon fuels, coupled with stringent environmental regulations in developed nations, has notably propelled the renewable energy industry. In recent years, the energy generation market has witnessed a rise in installed renewable capacity due to heightened environmental consciousness and the urgency to mitigate the adverse effects of Greenhouse Gases (GHG). This trend has been instrumental in advancing the solar and wind energy sectors.
To Understand More About this Research: Download Sample Report
The development of green bonds, sustainable investment funds, and carbon offset markets are avenues for financing decarbonization initiatives. Dependence on fossil fuels for energy renders economies susceptible to price fluctuations and geopolitical instabilities. Shifting towards renewable energy sources bolsters energy security by broadening the spectrum of energy resources and diminishing reliance on finite reserves.
- For instance, in September 2023, A.P. Moller-Master's A/S and CMA CGM opted to collaborate on various aspects of decarbonization, ensuring full adherence to all applicable laws and regulations.
However, while the long-term benefits of decarbonization are substantial, the initial investment costs can be a significant barrier for businesses, especially smaller enterprises. Upfront expenses for renewable energy installations, energy-efficient technologies, and emissions reduction measures can be daunting.
Additionally, many industries, particularly those reliant on heavy manufacturing or fossil fuels, have extensive existing infrastructure designed around carbon-intensive processes. Retrofitting or transitioning away from these established systems can be a complex and costly endeavor. Thus, these factors hamper the growth of the decarbonization market.
Growth Drivers
Increasing consumer demand and social awareness are projected to spur product demand.
Growing public awareness of environmental issues and climate change is driving consumer preferences towards sustainable products and services. This demand is prompting businesses to adopt environmentally friendly practices, pushing them towards decarbonization. Furthermore, governments worldwide are enacting policies and regulations to encourage decarbonization initiatives. These encompass carbon pricing frameworks, mandates for renewable energy adoption, targets for emissions reduction, and fiscal incentives for clean technologies. Such measures offer distinct signals to businesses and investors, compelling them to adopt sustainable practices.
Report Segmentation
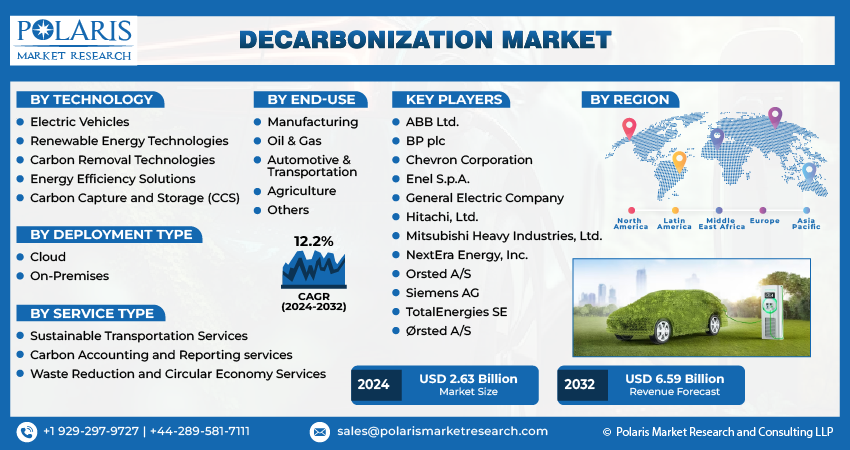
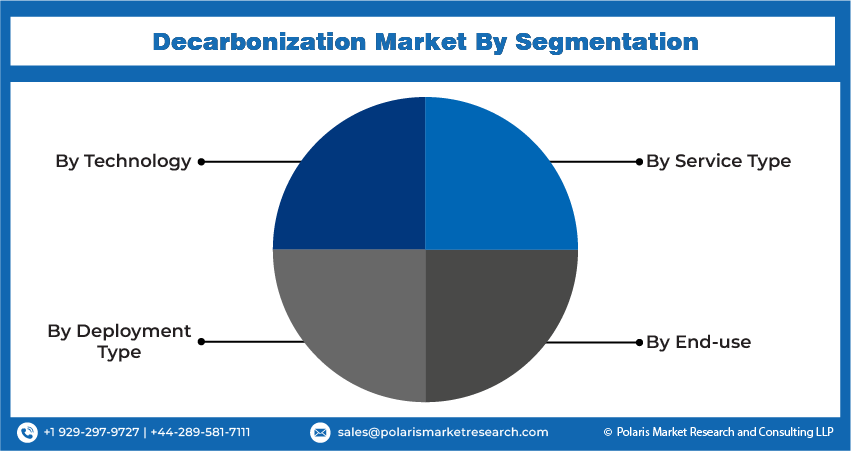
The market is primarily segmented based on technology, deployment type, service type, end-Use, and region.
| By Technology | By Deployment Type | By Service Type | By End-Use | By Region |
|
|
|
|
|
To Understand the Scope of this Report: Request Customization
By Technology Analysis
The Electric Vehicle segment is expected to witness the fastest CAGR during the forecast period.
The electric vehicle segment is expected to witness the fastest CAGR during the forecast period. This surge is fueled by a collective global commitment to reduce carbon emissions and combat climate change. Technological advancements have led to improved battery efficiency and range, alleviating range anxiety and bolstering consumer confidence in EVs. Government incentives, subsidies, and stringent emissions regulations further incentivize the shift towards electric mobility. Major automotive manufacturers are heavily investing in EV research and development, expanding their product offerings to cater to burgeoning market demand.
Additionally, a burgeoning infrastructure of charging stations is rapidly developing, addressing concerns about charging accessibility. As the momentum builds, the electric vehicle segment is poised to play a pivotal role in achieving a sustainable and decarbonized transportation future.
By Deployment Type Analysis
On-premises segment accounted for the largest market share in 2024
The on-premises segment accounted for the largest market share in 2024 and is likely to retain its market position throughout the forecast period. A strategic shift towards localized sustainability efforts drives this surge. Organizations recognize the need for immediate action to reduce their carbon footprint and are increasingly investing in on-premises solutions. These solutions empower businesses to implement tailored strategies, addressing emissions at the source within their facilities or operations.
Advancements in renewable energy systems, energy-efficient technologies, and carbon capture methods have made on-premises decarbonization solutions more accessible and cost-effective. Government incentives and regulatory frameworks further incentivize businesses to adopt localized carbon reduction measures. As a result, the on-premises segment is poised for continued expansion, playing a vital role in advancing sustainable practices within various industries.
By Service Type Analysis
Sustainable transportation services segment held a significant revenue share in 2024
In 2024, the sustainable transportation services segment held a significant revenue share. An escalating global emphasis on eco-friendly mobility solutions propels this surge. Governments and consumers alike are prioritizing low-emission transportation options to combat climate change. Electric vehicles (EVs), public transit enhancements, and shared mobility services are becoming integral components of sustainable transportation strategies. Technological advancements in EV batteries and charging infrastructure are addressing range anxiety and enhancing convenience.
Additionally, the development of cleaner fuels and the adoption of alternative propulsion systems are further catalyzing the growth of sustainable transportation services. With regulatory support and growing consumer demand, this segment is poised for continued expansion, revolutionizing the way we move towards a more environmentally conscious future.
By End-Use Analysis
The oil and gas segment is expected to witness the highest growth during the forecast period.
The oil and gas segment is expected to witness the highest growth during the forecast period and experience a transformative shift within the market. Traditionally associated with high emissions, this industry is now actively working towards sustainable practices. Major players are investing heavily in renewable energy sources like solar, wind, and biofuels, diversifying their portfolios. Carbon capture technologies and methane emission reduction strategies are also gaining prominence to mitigate environmental impacts. Additionally, advancements in hydrogen production from renewable sources hold promise for cleaner energy solutions.
Furthermore, there is a growing trend towards circular economy models within the oil and gas sector, involving the repurposing and recycling of resources. It reduces waste and minimizes environmental footprint. With mounting pressure from stakeholders and increasing regulatory frameworks, oil and gas companies are aligning their strategies with decarbonization goals. Overall, the oil and gas segment is on a trajectory toward sustainability, recognizing the imperative to play a pivotal role in global efforts to combat climate change.
Regional Insights
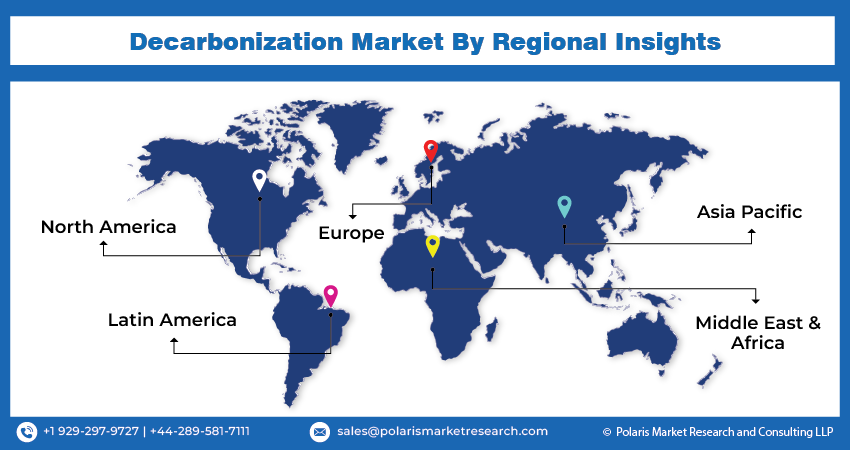
North America region accounted for the largest market share in 2024
In 2023, the North American region accounted for the largest market share and is expected to maintain its dominance over the anticipated period. The growth of the segment market is largely attributed to stringent environmental regulations and ambitious government targets for emissions reduction are driving significant investments in renewable energy, energy-efficient technologies, and sustainable transportation solutions. The synergy of regulatory support, technological innovation, and heightened environmental awareness is positioning North America at the forefront of the global decarbonization movement.
The Asia-Pacific region, notably in India, Japan, and China, is poised to experience the fastest CAGR over the forecast period. This surge is attributed to a heightened awareness of environmental safety across various industrial sectors. Organizations in these countries are increasingly prioritizing sustainable technology and information systems, driving significant market expansion through improved knowledge and understanding in this domain.
Key Market Players & Competitive Insights
The decarbonization market is anticipated and fragmented to witness competition due to several players' existence. Significant service providers in the market are continuously upgrading their technologies to stay ahead of the competition and to provide efficiency, integrity, and safety. These players focus on partnership, product upgrades, and collaboration to gain a competitive edge over their peers and capture a significant market share.
Some of the major players operating in the global market include:
- ABB Ltd.
- Advanced Metallurgical Group
- Amazon
- BP plc
- Chevron Corporation
- Enel S.p.A.
- General Electric Company
- Hitachi, Ltd.
- Mitsubishi Heavy Industries, Ltd.
- NextEra Energy, Inc.
- NextHeat
- Ørsted A/S
- Rio Tinto
- Schneider Electric
- Siemens AG
- Stargate Hydrogen
- TotalEnergies SE
Recent Developments
- In July 2025, Schneider Electric introduced Zeigo Hub to help companies reduce emissions in their supply chains. The platform allows organizations to collaborate with suppliers, set targets, and track progress. It offers simple onboarding, real-time insights, and emissions calculation tools. The data supports frameworks like CDP, CSRD, and TCFD. Suppliers get personalized decarbonization plans and access to solutions at no cost.
- In April 2025, Rio Tinto signs MOU with AMG Metals & Materials to explore low‑carbon aluminium production in India
- In March 2025, Amazon introduced a carbon credit service that helps U.S. partners invest in trusted nature-based projects and carbon removal technology. The effort supports Amazon’s plan to achieve net-zero emissions by 2040 through cleaner operations, renewable energy, electric vehicles, and better efficiency. The program brings private funding to meaningful climate solutions that go beyond Amazon’s own footprint.
Decarbonization Market Report Scope
| Report Attributes | Details |
| Market size value in 2025 | USD 2.07 Trillion |
| Revenue forecast in 2034 | USD 7.079 Trillion |
| CAGR | 15.40% from 2025 – 2034 |
| Base year | 2024 |
| Historical data | 2020 – 2023 |
| Forecast period | 2025 – 2034 |
| Quantitative units | Revenue in USD Trillion and CAGR from 2025 to 2034 |
| Segments covered | By Technology, By Deployment Type, By Service Type, By End-Use, By Region |
| Regional scope | North America, Europe, Asia Pacific, Latin America; Middle East & Africa |
| Customization | Report customization as per your requirements with respect to countries, region and segmentation. |
Gain profound insights into the 2025 decarbonization market with meticulously compiled statistics on market share, size, and revenue growth rate by Polaris Market Research Industry Reports. This thorough analysis not only provides a glimpse into historical trends but also unfolds a roadmap with a market forecast extending to 2034. Immerse yourself in the comprehensive nature of this industry analysis through a Download Sample Report.
Browse Our Top Selling Reports
Solar Control Window Films Market Size, Share 2024 Research Report
Medical Gas Market Size, Share 2024 Research Report
Coffee Creamer Market Size, Share 2024 Research Report
Veterinary Scales Market Size, Share 2024 Research Report
Antidote Market Size, Share 2024 Research Report
FAQ's
key companies in decarbonization market are BP plc, Chevron Corporation, Enel S.p.A., General Electric Company
The global decarbonization market is expected to grow at a CAGR of 15.40% during the forecast period.
The decarbonization market report covering key segments are technology, deployment type, service type, end-Use, and region.
key driving factors in decarbonization market are increasing consumer demand and social awareness is projected to spur the product demand
The global decarbonization market size is expected to reach USD 7.079 trillion by 2034
Research Methodology
A robust system of research, verification, and forecasting designed to ensure reliable and actionable market insights.
Polaris Market Research & Consulting, Inc. uses a clear and structured approach to deliver insights that clients can rely on. The process combines detailed primary and secondary research, including direct communication with industry experts. The detailed information helps build a complete picture of market trends and developments. Secondary data is gathered from credible sources such as industry reports, company filings, government source links, and trusted organization databases. It is then cross-checked through discussions with key stakeholders across the value chain. Market size and forecasts are developed using both bottom-up and top-down methods to ensure accuracy and consistency in the final results.
1. Project Setup
Step 1 & 2:
- We start every project by clearly understanding the client’s objective or goal, then defining the market scope, and aligning regions, segments, and timelines.
- Once the foundation is set, we collect data from all-around of sources, including company reports, government databases, and paid industry platforms.
- Our research is based on secondary data, which helps us build a strong understanding of the market across regions and industries. Then we validate this information through primary research by speaking directly with industry experts, companies, and stakeholders.
- By combining secondary and primary research, we ensure that our market insights are accurate, practical, and closely aligned with real market conditions.
2. Data Collection
We gather information from both public and verified sources:
3. Data Structuring
Step 3:
- All collected data is organized into a consistent format to ensure accurate analysis. Since inputs come from multiple sources, they are standardized and aligned before use.
- The data is segmented by product, application, and region, and mapped across a defined historical period (2020–2024). All values are converted into common units (USD Mn/Bn), and volume and pricing are aligned where required to estimate revenue.
- Any overlaps or inconsistencies are reviewed and adjusted to maintain accuracy (<5% variance threshold).
- The result is a structured dataset that allows for clear comparison across regions and supports reliable analysis and forecasting.
Structured Market Dataset, USD Mn/Bn
| Region | Segment | VolumeUnits | Avg PriceUSD | RevenueUSD Mn | Share % |
|---|---|---|---|---|---|
| North America | Product A | 250 | 2.5 | 500 | 15% |
| Product A | XX | XX | XX | XX | |
| Product A | XX | XX | XX | XX | |
| Consistent methodology applied across regions | |||||
4. Market Estimation
Step 4: TOP-DOWN APPROACH
- We start with the overall market size at a global or macro level.
- The market is then narrowed down based on scope and industry relevance.
- We apply penetration rates and split the data by region and segment.
- This helps us estimate the market size for specific segments.
- The numbers are validated through cross-checks to ensure accuracy.
Step 5: BOTTOM-UP APPROACH
- We begin by analyzing data from leading companies in the market.
- Revenue data is collected and mapped across different segments.
- The data is then aggregated to estimate the total market size.
- To fill in any gaps, adjustments are made based on industry standards.
- Validation checks make sure that the results are correct.
5. Forecasting
Step 6:
At Polaris Market Research & Consulting, Inc., we employ a methodical forecasting strategy. This approach blends the analysis of historical data with real-time market validation. To forecast future trends with precision, we examine past patterns, pricing fluctuations, and the interplay of supply and demand. To ensure our conclusions reflect the present market landscape, we actively seek input from industry experts and key stakeholders.
To refine our predictions, we carefully consider critical elements such as market drivers and restraints, fluctuations in raw material costs, emerging technologies, and the production capabilities of various regions. Furthermore, we assess regulatory frameworks and potential policy shifts to gauge their potential impact on market expansion.
All this information is synthesized to generate precise forecasts for each segment and region. These forecasts illuminate the current state of the market and highlight forthcoming opportunities.
6. Validation & Triangulation
Step 7:
In the final stage, we validate all our estimates using a triangulation method, where data is cross-checked from multiple reliable sources, like company data, primary interviews, and secondary research. This helps us make sure that our numbers are correct and fit with the rest of the market.
This process involves verifying data consistency across various segments and geographic areas. It also requires comparing historical trends with the assumptions support the forecast. Any discrepancies involve adjustments to ensure everything remains aligned and dependable.
Once the data is finalized, we prepare the final outputs, including market size estimates, segment-wise breakdowns, and growth metrics. These are delivered in structured formats such as tables, charts, and data files for easy analysis and use.
We collaborate closely with clients, ensuring the final products align with their requirements. This includes offering tailored adjustments, supplementary data analyses, and continuous assistance. Furthermore, we monitor market trends post-delivery, providing updates and refinements to maintain the insights' relevance as time passes.
Triangulation Framework
Estimates are cross-verified across three sources:
Company-level data
• Primary inputs from industry participants
• Secondary benchmarks and published data
Variance maintained within +5-10%
Adjustments applied to align estimates
Segment values validated against overall market structure
Data Consistency & Integrity
Segment totals validated to 100%
Regional estimates aligned with global market size
Historical trends compared against forecast outputs
Assumptions reviewed for cross-segment and regional alignment
Final Outputs
Deliverables
Client Alignment & Support
- Deliverables are aligned with defined client requirements and scope
- Custom data cuts and segment splits are incorporated as required
- Post-delivery queries are addressed through analyst interactions
- Additional clarifications and data support are provided upon request
Client Continuity & Updates
- Market developments are tracked post-delivery to capture changes in key trends
- Updated data and revisions are provided based on new market inputs
- Additional refinements and data cuts are shared as required
- Continued analyst engagement supports evolving client requirements
Download Sample Report of Decarbonization Market
Please fill out the form to request a customized copy of the research report.
