
Electrolytic Manganese Dioxide Market Size & Share Global Analysis Report, 2023-2032
REPORT DETAILS
REPORT DETAILS
ABOUT THIS REPORT
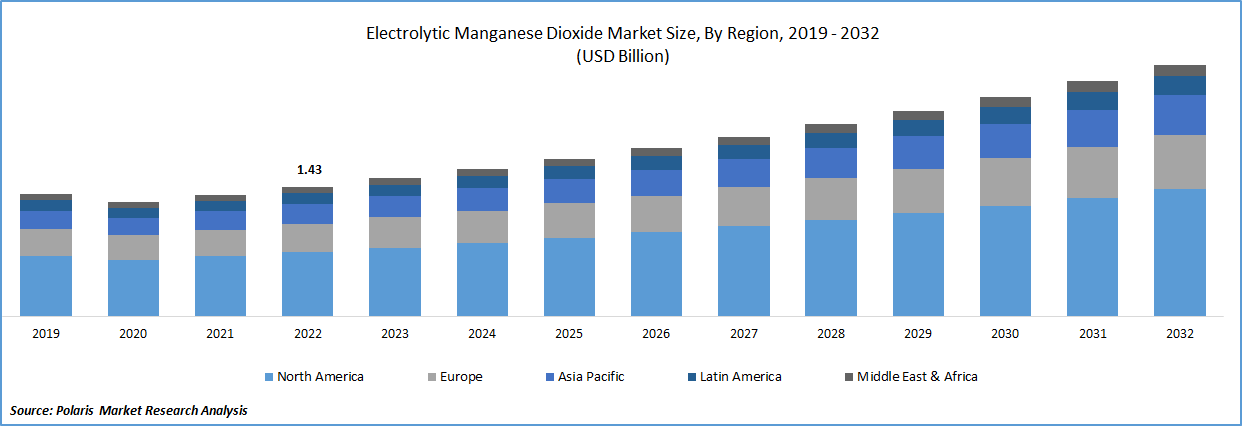
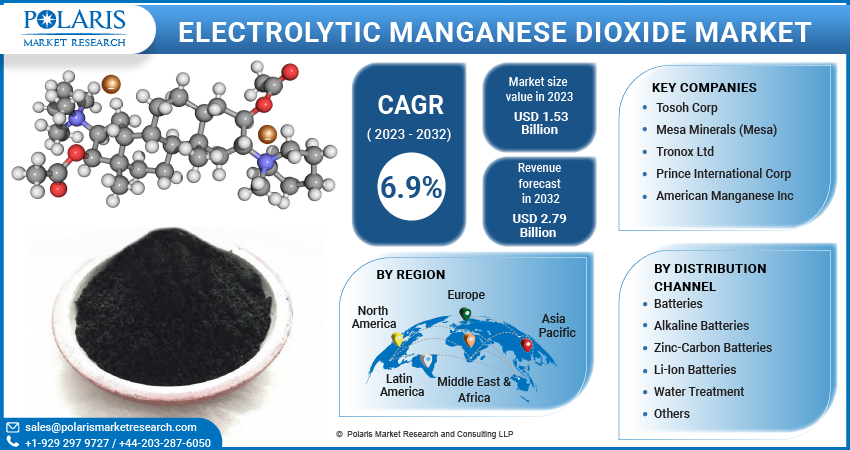
The global electrolytic manganese dioxide market was valued at USD 1.43 billion in 2022 and is expected to grow at a CAGR of 6.9% during the forecast period. Increasing demand for batteries from various industries, particularly the electrical and automotive sectors, is expected to drive the growth of the battery market.
To Understand More About this Research: Download Sample Report
Zinc-carbon and alkaline batteries have been in use for a long time and are widely used in low-drain devices such as remote controls, clocks, and toys. On the other hand, lithium-ion batteries have gained significant popularity in recent years due to their high energy density, longer lifespan, and ability to recharge.
Rise in demand for portable devices, such as smartphones, laptops, tablets, and wearable devices, is expected to have a positive impact on the growth of the battery market. The increasing use of these devices has led to a growing demand for high-capacity, long-lasting, and reliable batteries that can provide a constant power supply.
Litigated Manganese Dioxide (LMD) base battery is a significant development in the market. LMD batteries are a type of lithium-ion battery that uses manganese dioxide as a cathode material and lithium as an anode material. They are known for their high-power output, thermal stability, & improved safety, making them an attractive option for manufacturers producing electric vehicles (EVs). Compared to other types of Li+ batteries, LMD batteries have a higher energy density, which allows them to store more energy per unit of weight. This makes them ideal for use in EVs, where high-energy density is critical to achieving long driving ranges. LMD batteries are also more thermally stable than other types of lithium-ion batteries, reducing the risk of thermal runaway and fire.
In addition to their high-power output and improved safety, LMD batteries are also more cost-effective than other types of lithium-ion batteries, making them an attractive option for EV manufacturers. The high manganese content of LMD batteries also makes them a more sustainable option, as manganese is readily available and less expensive than other cathode materials, such as cobalt.
Electrical and electronics industry is a significant driver of battery demand, as batteries are essential components in many portable devices, including smartphones, laptops, tablets, and wearables. The increasing adoption of electric vehicles (EVs) and hybrid electric vehicles (HEVs) is another major factor driving the growth of the battery market. The automotive industry is gradually shifting towards EVs and HEVs to reduce carbon emissions and meet regulatory standards, which is expected to drive the demand for lithium-ion batteries.
Moreover, the growing demand for renewable energy sources such as solar and wind power is expected to drive the demand for batteries in energy storage applications. Batteries can store excess energy generated from renewable sources and release it during periods of high demand, thereby enabling efficient use of renewable energy.
For Specific Research Requirements, Request Customization
Industry Dynamics
Growth Drivers
Rising use of EMD in EV batteries, the increasing demand for water treatment systems, and the growing demand for EMD in other applications are expected to drive the growth of the electrolytic manganese dioxide market in the coming years. use of electrolytic manganese dioxide (EMD) in electric vehicle (EV) batteries is one of the major drivers of the EMD market, particularly in the United States, where one in every three EVs in the world is currently located. EMD is used as a cathode material in the production of lithium-manganese-oxide (LMO) batteries, which are commonly used in EVs due to their high energy density, low cost, and long lifespan.
Stringent regulations regarding water treatment and the need for safe drinking water are driving the demand for effective water treatment technologies, including EMD-based systems. EMD is used as a coagulant in water treatment to remove impurities and contaminants, particularly in the removal of manganese, which can cause health and aesthetic issues in drinking water. Alkaline batteries are widely used in various low-drain devices, such as remote controls, flashlights, and toys, as they offer reliable and long-lasting power. In addition, alkaline batteries are also more environmentally friendly than some other types of batteries, as they do not contain toxic heavy metals such as cadmium and mercury.
Report Segmentation
The market is primarily segmented based on application, and region.
| By Application | By Region |
|
|
To Understand the Scope of this Report: Request Customization
Water treatment segment growing at the fastest rate in global market
Batteries segment garnered the largest revenue share. Segment’s growth is due to its the high run time and productivity of alkaline batteries, coupled with their low cost and environmental benefits, have led to their widespread adoption in developed economies such as the UK, the US, and Switzerland. Alkaline batteries offer a longer shelf life than other types of batteries, such as zinc-carbon batteries, and can provide a constant power supply over a broad range of current drains.
These batteries have witnessed an upsurge in demand over the past few years, particularly in developed economies such as the UK, the US, & Switzerland. Alkaline batteries are designed to provide long-lasting performance and are widely used in various electronic products, including clocks, radios, remote controls, and other low-drain devices. In addition, alkaline batteries are relatively inexpensive, making them a popular choice for low-cost electronic devices. They are also more environmentally friendly than some other types of batteries, as they do not contain toxic heavy metals such as cadmium and mercury.
Water treatment segment registered the highest growth over the study period. electrolytic manganese dioxide (EMD) is used in water treatment plants as an electrode material to separate impurities and waste from water. EMD has a high surface area and electrical conductivity, making it an effective material for electrochemical reactions in water treatment applications. Rising water contamination levels, and a growing demand for clean and safe drinking water. The increasing adoption of water purifiers in residential and industrial sectors is expected to drive the demand for EMD in the region over the foreseeable future.
North America is accounting the largest share in the global market
In the fiscal year 2022, North America is expected to lead the global market. EMD is a key material used in the cathodes of primary and secondary batteries, particularly lithium-ion batteries used in electric vehicles. EMD provides a high capacity for energy storage, excellent cycling stability, and improved safety, which makes it a popular choice for battery manufacturers. Moreover, EMD is also used in primary batteries, such as alkaline and zinc-carbon batteries, which are widely used in portable electronic devices. The rising demand for portable electronic devices, is also expected to drive the demand for EMD in the region.
Europe is second dominating region in the global market with significant revenue in the year of 2022. European government's investments in electric vehicle infrastructure and the growing awareness about environmental issues are expected to play a pivotal role in increasing the demand for battery-operated vehicles in the coming years.
European governments are investing heavily in the development of electric vehicle infrastructure, including the installation of lithium-ion battery charging stations, to encourage the adoption of electric vehicles and reduce carbon emissions. This is expected to play a pivotal role in increasing the demand for battery-operated vehicles in the coming years. The European Union has set ambitious targets to reduce carbon emissions and improve air quality, and the development of electric vehicles is seen as a key strategy to achieve these goals. Governments in Europe have been providing incentives and subsidies to encourage the adoption of electric vehicles, including tax incentives, purchase grants, and free parking and charging in some areas.
Competitive Insight
Companies in this market are focusing on product safety and quality, as EMD is a critical material used in the cathodes of primary and secondary batteries. To address these challenges, key companies are employing technologies & adopting value chains to achieve economies of scale for higher profit margins. For instance, some companies are investing in research and development to improve the efficiency and performance of EMD, while others are expanding their production capacities to meet the growing demand for EMD.
The global players include Tosoh Corp., Mesa Minerals (Mesa), Tronox Ltd., Prince International Corp., and American Manganese Inc.
Industry Developments
June 2025: Element 25 obtained AUD 32.6 million in state financing to double manganese concentrate capacity for downstream EMD processing.
March 2025: Chemours and Energy Fuels formed a U.S. critical-minerals alliance covering manganese refining.
January 2025: Giyani Metals won a 50-year SEZ license for its Botswana battery-grade plant.
Electrolytic Manganese Dioxide Market Report Scope
| Report Attributes | Details |
| Market size value in 2023 | USD 1.53 billion |
| Revenue forecast in 2032 | USD 2.79 billion |
| CAGR | 6.9% from 2023 – 2032 |
| Base year | 2022 |
| Historical data | 2019– 2021 |
| Forecast period | 2023– 2032 |
| Quantitative units | Revenue in USD billion and CAGR from 2023 to 2032 |
| Segments covered | By Application, By Region |
| Regional scope | North America, Europe, Asia Pacific, Latin America; Middle East & Africa |
| Key companies | Tosoh Corp., Mesa Minerals (Mesa), Tronox Ltd., Prince International Corp., and American Manganese Inc |
FAQ's
key companies in electrolytic manganese dioxide market are Tosoh Corp., Mesa Minerals (Mesa), Tronox Ltd., Prince International Corp., and American Manganese Inc.
The global electrolytic manganese dioxide market is expected to grow at a CAGR of 6.9% during the forecast period.
The electrolytic manganese dioxide market report covering key segments are application, and region.
key driving factors in electrolytic manganese dioxide market are favourable legislative norms and technological innovations.
The global electrolytic manganese dioxide market size is expected to reach USD 2.79 billion by 2032.
Research Methodology
A robust system of research, verification, and forecasting designed to ensure reliable and actionable market insights.
Polaris Market Research & Consulting, Inc. uses a clear and structured approach to deliver insights that clients can rely on. The process combines detailed primary and secondary research, including direct communication with industry experts. The detailed information helps build a complete picture of market trends and developments. Secondary data is gathered from credible sources such as industry reports, company filings, government source links, and trusted organization databases. It is then cross-checked through discussions with key stakeholders across the value chain. Market size and forecasts are developed using both bottom-up and top-down methods to ensure accuracy and consistency in the final results.
1. Project Setup
Step 1 & 2:
- We start every project by clearly understanding the client’s objective or goal, then defining the market scope, and aligning regions, segments, and timelines.
- Once the foundation is set, we collect data from all-around of sources, including company reports, government databases, and paid industry platforms.
- Our research is based on secondary data, which helps us build a strong understanding of the market across regions and industries. Then we validate this information through primary research by speaking directly with industry experts, companies, and stakeholders.
- By combining secondary and primary research, we ensure that our market insights are accurate, practical, and closely aligned with real market conditions.
2. Data Collection
We gather information from both public and verified sources:
3. Data Structuring
Step 3:
- All collected data is organized into a consistent format to ensure accurate analysis. Since inputs come from multiple sources, they are standardized and aligned before use.
- The data is segmented by product, application, and region, and mapped across a defined historical period (2020–2024). All values are converted into common units (USD Mn/Bn), and volume and pricing are aligned where required to estimate revenue.
- Any overlaps or inconsistencies are reviewed and adjusted to maintain accuracy (<5% variance threshold).
- The result is a structured dataset that allows for clear comparison across regions and supports reliable analysis and forecasting.
Structured Market Dataset, USD Mn/Bn
| Region | Segment | VolumeUnits | Avg PriceUSD | RevenueUSD Mn | Share % |
|---|---|---|---|---|---|
| North America | Product A | 250 | 2.5 | 500 | 15% |
| Product A | XX | XX | XX | XX | |
| Product A | XX | XX | XX | XX | |
| Consistent methodology applied across regions | |||||
4. Market Estimation
Step 4: TOP-DOWN APPROACH
- We start with the overall market size at a global or macro level.
- The market is then narrowed down based on scope and industry relevance.
- We apply penetration rates and split the data by region and segment.
- This helps us estimate the market size for specific segments.
- The numbers are validated through cross-checks to ensure accuracy.
Step 5: BOTTOM-UP APPROACH
- We begin by analyzing data from leading companies in the market.
- Revenue data is collected and mapped across different segments.
- The data is then aggregated to estimate the total market size.
- To fill in any gaps, adjustments are made based on industry standards.
- Validation checks make sure that the results are correct.
5. Forecasting
Step 6:
At Polaris Market Research & Consulting, Inc., we employ a methodical forecasting strategy. This approach blends the analysis of historical data with real-time market validation. To forecast future trends with precision, we examine past patterns, pricing fluctuations, and the interplay of supply and demand. To ensure our conclusions reflect the present market landscape, we actively seek input from industry experts and key stakeholders.
To refine our predictions, we carefully consider critical elements such as market drivers and restraints, fluctuations in raw material costs, emerging technologies, and the production capabilities of various regions. Furthermore, we assess regulatory frameworks and potential policy shifts to gauge their potential impact on market expansion.
All this information is synthesized to generate precise forecasts for each segment and region. These forecasts illuminate the current state of the market and highlight forthcoming opportunities.
6. Validation & Triangulation
Step 7:
In the final stage, we validate all our estimates using a triangulation method, where data is cross-checked from multiple reliable sources, like company data, primary interviews, and secondary research. This helps us make sure that our numbers are correct and fit with the rest of the market.
This process involves verifying data consistency across various segments and geographic areas. It also requires comparing historical trends with the assumptions support the forecast. Any discrepancies involve adjustments to ensure everything remains aligned and dependable.
Once the data is finalized, we prepare the final outputs, including market size estimates, segment-wise breakdowns, and growth metrics. These are delivered in structured formats such as tables, charts, and data files for easy analysis and use.
We collaborate closely with clients, ensuring the final products align with their requirements. This includes offering tailored adjustments, supplementary data analyses, and continuous assistance. Furthermore, we monitor market trends post-delivery, providing updates and refinements to maintain the insights' relevance as time passes.
Triangulation Framework
Estimates are cross-verified across three sources:
Company-level data
• Primary inputs from industry participants
• Secondary benchmarks and published data
Variance maintained within +5-10%
Adjustments applied to align estimates
Segment values validated against overall market structure
Data Consistency & Integrity
Segment totals validated to 100%
Regional estimates aligned with global market size
Historical trends compared against forecast outputs
Assumptions reviewed for cross-segment and regional alignment
Final Outputs
Deliverables
Client Alignment & Support
- Deliverables are aligned with defined client requirements and scope
- Custom data cuts and segment splits are incorporated as required
- Post-delivery queries are addressed through analyst interactions
- Additional clarifications and data support are provided upon request
Client Continuity & Updates
- Market developments are tracked post-delivery to capture changes in key trends
- Updated data and revisions are provided based on new market inputs
- Additional refinements and data cuts are shared as required
- Continued analyst engagement supports evolving client requirements
Download Sample Report of Electrolytic Manganese Dioxide Market
Please fill out the form to request a customized copy of the research report.
