
Pipette Calibrators Market Size, Share, Trends Report | 2024-2032
REPORT DETAILS
REPORT DETAILS
ABOUT THIS REPORT
Market Statistics
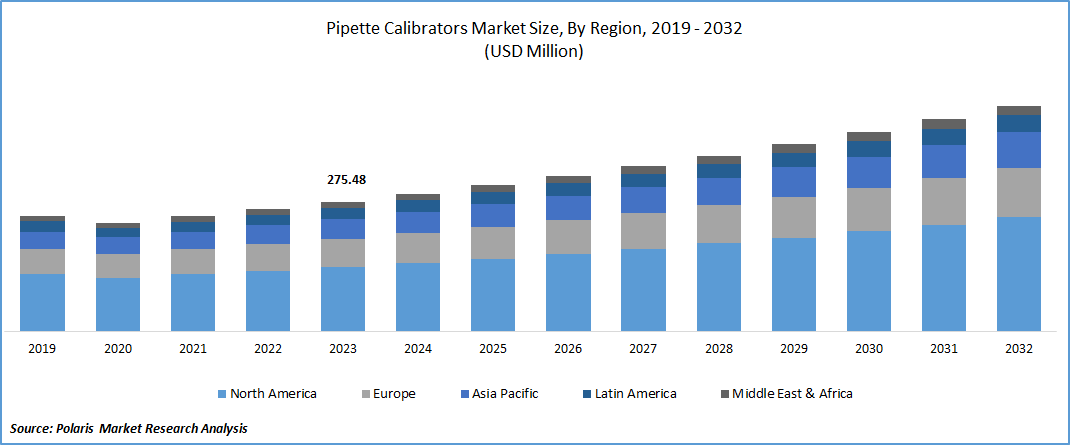
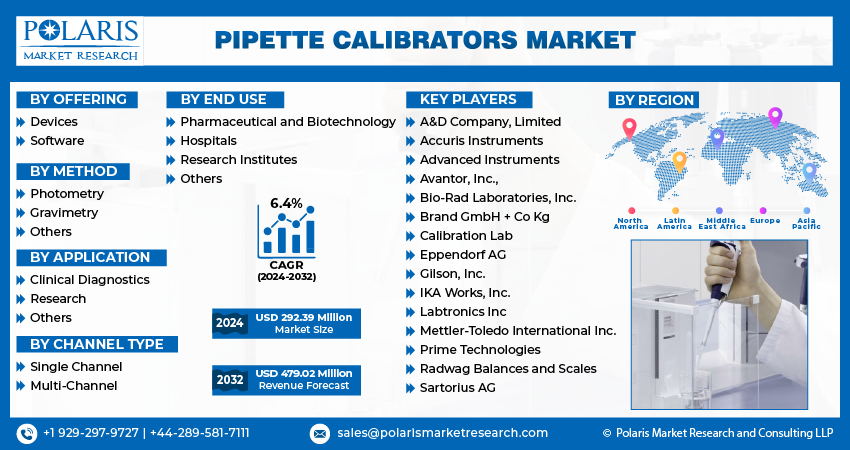
Pipette Calibrators Market size was valued at USD 275.48 million in 2023. The market is anticipated to grow from USD 292.39 million in 2024 to USD 479.02 million by 2032, exhibiting the CAGR of 6.4% during the forecast period.
Market Introduction
The escalating trend of laboratory automation is a key factor propelling the pipette calibrators market size. Laboratories are increasingly turning to automation to boost efficiency, accuracy, and productivity. Automated systems offer advantages like reduced labor costs and minimized errors, driving their adoption. Pipette calibrators are essential in this process, ensuring the accuracy of pipettes used in liquid handling tasks. With automated liquid handling systems becoming more prevalent, the demand for reliable calibrators has surged. These tools guarantee optimal performance, delivering precise volumes crucial for various laboratory applications. Integration of advanced technologies like robotics and AI further enhances calibration processes, driving market growth to meet the demands of modern laboratory automation.
To Understand More About this Research: Download Sample Report
In addition, companies operating in the market are introducing new products to expand market reach and strengthen presence.
For instance, in January 2023, Radwag Balances and Scales introduced the AP-12.1.5Y, the inaugural automated tool engineered to calibrate both single and multi-channel micropipettes with an accuracy of 1 µg, adhering to ISO 8655 specifications.
Technological innovations are influencing the pipette calibrators market trend, enhancing laboratory precision and efficiency. Automation, including automated calibration and real-time monitoring, reduces errors and boosts productivity. Integration with laboratory information systems streamlines data management, improving workflow. Miniaturization and portability cater to field research and point-of-care testing demands. Enhanced connectivity enables remote monitoring and collaboration. Moreover, the rise of digitalization and artificial intelligence introduces smart calibrators capable of self-learning and adaptive calibration. These advancements ensure accuracy, reliability, and compliance with regulatory standards.
Industry Growth Drivers
Advancements in Biotechnology and Pharmaceutical Research are Projected to Spur the Product Demand
Advancements in biotechnology and pharmaceutical research have heightened the demand for precise laboratory equipment, notably pipette calibrators. These instruments ensure accuracy in critical procedures like DNA sequencing and drug discovery. The pharmaceutical industry's focus on precision medicine and automation has intensified this demand, requiring highly accurate calibrators. Technological innovations in these devices, including automated calibration and real-time monitoring, meet stringent regulatory standards. As research in biotechnology and pharmaceuticals progresses, the market is poised for sustained growth, driven by the need for reliable instruments supporting scientific breakthroughs.
Rising Demand for Quality Control in Healthcare is Expected to Drive Pipette Calibrators Market Growth
The healthcare sector's escalating need for quality control has spurred the growth of the pipette calibrators market share. These devices are essential for ensuring the accuracy of pipettes used in diagnostic procedures. With healthcare standards becoming more stringent, precise measurements are indispensable for accurate diagnoses and effective treatments. As a result, healthcare facilities are increasingly investing in advanced pipette calibrators to maintain rigorous quality control. Automated calibrators, equipped with cutting-edge technology, have streamlined the calibration process, minimizing errors and enhancing efficiency.
Industry Challenges
High Initial Investment Cost is Likely to Impede the Market Growth
High initial investment costs act as a limiting factor in the market. While essential for ensuring accurate pipette measurements, the upfront expenses for purchasing calibration systems and training personnel can be prohibitive for smaller laboratories. Ongoing maintenance costs further add to the overall expenses. Consequently, some facilities may resort to manual calibration methods or outsourcing services to mitigate costs, despite potential accuracy risks. Thus, while demand for pipette calibrators remains strong, market growth may be hampered by financial constraints faced by potential buyers, particularly those with limited budgets.
Report Segmentation
The pipette calibrators market analysis is primarily segmented based on offering, method, channel type, application, end use, and region.
| By Offering | By Method | By Application | By Channel Type | By End Use | By Region |
|
|
|
|
|
|
To Understand the Scope of this Report:Request Customization
By Offering Analysis
Devices Segment Held Significant Market Revenue Share in 2023
The devices segment held significant revenue share in 2023 due to its indispensable role in maintaining accuracy and compliance in laboratories. With increasing adoption driven by technological advancements, stringent regulatory requirements, and growing laboratory infrastructure globally, demand remains robust. Advanced features such as digital interfaces and automated processes attract customers seeking efficiency and reliability. In emerging markets, expanding healthcare and life sciences sectors further propel demand. Intense competition among established players fuels innovation, driving sustained revenue growth.
By Method Analysis
Photometry Plays a Significant Role in the Market
Photometry plays a significant role in the market. It ensures accuracy by precisely measuring light absorption or emission, crucial for verifying pipette volumes. Calibration validation is achieved through photometric methods, ensuring correct liquid dispensing. Photometric standards establish reference points, enhancing calibration reliability and consistency. The traceable data provided by photometric measurements aligns with international standards, vital for regulatory compliance. Integration into automated systems streamlines calibration processes, particularly beneficial for high-throughput labs. Photometry is especially useful for calibrating multi-channel pipettes, ensuring uniformity. Real-time monitoring enables immediate adjustments, enhancing quality control.
By Application Analysis
Research Segment Held Significant Market Revenue Share in 2023
The research segment held significant revenue share in 2023. Increasing research and development activities, stringent regulatory standards, and advancements in life sciences research drive demand. Quality assurance requirements in research settings emphasize the necessity for precise calibration. As research initiatives become more intricate, reliance on accurate pipette measurements grows. Moreover, continuous technological advancements and increasing funding for scientific research further propel market growth. Education and awareness initiatives also contribute to the demand, as educational institutions require reliable pipette calibrators for teaching and training purposes.
By End Use Analysis
Pharmaceutical and Biotechnology Segment Held Significant Revenue Share in 2023
The pharmaceutical and biotechnology segment held significant revenue share in 2023 due to stringent regulatory standards and the critical need for precision in dosage preparation, quality control, and research. These industries rely heavily on accurate pipetting for high-throughput operations, research, and development of new drugs and therapies. Pipette calibrators play a pivotal role in maintaining accuracy and ensuring compliance with quality assurance protocols. With continual industry growth, driven by aging populations and biotechnological advancements, demand for calibration equipment remains robust.

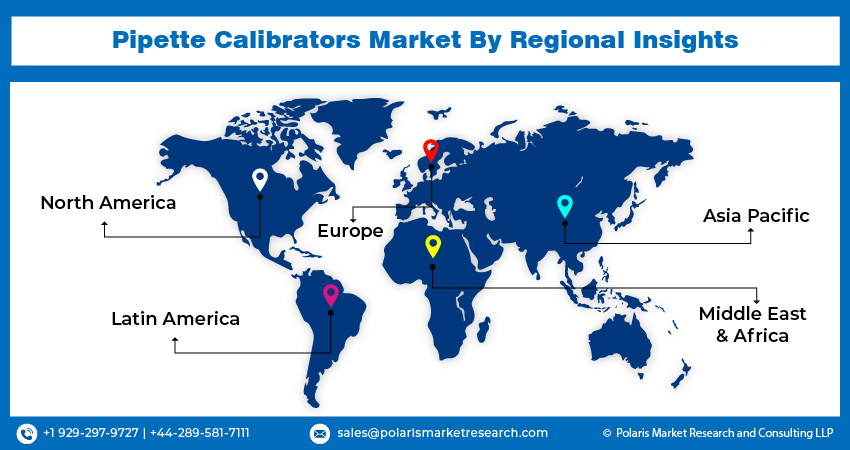
Regional Insights
In 2023, North America Region Accounted for a Significant Market Share
In 2023, North America region accounted for a significant market share owing to technological innovation, stringent regulations, and the presence of key industry players. The region's advanced healthcare infrastructure, coupled with substantial investments in research and development, drives demand for precise calibration equipment. Strong adoption of automation, coupled with collaborative efforts between academia and industry, further boosts market growth. With a focus on compliance and quality, North American laboratories prioritize the use of high-quality pipette calibrators. Additionally, the region's well-established networks for information dissemination and education contribute to heightened market awareness.
Asia-Pacific is expected to experience growth during the forecast period. The region's expanding biotechnology and pharmaceutical industries drive demand for precise laboratory equipment. Increasing research and development activities, particularly in countries like China, India, and Japan, fuel market growth. Rising investments in healthcare infrastructure and research facilities contribute to heightened demand for pipette calibrators. Supportive government initiatives, coupled with the burgeoning life sciences sector, create a conducive environment for market growth in the Asia-Pacific region.
Key Market Players & Competitive Insights
The pipette calibrators market boasts a diverse array of participants, and the expected entry of new competitors is poised to intensify competitive dynamics. Leading players in the industry continuously enhance their technologies, seeking to maintain a competitive advantage by emphasizing efficiency, reliability, and safety. These organizations prioritize strategic actions, including forming alliances, improving product portfolios, and participating in collaborative ventures. Their primary objective is to outperform competitors in the field, securing a significant pipette calibrators market share.
Some of the major players operating in the global pipette calibrators market include:
- A&D Company, Limited
- Accuris Instruments
- Advanced Instruments
- Avantor, Inc.,
- Bio-Rad Laboratories, Inc.
- Brand GmbH + Co Kg
- Calibration Lab
- Eppendorf AG
- Gilson, Inc.
- IKA Works, Inc.
- Labtronics Inc
- Mettler-Toledo International Inc.
- Prime Technologies
- Radwag Balances and Scales
- Sartorius AG
Recent Developments
- In April 2023, Mettler Toledo launched the XPR Multichannel Pipette Calibration Balance, XPR105MCP as a high-speed solution for ISO 8655-compliant calibration of multichannel pipettes.
- In February 2024, the Eppendorf Group broadened its reach by inaugurating a new facility in South Africa dedicated to sales and service operations. This new establishment encompasses a modern pipette calibration facility, complete with a service workshop, and a customer experience center designed to exhibit Eppendorf instruments.
Report Coverage
The pipette calibrators market report emphasizes on key regions across the globe to provide better understanding of the product to the users. Also, the report provides market insights into recent developments, trends and analyzes the technologies that are gaining traction around the globe. Furthermore, the report covers in-depth qualitative analysis pertaining to various paradigm shifts associated with the transformation of these solutions.
The report provides detailed analysis of the market while focusing on various key aspects such as competitive analysis, offerings, methods, applications, end uses, and their futuristic growth opportunities.
Pipette Calibrators Market Report Scope
| Report Attributes | Details |
| Market size value in 2024 | USD 292.39 million |
| Revenue forecast in 2032 | USD 479.02 million |
| CAGR | 6.4% from 2024 – 2032 |
| Base year | 2023 |
| Historical data | 2019 – 2022 |
| Forecast period | 2024 – 2032 |
| Quantitative units | Revenue in USD million and CAGR from 2024 to 2032 |
| Segments covered |
|
| Regional scope |
|
| Competitive Landscape |
|
| Report Format |
|
| Customization | Report customization as per your requirements with respect to countries, region, and segmentation. |
FAQ's
Pipette Calibrators Market Size Worth $ 479.02 Million By 2032
The top market players in Pipette Calibrators Market are Radwag Balances and Scales, Mettler-Toledo International Inc., Bio-Rad Laboratories
North America is the region contribute notably towards the Pipette Calibrators Market
Pipette Calibrators Market exhibiting the CAGR of 6.4% during the forecast period.
Pipette Calibrators Market report covering key segments are offering, method, channel type, application, end use, and region.
Research Methodology
A robust system of research, verification, and forecasting designed to ensure reliable and actionable market insights.
Polaris Market Research & Consulting, Inc. uses a clear and structured approach to deliver insights that clients can rely on. The process combines detailed primary and secondary research, including direct communication with industry experts. The detailed information helps build a complete picture of market trends and developments. Secondary data is gathered from credible sources such as industry reports, company filings, government source links, and trusted organization databases. It is then cross-checked through discussions with key stakeholders across the value chain. Market size and forecasts are developed using both bottom-up and top-down methods to ensure accuracy and consistency in the final results.
1. Project Setup
Step 1 & 2:
- We start every project by clearly understanding the client’s objective or goal, then defining the market scope, and aligning regions, segments, and timelines.
- Once the foundation is set, we collect data from all-around of sources, including company reports, government databases, and paid industry platforms.
- Our research is based on secondary data, which helps us build a strong understanding of the market across regions and industries. Then we validate this information through primary research by speaking directly with industry experts, companies, and stakeholders.
- By combining secondary and primary research, we ensure that our market insights are accurate, practical, and closely aligned with real market conditions.
2. Data Collection
We gather information from both public and verified sources:
3. Data Structuring
Step 3:
- All collected data is organized into a consistent format to ensure accurate analysis. Since inputs come from multiple sources, they are standardized and aligned before use.
- The data is segmented by product, application, and region, and mapped across a defined historical period (2020–2024). All values are converted into common units (USD Mn/Bn), and volume and pricing are aligned where required to estimate revenue.
- Any overlaps or inconsistencies are reviewed and adjusted to maintain accuracy (<5% variance threshold).
- The result is a structured dataset that allows for clear comparison across regions and supports reliable analysis and forecasting.
Structured Market Dataset, USD Mn/Bn
| Region | Segment | VolumeUnits | Avg PriceUSD | RevenueUSD Mn | Share % |
|---|---|---|---|---|---|
| North America | Product A | 250 | 2.5 | 500 | 15% |
| Product A | XX | XX | XX | XX | |
| Product A | XX | XX | XX | XX | |
| Consistent methodology applied across regions | |||||
4. Market Estimation
Step 4: TOP-DOWN APPROACH
- We start with the overall market size at a global or macro level.
- The market is then narrowed down based on scope and industry relevance.
- We apply penetration rates and split the data by region and segment.
- This helps us estimate the market size for specific segments.
- The numbers are validated through cross-checks to ensure accuracy.
Step 5: BOTTOM-UP APPROACH
- We begin by analyzing data from leading companies in the market.
- Revenue data is collected and mapped across different segments.
- The data is then aggregated to estimate the total market size.
- To fill in any gaps, adjustments are made based on industry standards.
- Validation checks make sure that the results are correct.
5. Forecasting
Step 6:
At Polaris Market Research & Consulting, Inc., we employ a methodical forecasting strategy. This approach blends the analysis of historical data with real-time market validation. To forecast future trends with precision, we examine past patterns, pricing fluctuations, and the interplay of supply and demand. To ensure our conclusions reflect the present market landscape, we actively seek input from industry experts and key stakeholders.
To refine our predictions, we carefully consider critical elements such as market drivers and restraints, fluctuations in raw material costs, emerging technologies, and the production capabilities of various regions. Furthermore, we assess regulatory frameworks and potential policy shifts to gauge their potential impact on market expansion.
All this information is synthesized to generate precise forecasts for each segment and region. These forecasts illuminate the current state of the market and highlight forthcoming opportunities.
6. Validation & Triangulation
Step 7:
In the final stage, we validate all our estimates using a triangulation method, where data is cross-checked from multiple reliable sources, like company data, primary interviews, and secondary research. This helps us make sure that our numbers are correct and fit with the rest of the market.
This process involves verifying data consistency across various segments and geographic areas. It also requires comparing historical trends with the assumptions support the forecast. Any discrepancies involve adjustments to ensure everything remains aligned and dependable.
Once the data is finalized, we prepare the final outputs, including market size estimates, segment-wise breakdowns, and growth metrics. These are delivered in structured formats such as tables, charts, and data files for easy analysis and use.
We collaborate closely with clients, ensuring the final products align with their requirements. This includes offering tailored adjustments, supplementary data analyses, and continuous assistance. Furthermore, we monitor market trends post-delivery, providing updates and refinements to maintain the insights' relevance as time passes.
Triangulation Framework
Estimates are cross-verified across three sources:
Company-level data
• Primary inputs from industry participants
• Secondary benchmarks and published data
Variance maintained within +5-10%
Adjustments applied to align estimates
Segment values validated against overall market structure
Data Consistency & Integrity
Segment totals validated to 100%
Regional estimates aligned with global market size
Historical trends compared against forecast outputs
Assumptions reviewed for cross-segment and regional alignment
Final Outputs
Deliverables
Client Alignment & Support
- Deliverables are aligned with defined client requirements and scope
- Custom data cuts and segment splits are incorporated as required
- Post-delivery queries are addressed through analyst interactions
- Additional clarifications and data support are provided upon request
Client Continuity & Updates
- Market developments are tracked post-delivery to capture changes in key trends
- Updated data and revisions are provided based on new market inputs
- Additional refinements and data cuts are shared as required
- Continued analyst engagement supports evolving client requirements
Download Sample Report of Pipette Calibrators Market Size, Share, Trends Report | 2024-2032
Please fill out the form to request a customized copy of the research report.
