
Global Riot Control System Market Size, Share Analysis Report, 2023-2032
REPORT DETAILS
The global riot control system market was valued at USD 9.96 billion in 2022 and is expected to grow at a CAGR of 4.54% during the forecast period. A riot control system is a method for managing, arresting, and removing participants in a protest, demonstration, or riot. They are typically utilized by the military and law enforcement to stop and manage riots and other acts of public violence. It is made up of substances like lacrimators, tear gases, and irritants that burn excessively and painfully when they come into contact with skin or mucous membranes. Helmets, knee pads, riot shields, gas masks, neck protection, and body armor are further components of these systems.
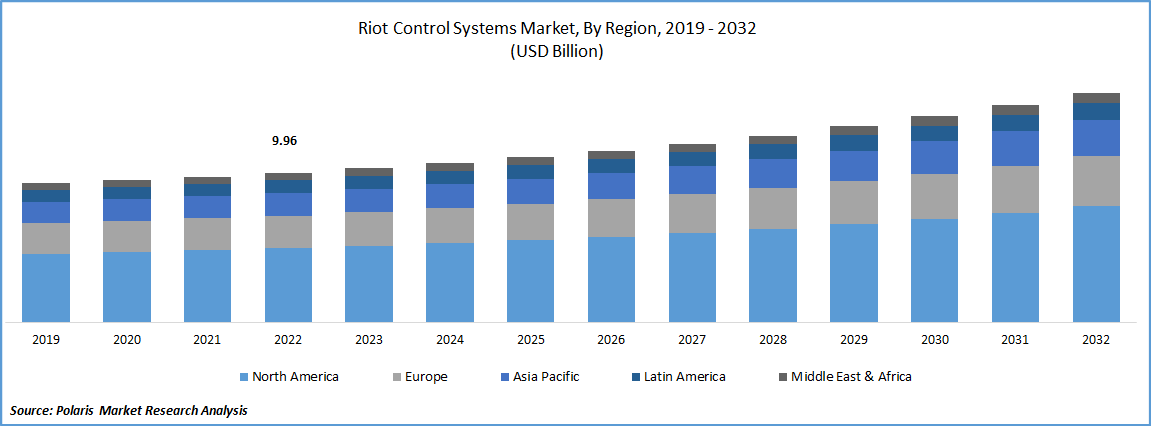
Source: Polaris Market Research Analysis
To Understand More About this Research: Download Sample Report
Major violence and riots are developing as a result of the escalating dissatisfaction with local governments in various nations, which is fueling the market for riot control equipment. In January 2021, The Los Angeles Police Department (LAPD) bought 5,260 TASER 7 energy weapons and 355 Axon Body 3 cameras as part of the Los Angeles Police Department's (LAPD) 5-year contract renewal with Axon. The LAPD currently has the most TASER 7 energy weapons and Axon body cameras deployed in the United States, with a total of 7,355 deployed.
Additionally, it is anticipated that the Internet of Things (IoT), machine learning (ML), and control system integration with the cloud would drive the market during the anticipated years. In November 2021, The unique GAL Versatile Protective Suit (VPS), introduced by Israel Weapon Industries, broadened the company's selection of riot-control options. The compact, wearable protective system is intended to be flexible enough to be used in any situation while protecting forces and ensuring public order. In addition, market growth is being boosted by the execution of favorable government policies to reduce domestic insurgencies and advance national security.
Source: Polaris Market Research Analysis
For Specific Research Requirements, Download Sample Report
Industry Dynamics
Growth Drivers
Development of less-lethal weapons as well as the use of unmanned aerial vehicles for surveillance and offensive tasks, such as dropping low speed ammunition, pepper sprays, & other weapons, could assist the riot control system market expansion throughout the projection period. For instance, in December 2018, to deal with law and order problems in the state, the Jammu and Kashmir police scheduled to receive anti-riot gas masks and non-lethal pepper-ball launching equipment.
Pepper-ball launching device, contains a powdered chemical having pepper spray, irritates the eyes & nose. These non-lethal projectiles are launched by specialized "forced compliance weapons" or repurposed paintball guns. During riots and other situations requiring law and order, the anti-riot gas mask is worn to guard against breathing in airborne contaminants, toxic gases, and pepper spray.
Furthermore, in February 2023, Indian Army received consignement of its UAV system to be used in the battlefield, enhancing its offensive capability. The swarming systems, which were purchased under emergency procurement (EP), demonstrate how India has assumed a leading position in the world by introducing cutting-edge "Made in India" technology. The advantage of such a swarm is that it can reorganize or self-heal to continue carrying out the mission until the last UAV is in the air if one drone crashes or a few crash owing to enemy countermeasures. Therefore, these developments of advanced less lethal weapons with technology development for the surveillance of offensive tasks across the globe are driving the growth of the market over the forecast period.
Report Segmentation
The market is primarily segmented based on product, technology, end-user, and region.
| By Product | By Technology | By End-User | By Region |
|
|
|
|
Source: Polaris Market Research Analysis
For Specific Research Requirements: Request for Customized Report
The offensive Weapons segment is expected to witness the fastest growth during forecast period
During the forecast period, the offensive equipment segment is anticipated to have the greatest CAGR. The amount spent on police protection increased in all nations. Spending on police protection is rising as a result of more violent protests and mass shooting incidents across the US.
Armed forces have also been used in circumstances that called for extreme restraint. As a result, it is necessary to use force while minimizing casualties, which emphasizes the requirement for cutting-edge riot control tools. The technology and tactics of future weapons may be important. Optical distractors, active denial technology, lasers, laser-induced plasmas, and concentrated acoustics are a few of the riot control tools that are currently being developed. An electroshock weapon called a laser-induced plasma channel (LIPC) uses lasers to ionize gases into plasma when they are blasted into the atmosphere, creating a path for electricity. This segment's growth is anticipated to be supported by cutting-edge offensive riot control equipment during the forecast period.
Law Enforcement accounted for the largest market share in 2022
The law enforcement segment is growing due to the rising adoption of these systems by them. Law enforcement organizations must purchase and use riot control equipment in response to several protests. The growing political tensions and protests in US cities have raised the demand for riot control equipment. Occasionally occurring riots and civil unrest, such as marches and protests in Canadian cities, have also forced police forces to utilize less-lethal weaponry, which will all contribute to the market's expansion.
The government investment in the purchase of anti-riot control systems is also boosting growth. In June 2022, Iran's police have equipped their law enforcement agencies with anti-riot gear worth approximately $10 million, including specialized armored vehicles, amid an upsurge in rallies across the country. The new tools and vehicles are intended to "strengthen the security of the country" and will aid operative units in better carrying out their tasks. Some of the new equipment gives police forces "self-protection" while on duty in addition to improving operational mobility. During the projection period, law enforcement agencies' purchases of riot-control equipment are anticipated to be driven by growth.
The demand in Europe is expected to witness significant growth during projected timeframe
The projection period is expected to see the highest growth in the European area. Due to discontent with the government, several European nations, including France, the United Kingdom, Greece, Romania, and Belgium, among others, are experiencing riots and demonstrations. In May 2022, thousands of people marched across France in support of pay raises and a repeal of Macron's proposal to raise the retirement age. The march turned violent, prompting the police to use tear gas to repress anarchists in black who were looting Parisian businesses.
Furthermore, 50,000 people demonstrated against coronavirus limitations in Brussels in January 2022; during this demonstration, demonstrators battled with police and vandalized the offices of the European External Action Service, the EU's diplomatic mission. Such more frequent occurrences in this area are encouraging the purchase and use of riot control tools.
The North American region is expected to grow faster in the market. Due to its frequent and widespread riots, the US is one of the most active users of riot control technology. Extensive deployment of military and law enforcement officers. To manage the gathering, several police officers encountered equipment limitations. It is anticipated that these variables will lead to increased equipment purchases in the future. Several research and development projects are also being carried out in the nation to create superior non-lethal weaponry and other riot control tools.
Competitive Insight
- Amtec Less Lethal Systems
- Axon Enterprise
- Armament Systems
- B&T AG
- BAE Systems
- Blackhawk
- Combined Systems
- Condor Non-lethal Technologies
- Desert Wolf
- Etienne Lacroix
- Eagle Industries
- Lamperd Less Lethal
- Non Lethal Technologies
- Pacem Defense
- Genasys
- Raytheon Technologies
- Safariland
- Security Devices International.
Recent Developments
- In May 2022, Axon and Fusus joined forces intending to deliver comprehensive, mission-critical intelligence for the community's and officers' safety. While concurrently addressing community needs, the two businesses will help the police department's operational procedures.
Riot Control System Market Report Scope
| Report Attributes | Details |
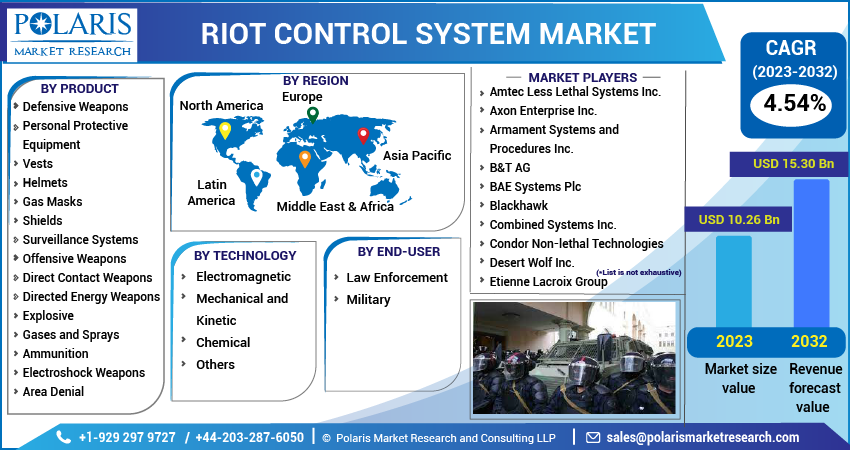
| Market size value in 2023 | USD 10.26 billion |
| Revenue Forecast in 2032 | USD 15.30 billion |
| CAGR | 4.54% from 2023 - 2032 |
| Base year | 2022 |
| Historical data | 2019 - 2021 |
| Forecast period | 2023 - 2032 |
| Quantitative units | Revenue in USD billion and CAGR from 2023 to 2032 |
| Segments Covered | By Technology, By Product, By End-User, By Region |
| Regional scope | North America, Europe, Asia Pacific, Latin America; Middle East & Africa |
| Key Companies | Amtec Less Lethal Systems Inc., Axon Enterprise Inc., Armament Systems and Procedures Inc., B&T AG, BAE Systems Plc, Blackhawk, Combined Systems Inc., Condor Non-lethal Technologies, Desert Wolf Inc., Etienne Lacroix Group, Eagle Industries Inc., Lamperd Less Lethal Inc., NonLethal Technologies Inc., Pacem Defense, Genasys Inc., Raytheon Technologies Corporation, Safariland LLC, and Security Devices International Inc. |
Source: Polaris Market Research Analysis
Riot Control System Market FAQ's
The riot control system market report covering key segments are product, technology, end-user, and region.
Riot Control System Market Size Worth $17.24 Billion By 2032.
The global riot control system market is expected to grow at a CAGR of 4.65% during the forecast period.
Europe is leading the global market.
key driving factors in riot control system market are rising defense expenditures of emerging economies.
Download Sample Report of Riot Control System Market
Please fill out the form to request a customized copy of the research report.
