
U.S. Power Factor Correction Market Industry Report, 2025-2034
REPORT DETAILS
U.S. Power Factor Correction Market Summary
The U.S. power factor correction (PFC) market size was valued at USD 646.91 million in 2024 and is anticipated to register a CAGR of 6.5% from 2025 to 2034. The market growth is mainly driven by the increasing focus on energy efficiency and cost savings across industries. Also, rising focus on grid modernization and improving overall power quality across the electrical infrastructure fuel the market expansion.
Market Statistics
The U.S. power factor correction market involves solutions that improve the efficiency of electrical power usage. These solutions work by reducing reactive power, which does not perform useful work, thereby optimizing electricity consumption and improving the overall stability of electrical systems.
The increasing adoption of advanced manufacturing techniques and industrial automation across various sectors in the country propels the growth of the U.S. power factor correction market. Modern industrial equipment, such as robotics, variable frequency drives (VFDs), and other complex machinery, often introduce non-linear loads into electrical systems. These loads can cause harmonic distortions and lead to a poor power factor, negatively impacting power quality, increasing energy losses, and potentially damaging sensitive equipment.
The escalating focus on grid modernization and improving overall power quality across the U.S. electrical infrastructure serves as a major driver for the power factor correction market expansion. As the grid evolves to incorporate more distributed energy resources such as solar and wind, and as older infrastructure is upgraded, maintaining stable and high-quality power becomes paramount. Poor power quality, including issues such as voltage sags, swells, and harmonics, can lead to equipment malfunctions, downtime, and significant financial losses for businesses.
Source: Polaris Market Research Analysis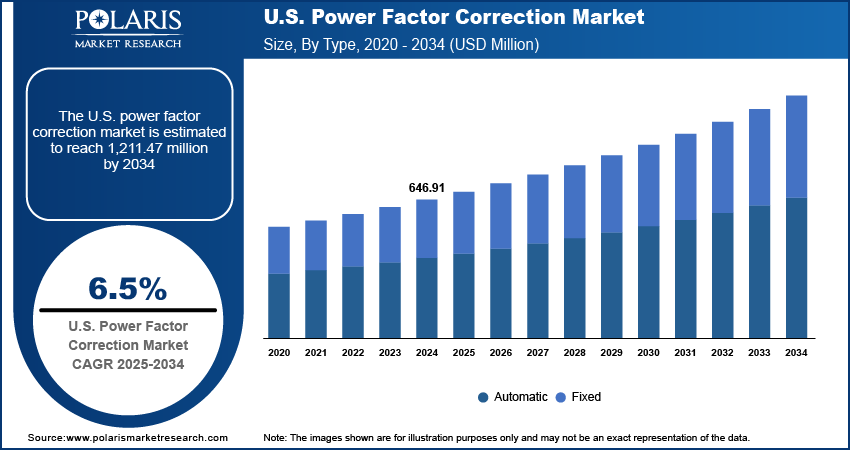
To Understand More About this Research: Download Sample Report
Industry Dynamics
Growing Emphasis on Energy Efficiency
The increasing focus on energy efficiency propels the U.S. power factor correction market growth. Businesses and industries are actively seeking ways to reduce their energy consumption, driven by both environmental concerns and the desire to lower operational costs. Power factor correction equipment helps achieve this by optimizing the use of electrical power, ensuring that reactive power, which does no useful work, is minimized. This leads to more efficient energy utilization and reduced waste within electrical systems.
The U.S. Department of Energy (DOE) has consistently highlighted the importance of industrial energy efficiency. According to the DOE's Industrial Assessment Centers, nationwide assessments observed average electricity consumption savings of 13% in client food, paper, and various manufacturing facilities. These types of savings underscore the significant potential for improved energy efficiency within industrial settings, which power factor correction systems directly address. This continuous push for more efficient energy use across industrial and commercial sectors strongly drives the demand for power factor correction solutions.
Rising Electricity Costs and Utility Penalties
Another significant driver is the steady increase in electricity costs and the penalties imposed by utility companies for a low power factor. When a facility operates with a poor power factor, it draws more reactive power from the grid, leading to higher overall current and increased strain on the utility's infrastructure. To compensate for this inefficiency and the associated costs, many electricity providers charge additional fees or demand charges to customers with power factors below a certain threshold.
By installing power factor correction systems, businesses can improve their power factor closer to unity, which reduces these excess charges and lowers their overall electricity bills. For example, the U.S. Energy Information Administration (EIA) regularly reports on electricity prices, showing a general trend of increasing costs over time for commercial and industrial sectors, making any strategy to reduce consumption more attractive. The direct financial incentive to avoid penalties and reduce monthly electricity expenses makes power factor correction a compelling investment, thus propelling its adoption in the U.S. market.
Source: Polaris Market Research Analysis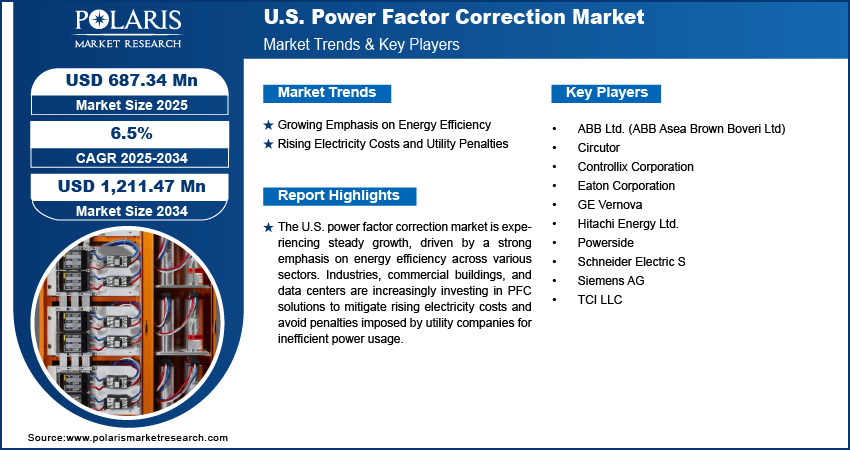
To Understand More About this Research: Download Sample Report
Segmental Insights
Reactive Power Analysis
The 0–200 KVAR segment held the largest share in 2024, primarily due to its widespread applicability across a broad range of small to medium-sized commercial and industrial settings. Facilities such as offices, retail stores, small manufacturing units, and even certain residential applications often have electrical loads that fall within this reactive power range. The relatively lower cost and ease of installation associated with these smaller capacity systems make them highly accessible and a preferred choice for numerous businesses seeking to improve their energy efficiency without significant upfront investment. This segment's dominance reflects the vast number of establishments that can benefit from these more modest power factor correction solutions.
The above 1500 KVAR segment is anticipated to register the highest growth rate during the forecast period. This growth is driven by the increasing demand from heavy industries, large-scale manufacturing plants, data centers, and critical infrastructure where very high reactive power compensation is necessary. As these sectors expand and become more reliant on complex machinery and high-power electrical equipment, the need for robust and high-capacity PFC solutions becomes paramount to maintain power grid stability, ensure power quality, and avoid substantial penalties from utilities. The continuous expansion and modernization of industrial facilities, coupled with the rising energy demands of large commercial operations, are propelling the growth of the high-capacity segment.
Type Analysis
The automatic segment held the largest share in 2024. Automatic power factor correction (APFC) systems can adapt in real-time to changing load conditions within an electrical system. Industries and large commercial facilities often experience fluctuating power demands throughout the day, due to the varied operation of machinery, lighting, and other equipment. APFC systems automatically switch capacitor banks in or out as needed to maintain an optimal power factor, ensuring consistent energy efficiency and helping to avoid penalties from utility providers. This dynamic adjustment capacity makes them ideal for complex and variable industrial settings.
The automatic segment is anticipated to register the highest growth rate during the forecast period. This accelerated growth is fueled by the increasing complexity of modern electrical loads and the rising need for precise power quality management. Many industrial processes involve advanced automation, robotics, and sensitive electronics that require a stable power supply, which APFC systems can provide by continuously correcting for reactive power. The ability of APFC systems to offer real-time power factor optimization, reduce energy wastage, and enhance the lifespan of electrical equipment makes them a preferred solution for businesses investing in reliable and efficient power infrastructure for future growth.
Sales Channel Analysis
The distributors sales channel held the largest share in 2024, due to their extensive networks, localized presence, and ability to serve a wide array of smaller and medium-sized businesses across diverse geographies. Distributors often provide valuable services beyond just selling the product, such as technical support, inventory management, and post-sales service, which are crucial for specialized equipment such as power factor correction systems. Their established relationships with a broad customer base and their capability to offer readily available products make them the preferred choice for many buyers, ensuring widespread market penetration for manufacturers.
The OEM direct segment is anticipated to register the highest growth rate during the forecast period. The growth is driven by the increasing demand for highly customized and integrated power factor correction solutions, particularly from large industrial clients and complex projects. Original Equipment Manufacturers (OEMs) can offer direct technical expertise, tailored engineering, and seamless integration of PFC systems into larger electrical infrastructure or original equipment. As industries become more sophisticated and demand specialized, high-performance power quality solutions, direct engagement with the OEM allows for better collaboration, direct technical support, and the development of bespoke solutions that precisely meet unique operational requirements.
Application Analysis
The commercial segment held the largest share in 2024, owing to the sheer volume and diverse nature of commercial establishments, including offices, retail outlets, hospitals, and educational facilities. These buildings utilize a vast array of electrical equipment, from lighting and HVAC systems to computers and various appliances, all of which contribute to inductive loads and a lower power factor. The continuous drive to reduce operating costs and improve energy efficiency within these numerous commercial environments makes them the largest consumers of power factor correction solutions.
The data center segment is anticipated to record the highest growth rate during the forecast period. This strong growth is fueled by the exponential increase in digital activities, cloud services, and the demand for data processing, leading to the rapid expansion of data center infrastructure. Data centers are incredibly power-hungry, operating continuously with high-density server racks and extensive cooling systems, which necessitate optimal power quality and efficiency to prevent downtime and manage substantial energy expenses. The ongoing investments in building new data centers and upgrading existing ones, especially with the surge in AI and related technologies, significantly drives the demand for advanced power factor correction.
Source: Polaris Market Research Analysis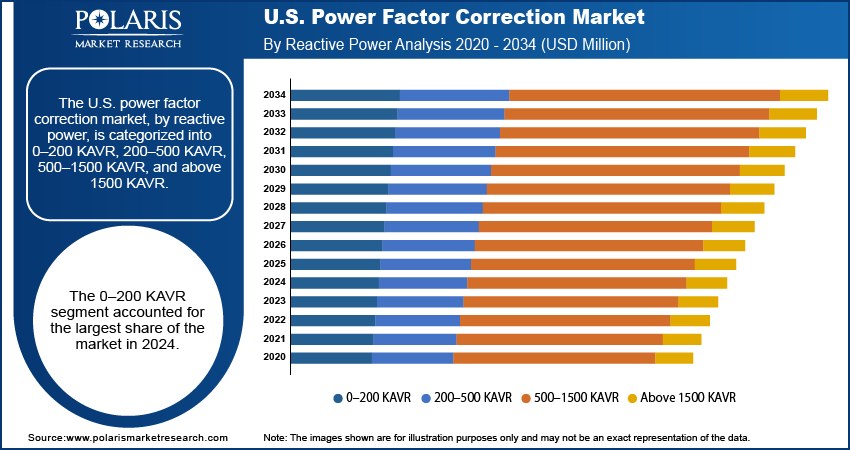
To Understand More About this Research: Request Customization
Key Players and Competitive Insights
The competitive landscape of the U.S. power factor correction market is marked by a mix of established global players and specialized regional companies. These firms constantly innovate, offering a range of solutions from basic capacitor banks to advanced active power factor correction systems, all while focusing on product reliability, efficiency, and customer support. Competition also revolves around pricing strategies and the ability to provide tailored solutions for diverse industrial and commercial needs.
A few prominent companies in the industry include ABB Ltd., Schneider Electric SE, Eaton Corporation, Siemens AG, GE Vernova, Hitachi Energy Ltd., TCI LLC, Powerside, Controllix Corporation, and Circutor.
Key Players
- ABB Ltd. (ABB Asea Brown Boveri Ltd)
- Circutor
- Controllix Corporation
- Eaton Corporation
- GE Vernova
- Hitachi Energy Ltd.
- Powerside
- Schneider Electric S
- Siemens AG
- TCI LLC
Industry Developments
In July 2024, Hillcrest Energy Technologies initiated a demonstration and testing program featuring its Zero Voltage Switching (ZVS) technology. The prototype aims to showcase the potential of ZVS in enhancing power factor correction applications.
U.S. Power Factor Correction Market Segmentation
By Reactive Power Outlook (Revenue – USD Million, 2020–2034)
- 0–200 KAVR
- 200–500 KAVR
- 500–1500 KAVR
- Above 1500 KAVR
By Type Outlook (Revenue – USD Million, 2020–2034)
- Automatic
- Fixed
By Sales Channel Outlook (Revenue – USD Million, 2020–2034)
- Distributors
- OEM Direct
By Application Outlook (Revenue – USD Million, 2020–2034)
- Renewable
- Commercial
- Data Center
- EV Charging
U.S. Power Factor Correction Market Report Scope
| Report Attributes | Details |
| Market Size in 2024 | USD 646.91 million |
| Market Size in 2025 | USD 687.34 million |
| Revenue Forecast by 2034 | USD 1,211.47 million |
| CAGR | 6.5% from 2025 to 2034 |
| Base Year | 2024 |
| Historical Data | 2020–2023 |
| Forecast Period | 2025–2034 |
| Quantitative Units | Revenue in USD million and CAGR from 2025 to 2034 |
| Report Coverage | Revenue Forecast, Competitive Landscape, Growth Factors, and Industry Insights |
| Segments Covered |
|
| Competitive Landscape |
|
| Report Format |
|
| Customization | Report customization as per your requirements with respect to countries, regions, and segmentation. |
Source: Polaris Market Research Analysis
FAQ's
The market size was valued at USD 646.91 million in 2024 and is projected to grow to USD 1,211.47 million by 2034.
The market is projected to register a CAGR of 6.5% during the forecast period.
A few key players in the market include ABB Ltd., Schneider Electric SE, Eaton Corporation, Siemens AG, GE Vernova, Hitachi Energy Ltd., TCI LLC, Powerside, Controllix Corporation, and Circutor.
The 0–200 KVAR segment accounted for the largest share of the market in 2024.
The automatic segment is expected to witness the fastest growth during the forecast period.
Download Sample Report of U.S. Power Factor Correction Market
Please fill out the form to request a customized copy of the research report.
