
Carbon Credit Market Demand, Global Analysis Report, 2026-2034
REPORT DETAILS
REPORT DETAILS
ABOUT THIS REPORT
Carbon Credit Market Summary
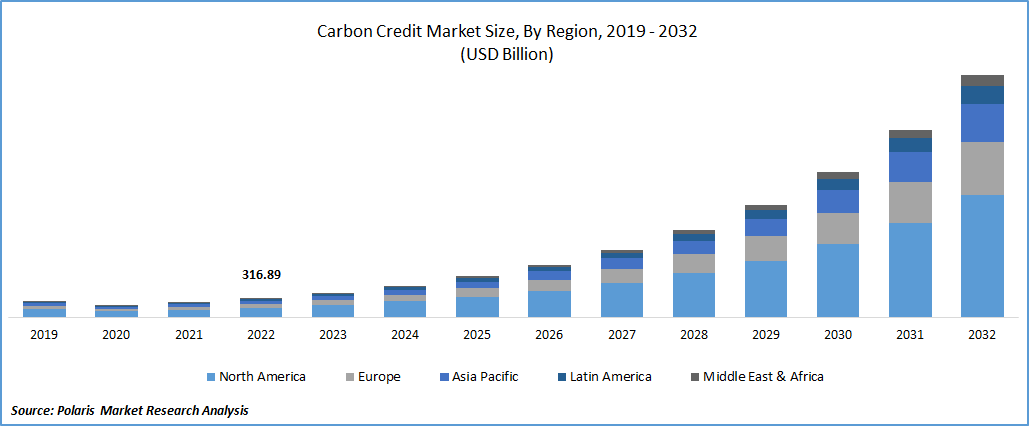
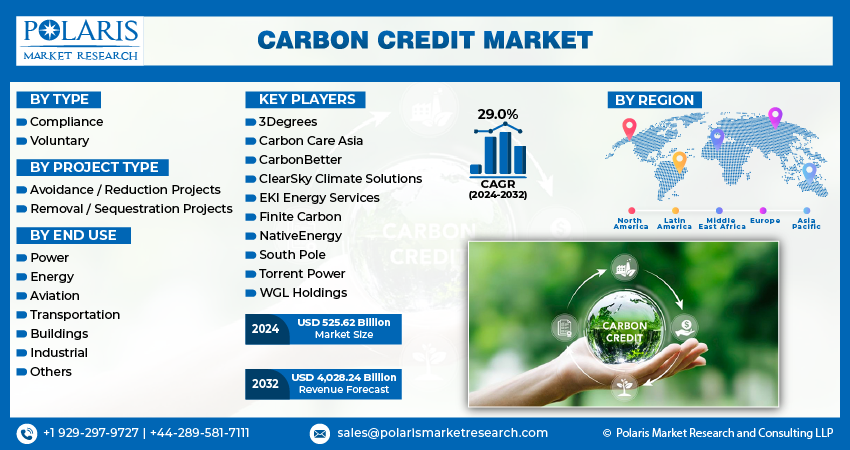
The carbon credit market size was valued at USD 838.3 billion in 2025. The market is projected to grow from USD 1,109.1 billion in 2026 to USD 10,552.1 billion by 2034, exhibiting a CAGR of 32.5% during 2026–2034. The market is driven by corporate net?zero commitments, rising regulatory and compliance schemes (like ETS & CBAM), increasing carbon prices, investor demand for ESG-aligned assets, global climate awareness, and technology?enabled verification (e.g. MRV, blockchain, and carbon capture innovations).
Market Statistics
Key Takeaways
- Europe continues to lead the market, holding 76.80% of the total revenue share in 2034. This is because of continuous strong regulatory enforcement and well-established carbon trading systems like the EU ETS.
- The Asia Pacific is growing the fastest among all regions, with a CAGR of 33.1%. This is because countries like China, South Korea, and Australia are growing in emissions trading schemes and more climate commitments across this region.
- The compliance segment holds 98.0% of the carbon credit market. This is mainly because it is compulsory for companies that operate under regulated emission systems to participate, which keeps demand steady and consistent.
- The avoidance/reduction projects segment has a larger share of 64.4% in the global market. This dominance is due to its established presence and well-defined methodologies, particularly within the domains of renewable energy and energy efficiency.
Industry Dynamics
- The growing corporate sustainability commitments and increasing government regulations on carbon emissions are driving demand for carbon credits.
- Rising investments in renewable energy and reforestation projects further support market expansion.
- Lack of standardization and transparency in credit verification processes hampers market credibility.
- Technological advancements in blockchain and AI offer opportunities to enhance traceability and trust in carbon trading.
The carbon credit market is a mechanism designed to mitigate greenhouse gas emissions by enabling the trading of emission permits, often referred to as carbon credits or carbon offsets. These credits represent either a reduction or removal of one metric ton of carbon dioxide equivalent from the atmosphere. The market operates under two primary structures: compliance markets, which are mandated by regulatory bodies such as national or regional emissions trading schemes, and voluntary carbon markets, where entities choose to offset their emissions for reasons such as corporate social responsibility. In both types of markets, the fundamental principle is to put a price on carbon emissions, thereby incentivizing the reduction of harmful greenhouse gases.
Comparison Matrix (Carbon Credits Vs. Carbon Offsets)
Carbon credits are regulatory permits to emit CO₂ under a cap system. Carbon offsets are voluntary investments in projects that reduce emissions to balance out a company’s carbon footprint.
| Aspect | Carbon Credits | Carbon Offsets |
| Purpose | Allow emissions under a regulatory cap | Compensate for emissions by reducing elsewhere |
| Market Type | Compliance (regulated) markets | Voluntary markets |
| Issuance | Government or regulatory bodies | Verified environmental projects |
| Usage | Mandatory for regulated industries | Optional for companies/individuals |
| Example | Cap-and-trade systems (EU ETS, California) | Tree planting, carbon capture projects |
A significant growth driver is the increasing adoption of net-zero targets by governments and corporations globally, leading to a higher market demand for carbon credits to offset unavoidable emissions. Regulatory frameworks, such as cap-and-trade systems and carbon taxes, further support market development by setting emission limits and encouraging the adoption of low-carbon practices. Additionally, growing corporate and consumer awareness regarding sustainability is fueling the market demand trends, as businesses seek to enhance their brand reputation and meet stakeholder expectations by investing in carbon credits. This confluence of factors indicates a strong market outlook in the coming years.
Carbon Credits Market: Benefits vs Challenges
| Aspect | Benefits | Challenges |
| Emission Reduction | Enforces measurable emission caps, driving real reductions across regulated sectors under systems like the European Union Emissions Trading System | Risk of over-allocation or loopholes can weaken actual impact |
| Cost Efficiency | Enables companies to choose the lowest-cost path (reduce emissions or buy credits) | Carbon price volatility makes budgeting and long-term planning difficult |
| Market Flexibility | Trading platforms such as the Intercontinental Exchange improve liquidity and allow optimization | Market complexity can limit participation, especially for smaller firms |
| Innovation Incentives | Encourages investment in cleaner technologies and energy efficiency | High upfront costs may deter adoption despite long-term gains |
| Global Climate Alignment | Supports compliance with international frameworks like the Paris Agreement | Lack of standardization across regions creates fragmentation |
| Revenue Opportunities | Companies with surplus credits can generate additional income through trading | Regulatory uncertainty can impact credit value and investment confidence |
Market Dynamics
Government Policies and Regulatory Frameworks
Government policies and the establishment of robust regulatory frameworks are significant market drivers for the market expansion. These initiatives create both compliance and voluntary demand for carbon credits. There is also carbon credit Validation Verification and Certification, which makes it more authentic. As per World Bank's State and Trends of Carbon Pricing report 2023, 73 carbon pricing instruments were implemented or scheduled for implementation globally, covering 23.04% of global greenhouse gas (GHG) emissions. In 2023, carbon pricing initiatives generated an estimated $84 billion in revenue globally, a 60% increase from the previous year.
Key developments include the launch of a centralized carbon credit registry and the inclusion of new sectors such as agriculture and waste management. Furthermore, discussions are underway for cross-border carbon credit trading with the EU and Southeast Asian nations. This proactive stance by the government in establishing the necessary infrastructure and regulations provides a strong market growth opportunities by creating clear pathways for carbon credit generation and trading.
Increasing Net-Zero Commitments by Corporations
The growing number of corporations announcing and pursuing net-zero emissions targets propels the carbon credit market demand. To achieve these ambitious goals, companies are increasingly relying on carbon credits to offset emissions that are difficult or impossible to abate directly. Many Indian companies, such as Tata Steel, Mahindra, Infosys, and Reliance Industries, have pledged aggressive Net Zero targets and are actively investing in carbon credit purchases and carbon offset projects, as highlighted by Net Zero India in 2025. As of early 2025, over 6,200 companies had near-term emissions reduction targets validated by the Science Based Targets initiative (SBTi).
Globally, the Science Based Targets initiative (SBTi) is revising its corporate net-zero standard, emphasizing real decarbonization while acknowledging the supplementary role of carbon credits for neutralization of residual emissions, as noted by SGS in a report from April 2025. This increasing corporate ambition and the practical challenges of achieving complete emissions reduction without offsets significantly boost the market demand for carbon credits.
International Cooperation and Agreements
International cooperation and agreements, such as Article 6 of the Paris Agreement, play a vital role in driving the carbon credit market by facilitating cross-border trading and creating a global framework for carbon credits. With the implementation of Article 6, Indian carbon credits are gaining recognition in global carbon markets, making them more valuable and sought after, according to Net Zero India in 2025. The UN Framework Convention on Climate Change (UNFCCC) continues to be central to these efforts, with agreements such as the Glasgow Climate Pact encouraging nations to fund projects that save forests and promote green energy infrastructure, as mentioned by EOS Data Analytics. The ongoing COP29 Climate Conference in Baku has also approved standards to establish an international carbon market, potentially operational next year, aiming to harmonize global efforts to curb emissions, as reported by Vajiram & Ravi in December 2024. This international recognition and the establishment of trading mechanisms enhance the market potential and drive the market by creating a broader demand base and facilitating investments in emission reduction projects worldwide.
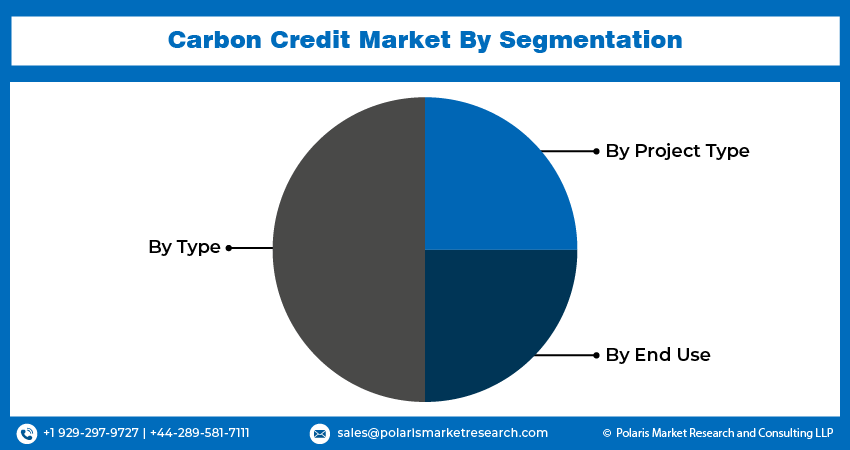
Segment Insights
Market Assessment – By Type
By type, the market is segmented into compliance and voluntary. The compliance segment dominates the market with 98.0% revenue share in 2025. This dominance is primarily attributed to the mandatory participation of entities within regulated jurisdictions. Government-mandated emissions trading schemes, such as those implemented in the European Union, California, and other regions, necessitate that participating organizations acquire and surrender carbon credits for their emissions. The sheer scale of these regulated markets, encompassing major industrial sectors and significant emitters, results in a substantial volume of traded carbon credits. Furthermore, the regulatory certainty provided by these schemes attracts significant investment and market activity, solidifying the compliance market's leading position in terms of overall market size within the carbon credit market.
The voluntary segment is exhibiting the highest growth at CAGR of 37.86%. This rapid expansion is fueled by an increasing awareness and commitment to sustainability among corporations and individuals who are not legally obligated to offset their emissions. Driven by corporate social responsibility initiatives, stakeholder pressure, and the desire to achieve carbon neutrality or net-zero targets, a growing number of entities are voluntarily purchasing carbon credits to compensate for their environmental impact. Innovations in project types within the voluntary carbon credit market, such as nature-based solutions and carbon removal technologies, are also attracting greater interest and investments. While the current market size of the voluntary segment is smaller than the compliance segment, its dynamic nature and the increasing momentum behind voluntary climate action indicate a strong potential for future market development and a higher growth trajectory within the broader carbon credit market.
Market Evaluation – By Project Type
The market, by project type, is segmented into avoidance/reduction projects and removal/sequestration projects. The avoidance/reduction projects segment constitutes a larger market share of 64.4%. This dominance stems from the longer history and established methodologies associated with these project types. Initiatives focused on preventing emissions, such as renewable energy deployment, energy efficiency improvements, and avoided deforestation, have been the primary focus of carbon crediting mechanisms for a longer period. The well-defined frameworks and the relative ease of measuring and verifying emission reductions from these projects have led to a greater supply and demand, thus resulting in a larger market share.
The removal/sequestration projects segment is demonstrating a higher growth with a CAGR of 37.95%. This increasing momentum is driven by the growing recognition of the necessity for active carbon removal to meet ambitious climate goals, particularly those outlined in scenarios limiting global warming to 1.5 degrees Celsius. Projects involving afforestation, reforestation, bioenergy with carbon capture and storage (BECCS), and direct air capture (DAC), along with carbon capture construction materials are gaining prominence and attracting significant investments. Technological advancements and the development of more standardized methodologies for quantifying and verifying carbon removals are contributing to this rapid expansion. While currently holding a smaller market share compared to avoidance/reduction projects, the critical role of carbon removal in achieving long-term climate targets positions this subsegment for substantial growth in the market.
Market Evaluation – By End Use
The market, by end use, is segmented into power, energy, aviation, transportation, buildings, industrial, and others. The industrial segment accounts for 16.9% market share. This significant share is primarily attributed to the high emission levels associated with various industrial processes, including manufacturing, chemical production, and cement production. Regulatory pressures and the implementation of carbon pricing mechanisms often target these heavy-emitting sectors, compelling industrial entities to participate actively in carbon markets to manage their compliance obligations and mitigate financial risks associated with their emissions. Consequently, the substantial emission footprint of the industrial sector translates into the highest demand for carbon credits in industrial settings.
The aviation sector is exhibiting the highest growth at a CAGR of 36.80% in terms of end use. This rapid expansion is driven by increasing pressure on the aviation industry to address its significant contribution to greenhouse gas emissions. The implementation and anticipated expansion of international and regional carbon offsetting schemes, such as the Carbon Offsetting and Reduction Scheme for International Aviation (CORSIA), are creating a substantial and growing demand for carbon credits from airlines. Furthermore, advancements in sustainable aviation fuels and other emission reduction technologies are still in early stages of widespread adoption, making carbon offsetting a crucial near-to-medium-term strategy for the aviation industry to achieve its emissions reduction targets, thus fueling the high growth rate of this segment.
Applications of Carbon Credit
| Use Case | Description | Key Benefit |
| Corporate Sustainability Compliance | Companies use carbon credits to meet emission caps under regulated systems like the European Union Emissions Trading System | Ensures legal compliance while maintaining operations |
| Government Mandates (Cap-and-Trade) | Governments allocate credits to limit total emissions across industries | Controls national and sector-wide carbon output |
| Carbon Trading Markets | Credits are traded on platforms such as Intercontinental Exchange | Enables price discovery and liquidity |
| Cost Optimization | Firms choose between reducing emissions or purchasing credits based on cost efficiency | Minimizes overall compliance cost |
| Industrial Transition Support | High-emission sectors use credits while shifting to cleaner technologies | Allows gradual decarbonization |
| International Climate Commitments | Countries use credits to help meet targets under the Paris Agreement | Supports global emission reduction goals |
Regional Analysis
The carbon credit market exhibits diverse regional dynamics, with varying levels of market maturity, regulatory frameworks, and adoption rates across different geographies. Europe holds the largest share of 76.80% of the market in 2025. This dominant position is primarily attributed to the well-established and comprehensive European Union Emissions Trading System (EU ETS), which is one of the largest and most liquid carbon markets globally. The stringent regulatory framework, broad sectoral coverage, and long-standing operational history of the EU ETS have created a substantial demand for carbon allowances and fostered a mature market ecosystem. Furthermore, strong corporate sustainability commitments and active participation in the voluntary carbon market by European entities contribute significantly to the region's leading market share.
The Asia Pacific market is presently demonstrating the highest growth rate with a CAGR of 33.1%. This rapid expansion is fueled by several factors, including the increasing implementation of national and sub-national emissions trading schemes in countries such as China, South Korea, and Australia. The region's significant industrial base and growing focus on climate change mitigation are driving substantial demand for carbon credits. Moreover, the vast potential for carbon offset projects, particularly in forestry and renewable energy across Asia Pacific, is attracting considerable investments and market activity, positioning the region for the most dynamic growth within the global carbon credit market.
Key Players and Competitive Insights
A few major participants actively operating in the market include European Energy Exchange AG; Intercontinental Exchange, Inc.; CBL Markets (Xpansiv); AirCarbon Pte. Ltd.; Climate Impact X Pte. Ltd.; South Pole Carbon Asset Development Ltd.; Verra; Gold Standard (administered by South Pole); EcoAct (Atos); First Climate (ENGIE); ALLCOT AG; and EKI Energy Services Ltd.
Competitive analysis of the market reveals a landscape characterized by increasing activity and a growing number of participants. Exchanges and trading platforms play a crucial role in providing infrastructure and price discovery. Project developers and aggregators focus on generating and supplying carbon credits from various project types. Standard-setting organizations ensure the quality and integrity of carbon credits through the development of robust methodologies and verification processes. The market is also witnessing the entry of technology providers offering solutions for tracking, trading, and managing carbon credits. Competition is intensifying as market demand grows, driving innovation in project development, trading mechanisms, and the application of digital technologies to enhance transparency and efficiency.
South Pole Carbon Asset Development Ltd. is located in Zurich, Switzerland. The company offers a comprehensive range of services related to carbon credits, including the development of carbon offset projects across various sectors such as renewable energy, forestry, and community-based initiatives. They also provide carbon credit sourcing and trading services, helping organizations to understand and navigate the complexities of the voluntary carbon market and achieve their climate targets. Their extensive portfolio of high-quality carbon credits and their expertise in project development make them a relevant player in supplying carbon offsets to meet the increasing market demand.
Verra is based in Washington, D.C., USA. This organization operates as a nonprofit that develops and manages standards for carbon credits, most notably the Verified Carbon Standard (VCS). Verra does not directly buy or sell carbon credits but provides the framework for the certification of emission reduction and removal projects. Their standards ensure the environmental integrity and credibility of carbon credits generated worldwide, making them a fundamentally relevant entity in the carbon credit market by providing the necessary assurance and guidelines that underpin the trading and utilization of carbon credits by other market participants.
List of Key Companies
- AirCarbon Pte. Ltd.
- ALLCOT AG
- CBL Markets (Xpansiv)
- Climate Impact X Pte. Ltd.
- EcoAct (Atos)
- EEX (European Energy Exchange AG)
- EKI Energy Services Ltd.
- First Climate (ENGIE)
- Gold Standard (administered by South Pole)
- ICE (Intercontinental Exchange, Inc.)
- Verra
Carbon Credit Market Industry Developments
- March 2026: launch of the Indian Carbon Market Portal, a new central platform for the implementation and administration of the Carbon Credit Trading Scheme (CCTS). A digital platform takes care of registration, monitoring, reporting, and verification (MRV), which makes it possible for emissions to be reduced through the market and helps India reach its net-zero goals. (Source: pib.gov.in)
- December 2025, EcoSecurities got a UK PACT technical assistance contract to help Indonesia's voluntary carbon market. EcoSecurities, along with local partner INDEF, will help Indonesia's "PROTECT" program over the course of 15 months by improving the registry design, MRV systems, Article 6 operational rules, and stakeholder engagement. (Source: ecosecurities.com)
- April 2025, the French Minister for Ecological Transition, Biodiversity, Forests, the Sea, and Fisheries, Agnès Pannier-Runacher, introduced a new charter promoting Paris-aligned, high-integrity carbon credit use. France made up 12.4% of the EU’s GHG emissions. (Source: vcmintegrity.org)
- March 2025, Singapore entered into an agreement with Bhutan on carbon credit cooperation. The deal establishes a framework for transferring carbon credits from Bhutan’s mitigation projects to Singapore. It supports a greener, more sustainable future for both countries. (Source: nccs.gov.sg)
Market Segmentation
By Type Outlook (Revenue-USD Billion, 2021–2034)
- Compliance
- Voluntary
By Project Type Outlook (Revenue-USD Billion, 2021–2034)
- Avoidance/Reduction Projects
- Removal/Sequestration Projects
By End Use Outlook (Revenue-USD Billion, 2021–2034)
- Power
- Energy
- Aviation
- Transportation
- Buildings
- Industrial
- Others
By Regional Outlook (Revenue-USD Billion, 2021–2034)
- North America
- US
- Canada
- Europe
- Germany
- France
- UK
- Italy
- Spain
- Netherlands
- Russia
- Rest of Europe
- Asia Pacific
- China
- Japan
- India
- Malaysia
- Suth Korea
- Indnesia
- Australia
- Vietnam
- Rest of Asia Pacific
- Middle East & Africa
- Saudi Arabia
- UAE
- Israel
- Suth Africa
- Rest of Middle East & Africa
- Latin America
- Mexic
- Brazil
- Argentina
- Rest of Latin America
Report Scope
| Report Attributes | Details |
| Market Size Value in 2025 | USD 838.3 billion |
| Market Size Value in 2026 | USD 1,109.1billion |
| Revenue Forecast by 2034 | USD 10,552.1 billion |
| CAGR | 32.5% from 2026 to 2034 |
| Base Year | 2025 |
| Historical Data | 2021–2024 |
| Forecast Period | 2026–2034 |
| Quantitative Units | Revenue in USD billion and CAGR from 2026 to 2034 |
| Report Coverage | Revenue Forecast, Market Competitive Landscape, Growth Factors, and Industry Insights |
| Segments Covered |
|
| Regional Scope |
|
| Competitive Landscape |
|
| Report Format |
|
| Customization | Report customization as per your requirements with respect to countries, regions, and segmentation. |
How is the report valuable for an organization?
Workflow/Innovation Strategy: The carbon credit market has been segmented on the basis of type, project type, and end use. Moreover, the study provides the reader with a detailed understanding of the different segments at both the global and regional levels.
Market Entry Strategies: A robust growth and marketing strategy for the market necessitates a multi-faceted approach. Educational initiatives are crucial to enhance understanding and build trust among potential participants, highlighting the environmental and economic benefits of carbon credits. Strategic collaborations with industry associations and sustainability-focused organizations can expand market reach and credibility. Leveraging digital platforms and data analytics can improve market transparency and facilitate easier access for buyers and sellers. Furthermore, advocating for clear and consistent regulatory frameworks will foster greater market confidence and drive participation from both compliance and voluntary actors. Emphasizing the tangible impact of carbon credit investments on climate change mitigation will also be key to attracting environmentally conscious businesses and individuals, thereby fueling market growth.
FAQ's
The market size was valued at USD 838.3 billion in 2025 and is projected to grow to USD 10,552.1 billion by 2034.
The market is projected to register a CAGR of 32.5% during the forecast period.
Europe held the largest share of the market in 2025.
A few key players in the market include European Energy Exchange AG; Intercontinental Exchange, Inc.; CBL Markets (Xpansiv); AirCarbon Pte. Ltd.; Climate Impact X Pte. Ltd.; South Pole Carbon Asset Development Ltd.; Verra; Gold Standard (administered by South Pole); EcoAct (Atos); First Climate (ENGIE); ALLCOT AG; and EKI Energy Services Ltd.
The compliance segment accounted for a larger share of the market in 2025.
Following are a few of the market trends: ? Increased Focus on High-Quality Credits: There is a growing emphasis on the quality and integrity of carbon credits, with buyers increasingly seeking certified and verified projects that demonstrate real and additional emission reductions or removals. Initiatives such as the Integrity Council for the Voluntary Carbon Market (ICVCM)'s Core Carbon Principles are driving this trend. ? Growing Demand for Carbon Removal: While avoidance and reduction projects still dominate, there's a significant rise in demand for carbon removal credits from projects such as reforestation, afforestation, bioenergy with carbon capture and storage (BECCS), and direct air capture (DAC), along with Carbon Capture, Utilization and Storage as these are seen as crucial for achieving net-zero targets. ? Integration of Technology: Digital technologies such as blockchain and AI are being increasingly adopted to enhance transparency, traceability, and verification in carbon credit markets, addressing concerns about double counting and lack of transparency.
A carbon credit is a permit or certificate representing one metric ton of carbon dioxide equivalent that has been either prevented from being emitted into the atmosphere or removed from it through a specific project or activity. These credits are tradable instruments, allowing entities that exceed their emission allowances to purchase credits from those that have reduced their emissions below the permitted level or have undertaken carbon removal projects. The fundamental purpose of carbon credits is to put a financial value on reducing greenhouse gas emissions, thereby incentivizing emission reductions and the development of climate-friendly projects within both regulated compliance markets and voluntary carbon markets.
Research Methodology
A robust system of research, verification, and forecasting designed to ensure reliable and actionable market insights.
Polaris Market Research & Consulting, Inc. uses a clear and structured approach to deliver insights that clients can rely on. The process combines detailed primary and secondary research, including direct communication with industry experts. The detailed information helps build a complete picture of market trends and developments. Secondary data is gathered from credible sources such as industry reports, company filings, government source links, and trusted organization databases. It is then cross-checked through discussions with key stakeholders across the value chain. Market size and forecasts are developed using both bottom-up and top-down methods to ensure accuracy and consistency in the final results.
1. Project Setup
Step 1 & 2:
- We start every project by clearly understanding the client’s objective or goal, then defining the market scope, and aligning regions, segments, and timelines.
- Once the foundation is set, we collect data from all-around of sources, including company reports, government databases, and paid industry platforms.
- Our research is based on secondary data, which helps us build a strong understanding of the market across regions and industries. Then we validate this information through primary research by speaking directly with industry experts, companies, and stakeholders.
- By combining secondary and primary research, we ensure that our market insights are accurate, practical, and closely aligned with real market conditions.
2. Data Collection
We gather information from both public and verified sources:
3. Data Structuring
Step 3:
- All collected data is organized into a consistent format to ensure accurate analysis. Since inputs come from multiple sources, they are standardized and aligned before use.
- The data is segmented by product, application, and region, and mapped across a defined historical period (2020–2024). All values are converted into common units (USD Mn/Bn), and volume and pricing are aligned where required to estimate revenue.
- Any overlaps or inconsistencies are reviewed and adjusted to maintain accuracy (<5% variance threshold).
- The result is a structured dataset that allows for clear comparison across regions and supports reliable analysis and forecasting.
Structured Market Dataset, USD Mn/Bn
| Region | Segment | VolumeUnits | Avg PriceUSD | RevenueUSD Mn | Share % |
|---|---|---|---|---|---|
| North America | Product A | 250 | 2.5 | 500 | 15% |
| Product A | XX | XX | XX | XX | |
| Product A | XX | XX | XX | XX | |
| Consistent methodology applied across regions | |||||
4. Market Estimation
Step 4: TOP-DOWN APPROACH
- We start with the overall market size at a global or macro level.
- The market is then narrowed down based on scope and industry relevance.
- We apply penetration rates and split the data by region and segment.
- This helps us estimate the market size for specific segments.
- The numbers are validated through cross-checks to ensure accuracy.
Step 5: BOTTOM-UP APPROACH
- We begin by analyzing data from leading companies in the market.
- Revenue data is collected and mapped across different segments.
- The data is then aggregated to estimate the total market size.
- To fill in any gaps, adjustments are made based on industry standards.
- Validation checks make sure that the results are correct.
5. Forecasting
Step 6:
At Polaris Market Research & Consulting, Inc., we employ a methodical forecasting strategy. This approach blends the analysis of historical data with real-time market validation. To forecast future trends with precision, we examine past patterns, pricing fluctuations, and the interplay of supply and demand. To ensure our conclusions reflect the present market landscape, we actively seek input from industry experts and key stakeholders.
To refine our predictions, we carefully consider critical elements such as market drivers and restraints, fluctuations in raw material costs, emerging technologies, and the production capabilities of various regions. Furthermore, we assess regulatory frameworks and potential policy shifts to gauge their potential impact on market expansion.
All this information is synthesized to generate precise forecasts for each segment and region. These forecasts illuminate the current state of the market and highlight forthcoming opportunities.
6. Validation & Triangulation
Step 7:
In the final stage, we validate all our estimates using a triangulation method, where data is cross-checked from multiple reliable sources, like company data, primary interviews, and secondary research. This helps us make sure that our numbers are correct and fit with the rest of the market.
This process involves verifying data consistency across various segments and geographic areas. It also requires comparing historical trends with the assumptions support the forecast. Any discrepancies involve adjustments to ensure everything remains aligned and dependable.
Once the data is finalized, we prepare the final outputs, including market size estimates, segment-wise breakdowns, and growth metrics. These are delivered in structured formats such as tables, charts, and data files for easy analysis and use.
We collaborate closely with clients, ensuring the final products align with their requirements. This includes offering tailored adjustments, supplementary data analyses, and continuous assistance. Furthermore, we monitor market trends post-delivery, providing updates and refinements to maintain the insights' relevance as time passes.
Triangulation Framework
Estimates are cross-verified across three sources:
Company-level data
• Primary inputs from industry participants
• Secondary benchmarks and published data
Variance maintained within +5-10%
Adjustments applied to align estimates
Segment values validated against overall market structure
Data Consistency & Integrity
Segment totals validated to 100%
Regional estimates aligned with global market size
Historical trends compared against forecast outputs
Assumptions reviewed for cross-segment and regional alignment
Final Outputs
Deliverables
Client Alignment & Support
- Deliverables are aligned with defined client requirements and scope
- Custom data cuts and segment splits are incorporated as required
- Post-delivery queries are addressed through analyst interactions
- Additional clarifications and data support are provided upon request
Client Continuity & Updates
- Market developments are tracked post-delivery to capture changes in key trends
- Updated data and revisions are provided based on new market inputs
- Additional refinements and data cuts are shared as required
- Continued analyst engagement supports evolving client requirements
Download Sample Report of Carbon Credit Market
Please fill out the form to request a customized copy of the research report.
